Mix of destinations and sedentary behavior among Brazilian adults: a cross-sectional study
←
→
Page content transcription
If your browser does not render page correctly, please read the page content below
Florindo et al. BMC Public Health        (2021) 21:347

 RESEARCH ARTICLE                                                                                                                                    Open Access

Mix of destinations and sedentary behavior
among Brazilian adults: a cross-sectional
study
Alex Antonio Florindo1,2,3* , Gavin Turrell4, Leandro Martin Totaro Garcia3,5, João Paulo dos Anjos Souza Barbosa3,
Michele Santos Cruz2,3, Marcelo Antunes Failla6, Breno Souza de Aguiar6, Ligia Vizeu Barrozo7 and
Moises Goldbaum8

  Abstract
  Background: Sedentary behavior is influenced by contextual, social, and individual factors, including the built
  environment. However, associations between the built environment and sitting time have not been extensively
  investigated in countries with economies in transition such as Brazil. The objective of this study is to examine the
  relationship between sitting-time and access to a mix of destinations for adults from Sao Paulo city, Brazil.
  Methods: This study uses data from the Health Survey of Sao Paulo. Sedentary behavior was assessed by a
  questionnaire using two questions: total sitting time in minutes on a usual weekday; and on a usual weekend day.
  The mix of destinations was measured by summing the number of facilities (comprising bus stops, train/subway
  stations, parks, squares, public recreation centres, bike paths, primary health care units, supermarkets, food stores,
  bakeries, and coffee-shops) within 500 m of each participant’s residence. Minutes of sitting time in a typical
  weekday and weekend day were the outcomes and the mix of destinations score in 500 m buffers was the
  exposure variable. Associations between the mix of destinations and sitting time were examined using multilevel
  linear regression: these models accounted for clustering within census tracts and households and adjusted for
  environmental, sociodemographic, and health-related factors.
  Results: After adjustment for covariates, the mix of destinations was inversely associated with minutes of sitting
  time on a weekday (β=− 8.8, p=0.001) and weekend day (β=− 6.1, p=0.022). People who lived in areas with a
  greater mix of destinations had shorter average sitting times.
  Conclusion: Greater mix of destinations within 500 m of peoples’ residences was inversely associated with sitting
  time on a typical weekday and weekend day. In Latin American cities like Sao Paulo built environments more
  favorable for walking may contribute to reducing sedentary behavior and prevent associated chronic disease.
  Keywords: Built environment, Mix of destinations, Sedentary behavior, Sitting time, Adults, Brazil

                                                                                        Background
                                                                                        Sedentary behavior - i.e. extended periods of sitting tim-
                                                                                        ing - is a significant public health problem: it accounts
* Correspondence: aflorind@usp.br                                                       for 3.8% of all-cause mortality [1], and increases the risk
1
 School of Arts, Sciences and Humanities, University of Sao Paulo, Rua
Arlindo Bettio, Sao Paulo, SP 1000, Brazil                                              of cardiovascular disease and diabetes, and premature
2
 Graduate Program in Nutrition in Public Health, School of Public Health,               mortality [2–4]. In addition, sedentary behavior is associ-
University of Sao Paulo, Sao Paulo, Brazil                                              ated with loss of functional capacity and daily life
Full list of author information is available at the end of the article

                                         © The Author(s). 2021 Open Access This article is licensed under a Creative Commons Attribution 4.0 International License,
                                         which permits use, sharing, adaptation, distribution and reproduction in any medium or format, as long as you give
                                         appropriate credit to the original author(s) and the source, provide a link to the Creative Commons licence, and indicate if
                                         changes were made. The images or other third party material in this article are included in the article's Creative Commons
                                         licence, unless indicated otherwise in a credit line to the material. If material is not included in the article's Creative Commons
                                         licence and your intended use is not permitted by statutory regulation or exceeds the permitted use, you will need to obtain
                                         permission directly from the copyright holder. To view a copy of this licence, visit http://creativecommons.org/licenses/by/4.0/.
                                         The Creative Commons Public Domain Dedication waiver (http://creativecommons.org/publicdomain/zero/1.0/) applies to the
                                         data made available in this article, unless otherwise stated in a credit line to the data.
Florindo et al. BMC Public Health (2021) 21:347 Page 2 of 7
activities and poorer quality of life in elderly people [5], sampled randomly from each tract. The data were col-
with weight gain from childhood to adulthood [6], and lected using face-to-face interviews in households. The
with an unhealthy diet and food consumption [7]. interviews were conducted between September 2014 and
Sedentary behavior is associated with different correlates December 2015, and 73.4% of eligible residents who
measured at intrapersonal, social, physical environmental, were contacted agreed to participate [15].
and policy levels [8]. Early studies examining relationships Georeferencing resulted in 3145 participants aged 18
between the built environment and sedentary behavior years or more having their residential address geocoded
show that low walkability was associated with more televi- [16]. More details can be obtained from other publica-
sion viewing in Australian females [9], and in North Ameri- tions [16–18]. The ISA forms the baseline dataset for a
can adults [10]. A study conducted in 11 cities with 5.712 recently funded longitudinal study of the “ISA-Physical
adults which measured sedentary behavior using acceler- Activity and Environment Study”, which is being con-
ometers found that greater street connectivity and a more ducted among adults in Sao Paulo city, Brazil. A key
diverse land use mix were associated with fewer minutes focus of this prospective research will be to verify the ro-
per day of sedentary time; and higher residential density bustness of the cross-sectional studies that have been
and higher pedestrian infrastructure were associated with conducted using the Sao Paulo Health Survey baseline.
more minutes per day of sedentary time [11]. A systematic
review showed that access and proximity to general services Sedentary behavior
and facilities and recreation facilities were inversely associ- Sedentary behavior data were collected using the Inter-
ated with total sitting time [12]. Another cross-sectional national Physical Activity Questionnaire (IPAQ) [19]
study showed that the walkability index calculated on the and measured on the basis of two questions: 1) Total sit-
basis of land use mix, street connectivity, and residential ting time on a usual weekday; 2) Total sitting time on a
density, was positively associated with sedentary behavior in usual weekend day. For analysis, two outcomes were
Belgian adults [13]. However, other systematic reviews have used: 1) Continuous measures of minutes of sitting time
found limited evidence for an association between sitting on a typical weekday; and 2) Continuous measures of
time and access to destinations, land use mix, and street minutes of sitting time on a typical weekend day.
connectivity [8]. Therefore, studies examining the associ-
ation between the built environment and sedentary behav- Mix of destinations
ior have produced inconsistent and inconclusive evidence, Walkable destinations within each participant’s residential
and relationships might differ depending on the domain of catchment were captured using georeferencing procedures
sedentary behavior being investigated [14]. [16–18] applied to publicly available datasets, and in-
In addition, we have few studies in low and middle- cluded eleven destinations: 1. Bus stops; 2. Train/subway
income countries that describe the relationship between stations; 3. Parks; 4. Squares; 5. Public recreation centres;
the built environment and sedentary behavior. For ex- 6. Bike paths; 7. Primary health care units; .8 Supermar-
ample, the study of Owen et al. [11] involved adults from kets; 9. Food stores; 10. Bakeries; and 11. Coffee shops.
Curitiba, Brazil, and Bogota, Colombia. The low and The dataset for items 1 to 8 pertain to places in 2016 and
middle-income countries are economies in transition was obtained mainly from the open site GEOSAMPA <
and their built environments are different from those http://geosampa.prefeitura.sp.gov.br/PaginasPublicas/_
found in high-income countries. Therefore, the objective SBC.aspx>, and items 9 to 11 were sourced from the
of this study is to examine the relationship between the Health Surveillance Registration database from Sao Paulo
mix of destinations and total sitting time in adults from city associated with the National Economic Activity Clas-
Sao Paulo city, a densely populated Latin American sification in November 2016.
megalopolis in a middle-income country (Brazil). We calculated a measure of destination diversity in
three phases: 1) by firstly summing the number of each
Methods destination within a 500 m radial buffer of each partici-
Health survey of Sao Paulo pant’s home address; 2) by secondly, we categorized the
This study used data from the Health Survey of Sao participants into two groups based on the sum for each
Paulo or Inquérito de Saúde de São Paulo – ISA in por- destination. The participants that were at or below the
tuguese. Data collection was completed in 2015, with sample median had scored 0, and participants were above
4043 participants who lived in five health administrative the median had scored 1; 3) and thirdly, by the sum of all
areas in Sao Paulo city. The sampling process has been destination obtained in the second phase we created the
described in more detail elsewhere [15]. Briefly, the sur- mix destination score that ranged from 0 to 8 (mean=3.07,
vey used a multi-stage sampling design: from the five SD=1.70, median=3 interquartile range: 4 ;2). This process
health administration areas in Sao Paulo, 150 census has been described in more detail elsewhere in a study
tracts were randomly selected, and then households were also used the Sao Paulo Health Survey which showed thatFlorindo et al. BMC Public Health (2021) 21:347 Page 3 of 7
the mix of destination score within a 500 m buffer was sig- presented as beta coefficients (β) with 95% confidence
nificantly associated with walking for transport [18]. intervals.
Ethics approval
Covariates
The Ethics Committee of the School of Arts, Sciences,
We used age (18–29 years, 30–39 years, 40–49 years,
and Humanities at the University of Sao Paulo approved
50–59 years, 60 years or more), education (incomplete
the study (process number 55846116.6.0000.5390).
elementary school, incomplete high school, complete
high school, incomplete undergraduate or above), mari-
Results
tal status (singles, married/with partners, separated/wid-
Mean sitting time during weekdays was higher than
owers), obesity (in two categories: BMI < 30 kg/m2 or
weekends (Table 1). Mean sitting time was higher for
above), physical activity (< 150 min per week or above
men, persons aged 18–29, the highly educated, those
evaluated by IPAQ long form) [19], self-report of dis-
who engaged in insufficient physical activity, classified as
eases diagnosed by physicians (none or at least one of
obese, who reported having at least one disease, single,
the following: hypertension; diabetes; myocardial infarc-
who owned a private motor vehicle, living in the Mid-
tion; cardiac arrhythmia; other heart disease; cancer;
west region of the city, and who had lived at their
arthritis, rheumatism or arthrosis; osteoporosis; asthma
current residence for less than one year.
or asthmatic bronchitis; emphysema, chronic bronchitis
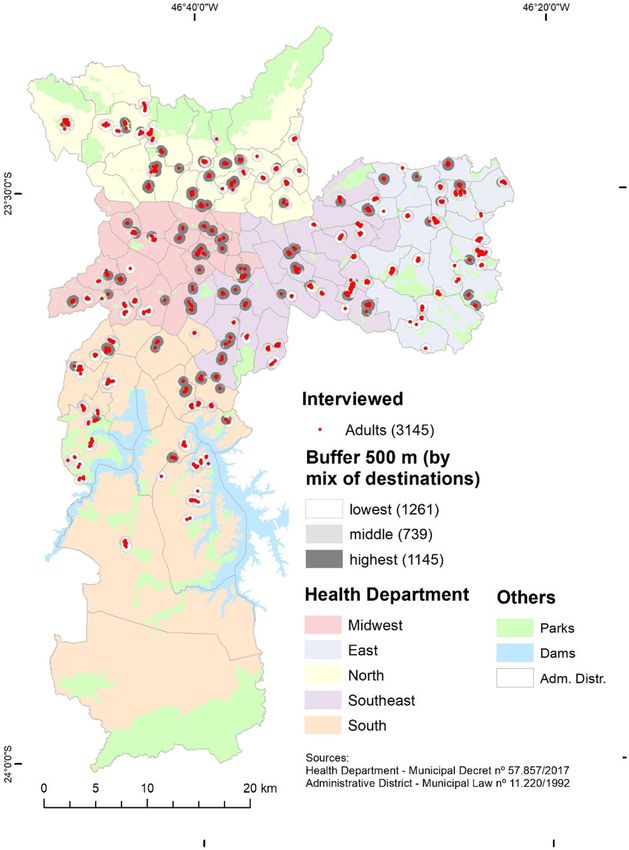
Buffers with the highest concentration of destinations
or chronical obstructive pulmonary diseases; rhinitis;
were found in the central areas of the city (Fig. 1) and
chronic sinusitis; other lung disease; tendonitis, repeti-
sitting time was higher in places with the lowest mix of
tive strain injury or work-related musculoskeletal disor-
destinations (Table 2).
ders; cerebral vascular accident or stroke; spine disease
There was a statistically significant association be-
or spine problem), smoking status (yes or no), car or
tween the mix of destinations score and minutes of sit-
motorcycle ownership (yes or no); time living in the
ting on a typical weekday and weekend day after
same residence (< 1 year, ≥1 year or < 5 years, > 5 years),
adjustment for the covariates (Table 3). For each point
and region where people lived in Sao Paulo city (North,
increase in destination score mix, we had a mean de-
South, Midwest, Southeast, and East). These covariates
crease in 8.8 min of sitting time on a typical weekday
were selected based on the findings of systematic reviews
and a mean decrease in 6.1 min of sitting time on a typ-
about sedentary behavior correlates in adults [8, 12, 14]
ical weekend day.
and in another original study that examined the relation-
ship between walking for transportation and built envir-
Discussion
onment variables [18].
The main result of this study showed that after adjust-
ment for sociodemographic, environmental, and health-
Statistical analysis related factors, people with a greater mix of destinations
For this study, we excluded from the analyses people within 500 m of their residence reported engaging in
who reported zero minutes of sitting time, those who fewer minutes of sitting time on a typical weekday and
did not answer the sitting time question in the survey, weekend day.
and those with missing data on the covariates. These ex- The results of this study are consistent with the find-
clusions resulted in a final analytic sample of n=3052 ings of previous research examining the relationship be-
participants for sitting time on a typical weekday, and tween the mix of destinations and sedentary behavior. A
n=2993 participants for sitting time on a typical week- systematic review showed that access to destinations was
end day. The analyses are conducted in two stages. First, inversely associated with sitting time, particularly access
we present mean sitting times for each of the sociode- to leisure and transportation destinations [14]. A cross-
mographic, health, and environmental covariates, and sectional study conducted with Japanese adults living in
for participants who were grouped into the two Tokyo found indicative (p-value = 0.051) results that ac-
destination-mix categories based on the median split. cess to 30 or more different types of destinations might
Second, we examine the multivariable association be- be inversely associated with sitting time when using
tween the destination mix index and sitting time using transportation to access leisure activities [20]. However,
multilevel linear regression without and with adjustment a longitudinal study with adults from Nerima and
for the covariates. The multilevel analysis accounted for Kanuma cities in Japan did not find an association be-
clustering within census-tracts and households. All ana- tween screen time and access to different types of desti-
lyses were conducted using Stata version SE 12.1. (Stata- nations [21]. In addition, studies conducted with adults
Corp LP, College Station, USA). We used the xtmixed from high-income countries which have used accelerom-
command for linear models and the results are eters to measure sedentary behaviour have either foundFlorindo et al. BMC Public Health (2021) 21:347 Page 4 of 7
Table 1 Descriptive statistics for sitting time on a typical weekday and weekend day by social, demographic, health, and
environmental variables, Sao Paulo city, Brazil, 2015
Minutes of sitting time on a typical day
Weekdays Weekend days
n=3052 n=2993
mean (SD) mean (SD)
Overall 279.8 (199.2) 260.5 (183.5)
Gender
Men 295.3 (203.7) 274.7 (191.5)
Women 268.3 (195.1) 249.8 (176.5)
Age
18–29 347.0 (217.7) 281.7 (200.5)
30–39 277.1 (203.9) 255.8 (179.6)
40–49 255.7 (187.7) 242.9 (172.9)
50–59 244.0 (177.8) 241.2 (163.6)
60 or more 260.5 (185.6) 265.1 (184.7)
Education
Incomplete elementary school 240.1 (195.8) 256.2 (197.9)
Incomplete high school 249.9 (187.1) 248.5 (180.1)
Complete high school 282.8 (194.1) 255.1 (169.3)
Undergraduate incomplete or more 353.1 (202.6) 285.2 (185.4)
Physical activity
≥ 150 min per week 261.8 (187.0) 243.7 (170.0)
< 150 min per week 354.8 (229.2) 325.7 (214.9)
Body Mass Index (kg/m2)
≥30 kg/m2 294.4(195.2) 279.9(183.9)
< 30 kg/m2 275.9(199.4) 255.6(181.8)
Presence of diseases
Yes 282.5 (198.3) 268.1 (188.5)
No 272.8 (199.4) 244.4 (173.3)
Smoking status
Yes 284.5 (203.3) 270.9 (196.1)
No 279.0 (198.5) 258.5 (181.0)
Marital Status
Married, or with partners 262.2 (190.1) 251.4 (176.3)
Singles 322.6 (214.6) 275.3 (193.9)
Separated, or widowers 270.0 (189.9) 264.5 (183.1)
Car or motorcycle ownership
Yes 288.9 (197.5) 260.7 (175.8)
No 268.6 (200.7) 260.3 (192.5)
Region of residence
North 284.0 (212.4) 262.2 (197.2)
South 272.0 (180.8) 247.2 (168.7)
Midwest 311.9 (198.0) 285.3 (184.5)
Southeast 258.0 (204.5) 247.5 (183.4)
East 268.3 (191.4) 254.9 (177.6)
Length of residence
< 1 year 300.3 (212.7) 288.9 (206.3)
> 1 year and < 5 years 285.8 (203.8) 247.7 (172.4)
> 5 years 275.6 (195.6) 259.5 (182.4)
SD (standard deviations)
no association with built environment variables [22, 23] other shops, within 500 m of each participant’s resi-
or that people living in areas with higher walkability en- dence. In a previous study, also using the Health Survey
gage in more minutes of sitting time [13], a result that of Sao Paulo sample, it was found that a greater mix of
was contrary to expectations. destinations close to home was associated with an in-
The mix of destinations measure used in this study in- creased likelihood of walking [18]; and a systematic re-
cluded access to green space, physical activity, and trans- view reported that physical activity was inversely
port nodes, primary health care units, supermarkets, and associated with sitting time in adults [24].Florindo et al. BMC Public Health (2021) 21:347 Page 5 of 7
Fig. 1 Destinations mix according to health administration area where people reside in Sao Paulo city, Brazil, 2016. Shapefiles of Health
Departments are provided by the Municipal Health Secretariat. The shapefile of the Administrative Districts was furnished by the Municipal
Secretariat for Urban Development. Both are not under license and publicly available at http://geosampa.prefeitura.sp.gov.br/PaginasPublicas/_
SBC.aspx#. The map was created with the software ArcGIS Desktop 10.7, version 10.7.0.10450, Copyright (C)1999–2018 Esri Inc.
Table 2 Descriptive statistics and bivariate analysis for sitting time according to mix of destination scores, Sao Paulo city, Brazil
Minutes of sitting time
Typical weekdays Typical weekend days
Destination mix scores Mean (SD) Mean (SD)
At or below the median* 290.1 (206.0) 271.6 (191.0)
Above the median* 273.0 (194.3) 253.1 (178.0)
p-value** 0.039 0.014
* Median score for mix of destination within each 500 m buffer; **p values based on a Kruskal-Wallis test; SD (standard deviations)Florindo et al. BMC Public Health (2021) 21:347 Page 6 of 7
Table 3 Multilevel linear regression results examining the association between mix of destinations* and minutes sitting on a typical
weekday and weekend day among adults from Sao Paulo City, Brazil
Unadjusted Adjusted**
β 95%CI p value β 95%CI p value
Minutes on a typical weekday
Destination mix score* −4.63 −9.94, 0.66 0.086 −8.83 −14.27, −3.38 0.001
Minutes on a typical weekend day
Destination mix score* −4.89 −9.91, 0.13 0.056 −6.10 −11.32, −0.89 0.022
*Destination mix was measured using an index, which ranged from 0 to 8 (mean 3.07, SD, median 3.0)
**Adjusted for gender, age, education, marital status, obesity, physical activity, smoking, disease presence, car or motorcycle ownership, region of residence in Sao
Paulo, and length of residence at the surveyed address
The results of this study are important as very few Acknowledgments
studies of the built environment and sedentary behavior Acknowledgments to Health Survey of Sao Paulo Study (Marilisa Berti de
Azevedo Barros, Ph.D., University of Campinas, Brazil; Maria Cecília Goi Porto
have been conducted in densely populated Latin Ameri- Alves, Ph.D., Health of Institute, Sao Paulo, Brazil; Regina Mara Fisberg, Ph.D.,
can cities. In Sao Paulo city, the local government has University of Sao Paulo, Brazil; and Chester Luiz Galvão Cesar, Ph.D.,
introduced policies such as a New Master Plan to ad- University of Sao Paulo, Brazil). Acknowledgments to The University of
Melbourne for the reception of the international visit of Alex Antonio
dress environmental inequities, increase physical activity, Florindo to develop this project in the Melbourne School of Population and
and reduce sedentary behavior [25]. Global Health, Australia. Acknowledgments to Professor Billie Giles-Corti for
This study had several limitations that should be consid- his support of the work in Melbourne School of Population and Global
Health, Australia.
ered when interpreting the results. Firstly, sedentary be-
havior was measured by self-report. Sitting time is a Authors’ contributions
complex behavior for people to recall accurately because AAF had the idea of this study. AAF, GT, LMTG, JPASB, and MSC contributed
to data statistical analysis. AAF, GT, JPASB, MSC, LVG, and MG contributed to
it is necessary to consider all domains of life (work, house- results interpretation. LVG, MAF, BSA contributed to the georeferencing of
hold, leisure, and transportation). In this case, underesti- built environment variables. All authors contributed to drafting, and critically
mation due to measurement error is likely to be present in revising the manuscript and approved the final version.
our findings [8, 26]. Secondly, it is important to repeat our
Funding
study using longitudinal data with residentially stable par- Alex Antonio Florindo received an international scholarship from Sao Paulo
ticipants as a way of adjusting for bias that results from Research Foundation (grant 2014/12681–1) to develop this study and is
receiving a research fellowship from the Brazilian National Council for
neighborhood self-selection (e.g. less sedentary people
Scientific and Technological Development (CNPq) (grant 306635/2016–0).
moving to neighborhoods with more walkable destina- Ligia Vizeu Barrozo is supported by the Brazilian National Council for
tions). For example, a recent systematic review showed Scientific and Technological Development (CNPq) (grant 301550/2017–4). ISA
study was supported by Sao Paulo Research Foundation (grant 2012/22113–
that obesity was inversely associated with walkability in
9) and The Sao Paulo Municipal Health Department (no grant number). ISA-
cross-sectional studies but not in longitudinal studies [27]. Physical Activity and Environment Study is supported by Sao Paulo Research
Thirdly, the findings of this study may have differed had Foundation (grant 2017/17049–3).
we examined the determinants of sitting time in specific
Availability of data and materials
domains of sedentary behavior such as leisure, work, The datasets used during the current study are available from Sao Paulo
transport, and within the household [8, 12, 26]. Health Survey. For permissions to access the data to request for professor
Regina Mara Fisberg by email or phone call, School of Public Health at
University of Sao Paulo, Brazil, email: rfisberg@usp.br, phone: + 55 11 3061–
7701.
Conclusion
A more diverse mix of walkable destinations within 500 Ethics approval and consent to participate
The Ethics Committee of the School of Arts, Sciences, and Humanities at the
m of adults’ homes in Sao Paulo City was associated
University of Sao Paulo approved the study (process number
with fewer minutes of sitting time on a typical weekday 55846116.6.0000.5390).
and weekend day. These results suggest that city plan-
ners and urban designers have an important public Consent for publication
Not applicable.
health role to play in helping to reduce sedentary behav-
iour, promote physical activity, and prevent associated Competing interests
chronic disease in Latin American countries with econ- The authors declare that they have no competing interests.
omies in transition such as Brazil. Author details
1
School of Arts, Sciences and Humanities, University of Sao Paulo, Rua
Arlindo Bettio, Sao Paulo, SP 1000, Brazil. 2Graduate Program in Nutrition in
Abbreviations Public Health, School of Public Health, University of Sao Paulo, Sao Paulo,
IPAQ: International Physical Activity Questionnaire; ISA: Health Survey of Sao Brazil. 3Physical Activity Epidemiology Group, University of Sao Paulo, Sao
Paulo; CI: Confidence interval; OR: Odds Ratio Paulo, Brazil. 4Centre for Research and Action in Public Health, HealthFlorindo et al. BMC Public Health (2021) 21:347 Page 7 of 7
Research Institute, University of Canberra, Canberra, Australia. 5Centre for Bike Paths, Train and Subway Stations. Int J Environ Res Public Health. 2018:
Public Health, Queen’s University Belfast, Belfast, UK. 6Department of 15(4).
Epidemiology and Information, Municipal Government of Sao Paulo, Sao 18. Florindo AA. João Paulo dos Anjos Souza Barbosa, Ligia Barrozo, Douglas
Paulo, Brazil. 7Department of Geography, School of Philosophy, Literature Roque Andrade, Breno Souza de Aguiar, Marcelo Failla, Lucy Gunn, Suzanne
and Human Sciences, University of Sao Paulo, Sao Paulo, Brazil. 8Department Mavoa, Gavin Turrell, Goldbaum M: walking for transportation and built
of Preventive Medicine, School of Medicine, University of Sao Paulo, Sao environment in Sao Paulo city, Brazil. J Transport & Health. 2019;15:100611.
Paulo, Brazil. 19. Craig CL, Marshall AL, Sjostrom M, Bauman AE, Booth ML, Ainsworth BE,
Pratt M, Ekelund U, Yngve A, Sallis JF, et al. International physical activity
Received: 19 January 2020 Accepted: 23 December 2020 questionnaire: 12-country reliability and validity. Med Sci Sports Exerc. 2003;
35(8):1381–95.
20. Liao Y, Sugiyama T, Shibata A, Ishii K, Inoue S, Koohsari MJ, Owen N, Oka K.
Associations of perceived and objectively measured neighborhood
References environmental attributes with leisure-time sitting for transport. J Phys Act
1. Rezende LFM, Sa TH, Mielke GI, Viscondi JYK, Rey-Lopez JP, Garcia LMT. All- Health. 2016;13(12):1372–7.
cause mortality attributable to sitting time: analysis of 54 countries 21. Liao Y, Shibata A, Ishii K, Koohsari MJ, Oka K. Cross-sectional and prospective
worldwide. Am J Prev Med. 2016;51(2):253–63. associations of neighbourhood environmental attributes with screen time in
2. Rezende LFM, Rodrigues Lopes M, Rey-Lopez JP, Matsudo VK, Luiz Odo C. Japanese middle-aged and older adults. BMJ Open. 2018;8(3):e019608.
Sedentary behavior and health outcomes: an overview of systematic 22. Compernolle S, De Cocker K, Mackenbach JD, Van Nassau F, Lakerveld J,
reviews. PLoS One. 2014;9(8):e105620. Cardon G, De Bourdeaudhuij I. Objectively measured physical
3. Wilmot EG, Edwardson CL, Achana FA, Davies MJ, Gorely T, Gray LJ, Khunti environmental neighbourhood factors are not associated with
K, Yates T, Biddle SJ. Sedentary time in adults and the association with accelerometer-determined total sedentary time in adults. Int J Behav Nutr
diabetes, cardiovascular disease and death: systematic review and meta- Phys Act. 2017;14(1):94.
analysis. Diabetologia. 2012;55(11):2895–905. 23. Hinckson E, Cerin E, Mavoa S, Smith M, Badland H, Witten K, Kearns R,
4. Ekelund U, Steene-Johannessen J, Brown WJ, Fagerland MW, Owen N, Schofield G. What are the associations between neighbourhood walkability
Powell KE, Bauman A, Lee IM. Lancet physical activity series 2 executive C, and sedentary time in New Zealand adults? The URBAN cross-sectional
lancet sedentary behaviour working G: does physical activity attenuate, or study. BMJ Open. 2017;7(10):e016128.
even eliminate, the detrimental association of sitting time with mortality? A 24. Mansoubi M, Pearson N, Biddle SJ, Clemes S. The relationship between
harmonised meta-analysis of data from more than 1 million men and sedentary behaviour and physical activity in adults: a systematic review.
women. Lancet. 2016;388(10051):1302–10. Prev Med. 2014;69:28–35.
5. Copeland JL, Ashe MC, Biddle SJ, Brown WJ, Buman MP, Chastin S, Gardiner 25. Department of Urbanism of the Sao Paulo city, 2014. New Master Plan for
PA, Inoue S, Jefferis BJ, Oka K, et al. Sedentary time in older adults: a critical Sao Paulo City. (In Portuguese). .
Sports Med. 2017;51(21):1539. 26. Owen N, Sugiyama T, Eakin EE, Gardiner PA, Tremblay MS, Sallis JF. Adults’
6. Thorp AA, Owen N, Neuhaus M, Dunstan DW. Sedentary behaviors and sedentary behavior determinants and interventions. Am J Prev Med. 2011;
subsequent health outcomes in adults a systematic review of longitudinal 41(2):189–96.
studies, 1996-2011. Am J Prev Med. 2011;41(2):207–15. 27. Barbosa JPAS, Guerra PA, Santos CO, Nunes APOB, Turrell G, Florindo AA.
7. Pearson N, Biddle SJ. Sedentary behavior and dietary intake in children, Walkability, overweight, and obesity in adults: a systematic review of
adolescents, and adults. A systematic review. Am J Prev Med. 2011;41(2): observational studies. Int J Environ Res Public Health. 2019;16:3135.
178–88.
8. Prince SA, Reed JL, McFetridge C, Tremblay MS, Reid RD. Correlates of Publisher’s Note
sedentary behaviour in adults: a systematic review. Obes Rev. 2017;18(8): Springer Nature remains neutral with regard to jurisdictional claims in
915–35. published maps and institutional affiliations.
9. Sugiyama T, Salmon J, Dunstan DW, Bauman AE, Owen N. Neighborhood
walkability and TV viewing time among Australian adults. Am J Prev Med.
2007;33(6):444–9.
10. Kozo J, Sallis JF, Conway TL, Kerr J, Cain K, Saelens BE, Frank LD, Owen N.
Sedentary behaviors of adults in relation to neighborhood walkability and
income. Health Psychol. 2012;31(6):704–13.
11. Owen N, Sugiyama T, Koohsari MJ, De Bourdeaudhuij I, Hadgraft N,
Oyeyemi A, Aguinaga-Ontoso I, Mitas J, Troelsen J, Davey R, et al.
Associations of neighborhood environmental attributes with adults'
objectively-assessed sedentary time: IPEN adult multi-country study. Prev
Med. 2018;115:126–33.
12. O'Donoghue G, Perchoux C, Mensah K, Lakerveld J, van der Ploeg H,
Bernaards C, Chastin SF, Simon C, O'Gorman D, Nazare JA, et al. A
systematic review of correlates of sedentary behaviour in adults aged 18-65
years: a socio-ecological approach. BMC Public Health. 2016;16:163.
13. Van Dyck D, Cardon G, Deforche B, Owen N, Sallis JF, De Bourdeaudhuij I.
Neighborhood walkability and sedentary time in Belgian adults. Am J Prev
Med. 2010;39(1):25–32.
14. Koohsari MJ, Sugiyama T, Sahlqvist S, Mavoa S, Hadgraft N, Owen N.
Neighborhood environmental attributes and adults' sedentary behaviors:
review and research agenda. Prev Med. 2015;77:141–9.
15. Alves M, Escuder MML, Goldbaum M, Barros MBA, Fisberg RM, Cesar CLG.
Sampling plan in health surveys, city of Sao Paulo, Brazil, 2015. Rev Saude
Publica. 2018;52:81.
16. Florindo AA, Barrozo LV, Cabral-Miranda W, Rodrigues EQ, Turrell G,
Goldbaum M, Cesar CLG, Giles-Corti B. Public Open Spaces and Leisure-
Time Walking in Brazilian Adults. Int J Environ Res Public Health. 2017:14(6).
17. Florindo AA, Barrozo LV, Turrell G, Barbosa J, Cabral-Miranda W, Cesar CLG,
Goldbaum M. Cycling for Transportation in Sao Paulo City: Associations withYou can also read