MASTER'S THESIS RELIABILITY-BASED MAINTENANCE PLAN FOR UNDERGROUND DRILLING RIGS - HENRIK THUNBERG - DIVA
←
→
Page content transcription
If your browser does not render page correctly, please read the page content below
MASTER'S THESIS

Reliability-based Maintenance Plan for
 Underground Drilling Rigs

 Henrik Thunberg
 2016

 Master of Science (120 credits)
 Civil Engineering

 Luleå University of Technology
 Department of Civil, Environmental and Natural Resources Engineering
MASTER’S THESIS

Reliability-based Maintenance Plan for Underground Drilling
 Rigs

 Author: Henrik Thunberg, Master of Science in Civil Engineering
 Supervisors: Dr Behzad Ghodrati and Dr Hadi Hoseinie

 Division of Operation and Maintenance Engineering
 Luleå, June 2016
Acknowledgement

ACKNOWLEDGEMENT

After spending two years at Luleå University of Technology, this is the last part of my
Master’s program in Mining and Geotechnical Engineering.

I am very thankful to my parents and my brother for all the motivation and positive energy
they have giving me during this years, thank you.

During my master's thesis, I was supervised by Dr Behzad Ghodrati and Dr Hadi Hoseinie.
They have been most helpful to me and always helped me with professional feedback and
opinions of my thesis.

While doing my research, I have also had great support from Dr Hussan Hamodi Al-Chalabi,
I am greatly thankful for his valuable support.

I would also like to thank the staff at Boliden, who has helped me during this thesis. Special
thanks to Arne Vesterberg, Stig Nilsson, Mats Johansson, Greger Spetz, Erik Fjällström and
all my colleagues at the maintenance departure and in the mines.

Finally, I would like to express my greatest thanks to Nika, who has supported me during my
whole thesis.

 i
Abstract

ABSTRACT

In the mining industry, drilling is one of the key processes. The drilling is the process of
making holes in the walls and face of the underground shafts and rooms. The holes are then
charged and blasted (Al-Chalabi, 2014).
Drilling operations are performed in a harsh environment and are subject to a high number of
failures in its subsystem. The cause of failure is not only environmental, but also the
manoeuvring of the drilling rigs and the maintenance has an impact on the drilling rigs
reliability (Al-Chalabi, 2014).

The purpose of this thesis is to find the optimal maintenance interval for the subsystems
critical for preventing downtime of the drilling rigs. The suggested optimal maintenance
interval will optimise the maintenance schedule and prevent unplanned corrective
maintenance actions.

It has been found in this thesis that up to 78% of the maintenance actions performed is
corrective maintenance actions. By implementing a reliability-based maintenance strategy, the
amount of unplanned corrective maintenance could be reduced.

The thesis is based on case studies of four drilling rigs, operating in two different mines. The
results reveal both similarities and difference between the studied mines. Further
investigations have been done to find the reason for the poor reliability of the hoses.

A literature study has been carried out, observations have been done in the case studied mine
aswell as analysing the collected data. The data has been processed by using the theories and
methodologies described in the literature.

Based on the results from the observation and data analysis, optimal maintenance interval for
the most critical subsystems has been suggested. Some weakness affecting the reliability of
the hoses has been highlighted to increase the reliability.

The results from this thesis can be used for planning maintenance actions and to get a better
understanding of the failures that occurs in the drilling rig. Since four different drilling rigs
have been analysed, a comparison has been made between the rigs. The results reveal that
there is both similarities and differences between the rigs.

Keyword: Drilling rig; Mining industry; Optimum maintenance interval; Reliability analysis;
Maintenance strategy; Underground mining rig; Mining Management; Maintenance
engineering.

 ii
Sammanfattning

SAMMANFATTNING

Inom gruvindustrin, är borrning en av de viktigaste processerna. Borrningen är processen för
att göra hål i väggar och stuff för de underjordiska schakten och rummen. När hålen är
borrade kommer de att fyllas med sprängämnen och sprängas (Al-Chalabi, 2014).

Borrningen utförs i en krävande miljö och är utsatt för haverier i dess olika delsystem.
Orsaken till haverier är inte bara miljön, även manövreringen av borriggarna och underhållet
har en stor inverkan på borriggar tillförlitlighet (Al-Chalabi, 2014).

Syftet med detta examensarbete är att ta fram en optimala underhållsintervall för kritiska
delsystem. Kunskapen och föreslagna optimala underhållsintervall kan användas för att
optimera underhållsschemat och förhindra oplanerade underhållsåtgärder.

Det har i denna uppsats visat sig att upp till 78 % av de underhållsåtgärder som utförs är
avhjälpande underhållsåtgärder (Al-Chalabi, 2014).

Examensarbetet bygger på fallstudier av fyra borriggar, verksamma i två olika gruvor.
Resultaten visar både likheter och skillnader mellan de studerade gruvorna. Ytterligare
undersökningar har gjorts för att hitta orsaken till den dåliga tillförlitligheten hos slangar.

En litteraturstudie har genomförts och fallstudierna har studerats genom observationer och
analys av insamlad data. Data har bearbetats med hjälp av den teori och de metoder som
beskrivs i litteraturen.
Baserat på resultaten från observation och data analyser, så har ett optimalt underhållsintervall
för de mest kritiska delsystem föreslagits. Brister som påverkar tillförlitligheten hos slangarna
har lyfts fram för att öka till att belysa problematik och öka tillförlitligheten i delsystemet.

Resultaten från examensarbetet kan användas för planering av underhållsåtgärder samt få en
bättre förståelse av de fel som uppstår i borriggen. Då fyra olika borrmaskiner har analyserats
har en jämförelse gjorts mellan riggarna. Resultaten visar att det finns både likheter och
olikheter mellan de olika riggarna.

Nyckelord: Borrning rigg; Gruvindustri; Optimal underhållsintervall; Tillförlitlighet analys;
Underhållsstrategi; Underjordsbrytning rigg.

 iii
Contents

CONTENTS

Acknowledgement .................................................................................................................................. i
Abstract .................................................................................................................................................. ii
Sammanfattning ................................................................................................................................... iii
Contents................................................................................................................................................. iv
List of Figures ....................................................................................................................................... vi
List of Tables........................................................................................................................................ vii
List of Pictures .................................................................................................................................... viii
Abbreviation ......................................................................................................................................... ix
1. Introduction .................................................................................................................................. 1
 1.1 Statement of the problem........................................................................................................ 2
 1.2 Objectives............................................................................................................................... 2
 1.3 Significance of the study ........................................................................................................ 2
 1.4 Delimitations .......................................................................................................................... 2
2. Methodology .................................................................................................................................. 3
 2.1 Research background............................................................................................................. 3
 2.1 Research Approach ................................................................................................................ 4
 2.2 The Reliability analyse method .............................................................................................. 4
 2.3 Time between Failure and Time to Failure............................................................................ 5
 2.4 The Bathtub Curve ................................................................................................................. 5
 2.5 Pareto principle ..................................................................................................................... 6
 2.6 Reliability Analysis ................................................................................................................ 6
 2.7 Independent and Identical distributed data ........................................................................... 6
 2.8 Reliability distributions .......................................................................................................... 7
 2.8.1 Exponential Distributions .................................................................................................. 7
 2.8.2 Weibull 2-Parameter distribution ...................................................................................... 8
 2.8.3 Log-normal distribution ..................................................................................................... 8
 2.8.4 Nonhomogeneous Poisson Process and Power Law process model. ................................. 8
 2.8.5 Best-fit distribution and reliability calculation .................................................................. 9
3. Literature review ........................................................................................................................ 10
 3.1 Definitions in Maintenance & Reliability Engineering ....................................................... 10
 3.2 Underground drilling rigs.................................................................................................... 10
 3.3 Factors Impacting the Reliability in Mining ........................................................................ 11
 3.4 Reliability-based maintenance ............................................................................................. 12
 3.5 Maintenance in the mining industry..................................................................................... 12
 3.6 Maintenance types and strategies ........................................................................................ 12
4. Result ........................................................................................................................................... 13
 4.1 Case studied mines ............................................................................................................... 13
 4.1.1 Mining and Operations observations ............................................................................... 13
 4.1.2 Workshop and services .................................................................................................... 17
 4.1.3 Mining environment ........................................................................................................ 18
 4.1.4 Available failure data....................................................................................................... 20
 4.1.5 Operation times of the drilling rigs .................................................................................. 21
 4.1.6 Preventive- vs. Corrective maintenance .......................................................................... 22
 4.1.7 Results from analytical analyses ...................................................................................... 23
 4.1.8 Optimal Maintenance procedure...................................................................................... 25

 iv
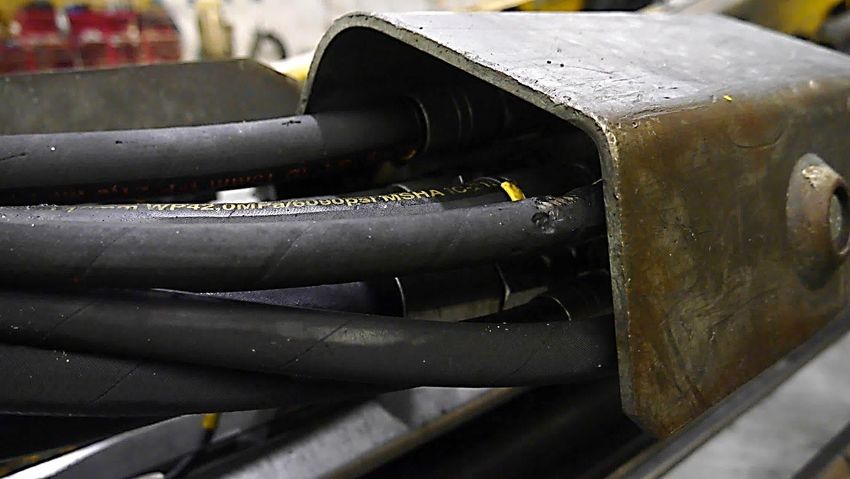
Contents

 4.1.9 Reliability goals and MTTF............................................................................................. 26
 4.1.10 Survival Probability..................................................................................................... 27
 4.1.11 Causes of hose failure ................................................................................................. 32
 4.2 Comparison of the mines...................................................................................................... 37
 4.2.1 Mean time to failure for all machines .............................................................................. 39
 4.2.2 Optimal maintenance hours ............................................................................................. 40
 4.2.3 Reliability after one shift and after one week .................................................................. 42
 4.3 Suggested optimal maintenance plan for the drilling rigs ................................................... 43
 4.4 Suggested Inspection and Service Intervals for the subsystems ..................................... 46
5. Discussion, Conclusion and Further studies............................................................................. 47
 5.1 Discussion ............................................................................................................................ 47
 5.2 Conclusion ........................................................................................................................... 49
 5.3 Further studies ..................................................................................................................... 49
6. Refences ....................................................................................................................................... 50
Appendix .............................................................................................................................................. 52

 v
List of Figures

LIST OF FIGURES
Figure 1.1. The direct costs of mining ....................................................................................... 1
Figure 2.1. Drill and blast cycle ................................................................................................. 3
Figure 2.2. Method for calculating reliability and maintainability drilling ............................... 4
Figure 2.3. Difference between TBF, TTR and TTF ................................................................. 5
Figure 2.4. The bathtub curve .................................................................................................... 6
Figure 2.5. i(th) TBF against (i-1)th TBF scatter plot ................................................................ 7
Figure 3.1. The drilling machine and its subsystems ............................................................... 10
Figure 3.2. Factors impacting reliability in mining drilling ..................................................... 11
Figure 4.1. Preventive vs. corrective maintenance ................................................................... 22
Figure 4.2. The occurrence of subsystem failures in drilling rig A1........................................ 23
Figure 4.3. The occurrence of subsystem failures in drilling rig A2........................................ 23
Figure 4.4. The occurrence of subsystem failures in drilling rig B1 ........................................ 24
Figure 4.5. The occurrence of subsystem failures in drilling rig B2 ........................................ 24
Figure 4.6. All failures for all rigs ............................................................................................ 25
Figure 4.7. Serial correlation tests ............................................................................................ 26
Figure 4.8. Survival functions for the hoses in the different mines ......................................... 28
Figure 4.9. Survival functions for the Steering system in the different mines ......................... 28
Figure 4.10. Survival functions for the boom in the different mines ....................................... 29
Figure 4.11. Survival functions for the feeder in the different mines ...................................... 29
Figure 4.12.Survival functions for the rock drill in the different mines .................................. 29
Figure 4.13. Total failures in mine A ....................................................................................... 37
Figure 4.14. Total failures in mine B ....................................................................................... 37
Figure 4.15. Total failures both mines ..................................................................................... 38
Figure 4.16. Amount of CM Vs PM maintenance ................................................................... 38
Figure 4.17. Recorded failures during 2015 ............................................................................. 39
Figure 4.18. Mean time to failure all machines ........................................................................ 40
Figure 4.19. 75% Reliability reached after operation hours..................................................... 40
Figure 4.20. 80% Reliability reached after operation hours..................................................... 41
Figure 4.21. 90% Reliability reached after operation hours..................................................... 42

 vi
List of Tables

LIST OF TABLES
Table 3.1. Subsystems in drilling machines ............................................................................. 11
Table 4.1 Mines and machines codename ................................................................................ 13
Table 4.2. Number of failures recorded in the drilling rigs ...................................................... 20
Table 4.3. The amount of years of data available for the rigs. ................................................. 20
Table 4.4. Usage of the machines and its efficient functioning time ....................................... 20
Table 4.5. Number of failures analysed for each rig ............................................................... 21
Table 4.6. Average operation hours of the drilling rigs ........................................................... 22
Table 4.7. Trend test, distribution and estimated parameters. .................................................. 25
Table 4.8. Reliability goals and MTTF .................................................................................... 27
Table 4.9. Survival probability A1 ........................................................................................... 30
Table 4.10. Survival probability A2 ......................................................................................... 30
Table 4.11. Survival probability B1 ......................................................................................... 31
Table 4.12. Survival probability B2 ......................................................................................... 31
Table 4.13.Comparison of MTTF for all machines ................................................................. 39
Table 4.14. 75% Reliability occurrence time ........................................................................... 41
Table 4.15. 80% Reliability occurrence time ........................................................................... 41
Table 4.16. 90% Reliability occurrence time ........................................................................... 42
Table 4.17. Reliability after approximately one working shift ................................................ 42
Table 4.18. Reliability after approximately one working week ............................................... 43
Table 4.19. Maintenance plans for A1 ..................................................................................... 44
Table 4.20. Maintenance plans for A2 ..................................................................................... 44
Table 4.21. Maintenance plans for B1 ..................................................................................... 45
Table 4.22. Maintenance plans for B2 ..................................................................................... 45

 vii
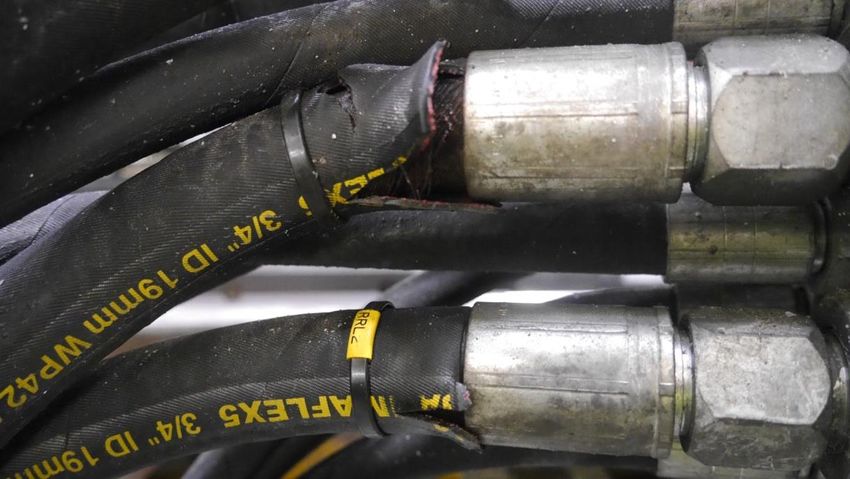
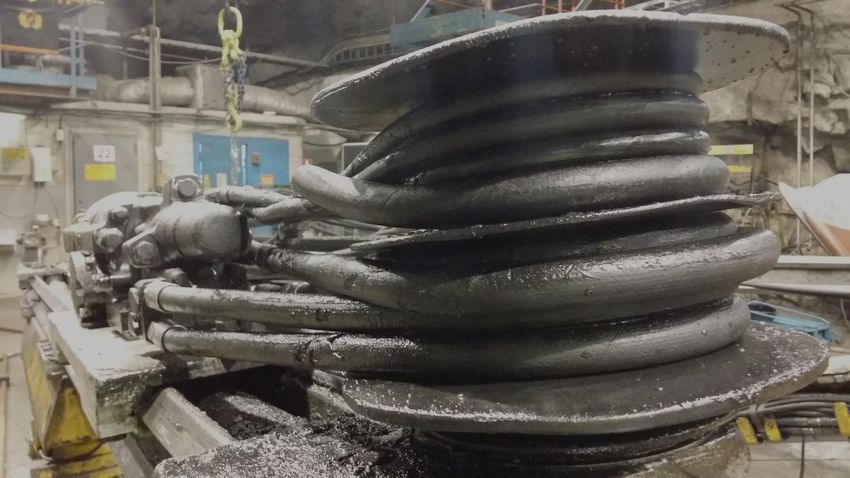
List of Pictures

LIST OF PICTURES
Picture 4.1. Drilling operation in mine A ................................................................................. 14
Picture 4.2. Two booms in a position where the two booms almost collide ............................ 14
Picture 4.3. The view from the operator’s perspective ............................................................ 15
Picture 4.4. Placement of the boom during drilling ................................................................. 15
Picture 4.5. Critical boom position during drilling .................................................................. 16
Picture 4.6. One of the drilling rigs in mine A ......................................................................... 16
Picture 4.7. The wash station in mine A .................................................................................. 17
Picture 4.8. The workshop in mine B ....................................................................................... 17
Picture 4.9. The face of the mine before drilling...................................................................... 18
Picture 4.10. The drilling rig in position with the lights focusing on the face ......................... 18
Picture 4.11. Placement of the boom during drilling ............................................................... 19
Picture 4.12. A broken hose and hydraulic oil leakage during drilling operation .................... 19
Picture 4.13. Hoses grinding at each other and the hose collector ........................................... 32
Picture 4.14. Hoses grinding at each other and the hose collector, another angel ................... 32
Picture 4.15. Worn out hoses and hose that has jumped off the hose reel ............................... 33
Picture 4.16. New hose wheel to the left and old one to the right ............................................ 33
Picture 4.17. Hoses wearing out while grinding to the hose protection cover ......................... 34
Picture 4.18. The bulkhead and the bulkhead protection cover ............................................... 34
Picture 4.19. Stretched hose that is flexing .............................................................................. 35
Picture 4.20. Hoses that has failed right next to the coupling .................................................. 35
Picture 4.21. The hose wheel at one of the rigs in mine B ....................................................... 36
Picture 4.22. The "hose wheel" at one of the rigs in mine B, from another view .................... 36

 viii
Abbreviation

ABBREVIATION

MTTF - Mean Time to Failure
PM - Preventive Maintenance
CM - Corrective Maintenance
CMMS - Computerised Maintenance Management Software
TTF - Time to Failure
MTBF - Mean Time between Failures
TTR - Time to Repair
NHPP - Nonhomogeneous Poisson Process

 ix
Introduction

Chapter 1

1. INTRODUCTION
In the mining industry, two types of mining methods are often used, the surface mining
technique and the underground mining techniques (Hartman & Mutmansky, 2002). In this
thesis, the focus will be on the underground mining technique and the machines used in the
process for drilling.

The drilling rig is one of the key machines during mining production and a possible
bottleneck and is, therefore, important to investigate.

Earlier research has discovered that when analysing the data of unplanned breakdowns of
mobile machines for one year, 15% of the breakdowns were related to the drilling rigs (Al-
Chalabi, 2014). The article pointed out that the reason for these breakdowns is caused mainly
because of poor reliability of the subsystem. One reason for the poor reliability is because the
drilling rigs are operating in a harsh and demanding environment.

The maintenance costs in the mining industry have been revealed to be almost 30-50% of the
direct costs in the mining process (Lewis & Luiz, 2001); this makes the maintenance costs
one of the greatest controllable costs of the extraction. One way to control these costs is by
implementing optimised preventive maintenance for critical subsystems with a high risk of
failing. When implemented, this will decrease the number of breakdowns and the costs of
corrective maintenance and unplanned production interruption.

The different costs for the mine operation are depicted in Figure 1.1.

If it is detected or known when a subsystem is worn-out, it is possible to schedule preventive
maintenance for the subsystem, minimising the risk of a breakdown interrupting the
production- and workshop schedule.

 Figure 1.1. The direct costs of mining (Kumar, 2009)

 1
Introduction 1.1 Statement of the problem This thesis will handle the objectives of mobile mining drilling rigs and the reliability of the existing fleet in the case studied mines. An investigation is done to analyse the most critical subsystems in the mobile drilling rigs and suggests optimal maintenance intervals for preventing breakdowns. 1.2 Objectives Name the most critical subsystems in the mobile drilling rigs regarding reliability and the downtime of the machines. Suggest an optimised reliability-based maintenance plan to prevent unplanned downtime because of breakdowns. Compare results from the case studied mines and analyse variance in the critical subsystems. 1.3 Significance of the study This study is performed to suggest an optimal maintenance schedule, based on the data given from the specific mobile drilling rigs. The optimal maintenance plan will help the company to reduce the risk of unplanned maintenance actions and keep the reliability of the machine at a high level. The optimised maintenance plan will help the company to decide where to spend the maintenance budget, to archive as high reliability of the machine as possible. 1.4 Delimitations This research is limited to the underground mobile drilling machine in the two case mines studied. This research is also restricted to calculate only the most critical subsystems regarding minimising the downtime of the drilling rigs. The data in this thesis is analysed by selecting any of the following distributions; NHPP, Gamma, Weibull 2P, Exponential, Lognormal and Log-logistic distribution. 2
Methodology

Chapter 2

 2. METHODOLOGY
 2.1 Research background
As for any industry, the mining companies have the main purpose of earning more money
than they spend to make a profit.

One of the greatest costs of the mining operation is the maintenance cost (Kumar, 2009). A
poorly performed maintenance strategy can lead to expensive repairs and interruption in the
production because of unplanned maintenance stoppage, interruptions that might lead to
delays in the productions and possible economic loss.

The procedure of extracting rock consists of steps in the drill and blast cycle as showed in
Figure 3.1. Unscheduled stoppage of any machines in the drill and blast cycle is necessary to
avoid, in order maintaining a smooth mining operation, with a high production rate (Al-
Chalabi et al., 2014).

In comparison with other heavy industries, the working conditions and environment in the
mines is considered harsh. The harsh environment is one reason why mining machines
experience problems of the reliability and performance (S. H. Hoseinie, 2016).

In earlier research of mobile underground drilling machines, results are presented those in
particular three subsystems that are more critical to failure. The most critical subsystems were
discovered to be the hoses, rock drills and feeders. (S. H. Hoseinie, 2016). The hoses, rock
drills and feeders are all subsystems that are in contact with the rock during the drilling
operation.

Figure 2.1. Drill and blast cycle (Sjödin, 2015)

 3
Methodology

 2.1 Research Approach
The data from this thesis has been collected from Maximo; that is a computerised
maintenance management software. When the data had been collected, it was sorted and
cleaned. The cleaning of the data was done by erasing empty maintenance posts and remove
duplicate posts.

The data from Maximo included data regarding what subsystem that had failed, at what date it
had failed and the repair time. By knowing this, it was possible to calculate the mean time
between failures (MTBF).

When categorising the data, the division of subsystem that had been used in the earlier
research was used.

After the data had been collected, cleaned and categories, it was used for making the
reliability analysis. The reliability analysis was done to find the MTBF and to specify an
optimum maintenance/service interval for the analysed subsystems.

Further investigations were then done to find the reason why the hoses are failing and to
investigate if there are any weak points subject for improvement.

 2.2 The Reliability analyse method
When calculating the reliability, the approach described in Figure 2.2 has been used. In the
following subchapters, the steps will be described.

When all steps have been made, it is possible to calculate the reliability of the subsystems and
an optimum maintenance and service schedule.

Figure 2.2. Method for calculating reliability and maintainability drilling (Ascher and Feingold, 1984)

 4
Methodology

 2.3 Time between Failure and Time to Failure
In reliability engineering, the following definition is necessary time intervals that are needed
when analysing the reliability. An illustration of the definition is seen in Figure 2.3.

Time to failure (TTF) is the time from when the failure has been managed and fixed until it
fails again. Time to Repair is the time used for restoring the failure.

 Figure 2.3. Difference between TBF, TTR and TTF(Forket, 2011)

 2.4 The Bathtub Curve
A way to understand the various failures that occur in the drilling rig during its lifetime, it is
possible is to use the bathtub curve.

The bathtub curve is divided into three regions as showed Figure 2.4. The sections depend on
of the ageing of the machine. The first stage of the curve is considered when the machine is
new. During this period, reasons for failures can, for instance, be human error, poor quality
control, poor manufacturing methods and poor material and workmanship of the machine and
its components (Dhillon, 2008).

The second period of the machine life is the useful-life period. During this time, the failure
frequency remains stable and constant. The failures that are occurring during this period are
usually undetectable failures, natural failure, abuse and human errors (Dhillon, 2008).

The third and last period of the machine's life is the wear-out period. During this time, the
failure frequency increases. The reasons are typical because of wearing that has occurred from
poor maintenance, wear from friction, age caused wear, corrosion and creep in the machine's
components (Dhillon, 2008).

 5
Methodology

 Figure 2.4. The bathtub curve (Dhillon, 2008)

 2.5 Pareto principle
The Pareto principle is used to find the failures that are most frequently failing. Results from
the Pareto calculation are then used to highlight the most common failures. The idea of the
Pareto principle is based on the notion that 80% of the failures are caused by 20% of the
subsystem.
The distribution does not have to be exactly 80/20, but it is assumed that a few failures will
cause the majority of the breakdowns in the machine (Newman, 2005).

 2.6 Reliability Analysis
The reliability function is defining the probability of failure as a function of time and is
mathematically defined in Equation (1).

 ( ) = 1 − ( ) = 1 − ∫ ( ) (1)
 0

 2.7 Independent and Identical distributed data
To be able to use the classic reliability analysis methods, the independent and identical
distribution (IID) criterion has to be fulfilled. If the data is assumed to be IID, distributions
such as the Weibull-, Exponential and Lognormal distribution might be use. (Garmabaki et
al., 2016).

To know if the data is IID, a trend- and correlation test has to be done. There are various trend
tests can be utilised. However, in this thesis, the Laplace trend test will be utilised. The trend
test is done with a signification of α=0, 05. From the normal standard table this signification
gives that the critical value for U is -1.96 < U < 1.96.

The Laplace test is Done by calculating if the null hypothesis is rejected or accepted. If the
test is rejected the data may follow an NHPP distribution. (Garmabaki et al., 2016). If the

 6
Methodology calculated value (U) is the critical interval value, in this case 1,96, the null hypothesis is not rejected, and the data is assumed to be trend free. The Laplace equation is defined by Equation (2) ∑ =1 −2 = (2) 1 √12 If the data is found to have a trend, a nonhomogeneous poison process has to be approached. When testing the data for serial correlation, the method suggested by Uday Kumar is used. The solution is a graphical solution where the i(th) TBF against the (i-1)th TBF is scattered plot. An example of the correlation plot is illustrated in Figure 2.5 (Kumar, Klefsjö and Granholm, 1989). 160 140 120 100 (i)th TBF 80 60 40 20 0 0,00 50,00 100,00 150,00 200,00 (i-1)th TBF Figure 2.5. i(th) TBF against (i-1)th TBF scatter plot If a serial correlation is found in the data, a homogeneous poison process has to be used for calculating reliability. 2.8 Reliability distributions 2.8.1 Exponential Distributions The exponential 1-parameter distribution is defined by Equation (3) ( ) = − (3) The exponential 2-parameter distribution is defined by Equation (4) ( ) = − ( − ) (4) MTTF for exponential distributions is defined by Equation (5) ∞ ∞ ̅ = ∫ ∙ ( ) = ∫ ∙ ∙ − (5) 7
Methodology

 2.8.2 Weibull 2-Parameter distribution

The Weibull 2-parameter distribution is defined by Equation (6)

 −1 −( )

 ( ) = ( ) (6)

When < 1 the failure rate is decreasing
When > 1 the failure rate is increasing
When = 0 the failure rate is constant
(The Weibull Distribution, u.d.)

The MTTF for Weibull 2P distribution is defined by Equation (7)

 1
 ̅ = ∙ ( + 1) (7)

 2.8.3 Log-normal distribution

The 2-parameter distributions are defined by Equation (8)

 1( ´− ´) 2
 1
 ( ´) = ´√2 −2 ´ (8)

The MTTF for log-normal 2P distribution is defined by Equation (9)
 1
 = − ´+2 ´2 (9)

 2.8.4 Nonhomogeneous Poisson Process and Power Law process model.
When the data has been analysed with the Laplace trend test and a trend has been found.
NHPP models such as the Power Law process have to be used to calculate the reliability. The
model is used to calculate the failure occurrence ( ), by using equation (10)

 −1
 ( ) = ( ) (10)

Where and are scale and shape parameters.

When < 1 the failure intensity is decreasing
When > 1 the failure intensity is increasing
When = 0 the failure intensity is constant and becomes a homogeneous poison process
(Hoseinie, Ataei, Khalokakaie, Kumar, & Ghodrati, 2012)

The parameters are estimated by Equation (11) and (12)

 8
Methodology

 = (11)
 ∑ −1
 =1 ln( )

 = (12)
 1 /

The probability distribution function and reliability function is defined by Equation (13) and
(14):

 ( ) = ( ) −1 exp(−( ) ) (13)

 ( ) = exp(−( ) (14)

 2.8.5 Best-fit distribution and reliability calculation
When deciding the distribution, the Easy Fit software has been used to rank the goodness of
the distributions. Furthermore, the best fit distribution has been used for further calculations.
The ranking has been made using the Kolmogorov-Smirnov test (K-S test).

When the data has been analysed, and the best-fit distribution has been decided, the data has
then been calculated with the chosen best-fit distribution.

 9
Literature review

Chapter 3

 3. LITERATURE REVIEW
 3.1 Definitions in Maintenance & Reliability Engineering
Corrective Maintenance
“Maintenance carried out after fault recognition and intended to put an item into a state in
which it can perform a required function” (SS-EN 13306:2010).

Preventive Maintenance
“Maintenance carried out at predetermined intervals or according to prescribed criteria and
intended to reduce the probability of failure or the degradation of the functioning of an item”
(SS-EN 13306:2010).

Computer-managed maintenance systems
Computerised maintenance management systems are used for managing and control
equipment maintenance. It can be used for making maintenance decisions as well decide the
requirements for different maintenance tasks. A CMMS can also include asset register,
accounting of assets and schedule preening maintenance routines. (Plant-maintenance.com,
2016).

 3.2 Underground drilling rigs
Underground drilling rigs are one of the most important machines in both the mining industry
and in the civil tunnel industry. There are about ten companies worldwide that are
manufacturing drilling rigs. The drilling rigs have a similar structure and subsystem, even if
the technical characteristics differ between different manufacturers and models (Al-Chalabi,
2014).

A typical drilling rig subsystem is presented in Figure 3.1. The described subsystems are used
in this thesis to categories the machine's subsystem. The structure and classification of the
subsystem were originally categories in Hussan Hamodis Doctoral thesis (Al-Chalabi, 2014).

Figure 3.1. The drilling machine and its subsystems (Al-Chalabi H. L., 2014)

 10
Literature review

An overview of the subsystems that are used in this thesis is presented in Table 3.1.

Table 3.1. Subsystems in drilling machines

 No Subsystems
 A Hoses
 B Boom
 C Steering system
 D Rock drill
 E Cables
 F Cabin
 G Feeder
 H Hydraulics
 I Valves
 J Accumulators
 K Cylinders
 L Electrical system
 M Water Cooler

 3.3 Factors Impacting the Reliability in Mining
The mining operation is taking place in harsh environments, which is demanding both for the
machines and the operator.

One of the most critical factors is the geology (Dhillon, 2008). Geology can differ a lot
between different mines and at various locations in the mines. Meaning that two separate
drilling rigs in the same mine can experience different geological conditions and strength of
the rock, even when operating in the same mine.

Another aspect of the geology is that loose rock can be occurring more often in different
geological conditions. Falling rock is a problem that can damage the machines subsystem.

Figure 3.2. Factors impacting reliability in mining drilling (Dhillon, 2008)

 11
Literature review

 3.4 Reliability-based maintenance
A lot has happened during the last decades in the maintenance industry; earlier the
maintenance strategy was to repair the item after a failure occurred, a corrective maintenance
strategy. Today a preventive maintenance strategy is more commonly used and has the
purpose of preventing failure in the machines (Tsang, 2006).

When using a preventive maintenance schedule, it is important to benchmark the results. If
the maintenance actions are carried out too frequently, this will cause unnecessarily increased
maintenance cost. There is also risk that maintenance staff will not replace component since
they are not considered to be worn out. The benchmarking will make it possible to overview
the effect of maintenance decision made (Tsang, 2006).

 3.5 Maintenance in the mining industry
In the mining sector, a suggestion has been made that reliability and availability analyses
should be required already in the design phase (Dandotiya, 2012). This because the mining
sector is depending on its heavy machines and downtime due to breakdowns will decrease the
production. The mining operation has developed from a physical workplace with manual
labours, into an industry operated by mechanised and automated systems (Kumar, 2009).

Another aspect of the maintenance activities is the safety. Studies have shown that over 25%
of the accidents that occurred in underground coal mining are related or occurring during
maintenance activities. An optimised maintenance plan, therefore, means it is possible to
optimise one of the most significant accidents reasons (Dhillon, 2008).

 3.6 Maintenance types and strategies
Two types of maintenance approaches are commonly used. The preventive maintenance (PM)
approach and the corrective maintenance (CM) approach.

The preventive maintenance approach has the purpose of maintaining the asset before failure
has occurred. By implementing a PM strategy, interruption during production can be
decreased, since the maintenance actions can be handled and scheduled when the machine is
not in use.

The corrective maintenance approach means that the subsystem will be replaced when they
have failed without knowing when and where the failure will occur.

When a reliability engineering program has been implemented, it is possible to predict the
lifetime of the products and be able to prepare replacement and repairs in advance. A
reliability engineering program will be a good ground to suggest a guideline for quality
control and maintenance actions for the machines (ReliaSoft, 2015).

 12
Result

Chapter 4

 4. RESULT
 4.1 Case studied mines
Two underground mines in North Sweden have been the objectives of this research. The
mines are located near each other, but the excavation methods and the excavation conditions
differ between the two mines.

In the two mines, four mobile drilling rigs have been investigated; two drilling rigs in each
mine. All drilling rigs are the same machine model from the same manufacturer. Only the age
of the drilling machines differs. In this research, the abbreviation used for the mines and
machines is explained in Table 4.1.

Table 4.1 Mines and machines codename

 Mine Machine Description
 A Case study mine number 1
 st
 A1 1 Drilling rig investigated in case mine A
 A2 2nd Drilling rig investigated in case mine A
 B Case study mine number 2
 st
 B1 1 Drilling rig investigated in case mine B
 B2 2nd Drilling rig investigated in case mine B

 4.1.1 Mining and Operations observations

The observation from case mine A indicated that the operator had safe space for manoeuvring
the booms. During the observed drilling processes, the operator had what was considered as
safe space for manoeuvre the booms. In Picture 4.1 drilling operation is showed for a face
drilling operation.

The picture is showing home the left boom is drilling while the right boom is operating
vertically below the left boom. The consequence is that water and small stone grains will fall
to the lower boom. If the face would be considered unstable, a risk of stone blocks falling to
the boom operating in the lower part of the face would also be seen as a risk.

 13
Result

Picture 4.1. Drilling operation in mine A (Henrik Thunberg, 2016)

In Picture 4.2 it is clearly that the operator is manoeuvring the booms very close to each other.
Seen from a risk perspective, the risk of collisions of the boom will increase when the booms
are operating close to each other. During the drilling presented in Picture 4.2, there was no
need to drill the holes next to each other at the same time. Meaning that the operator decided
the way the booms were operating.

Picture 4.2. Two booms in a position where the two booms almost collide (Henrik Thunberg, 2016)

 14
Result

Another unfavourable manoeuvring of the booms was observed while drilling the cut. In the
situation showed in Picture 4.3. One can see that the booms once more are operating in a
close distance between each other. There is a possibility that the boom might collide while
manoeuvring the booms into the positions, as seen in Picture 4.3.

Picture 4.3. The view from the operator’s perspective(Henrik Thunberg, 2016)

In mine B, the operator sometimes had to operate the booms in demanding angles, with a
limited option on how to manoeuvre the booms. In Picture 4.4 an example of this is presented
where the bottom holes of the contour are drilled. In this position, there is an increased risk of
scratching the boom and its components. The boom is operating just a few centimetres from
the shaft floor.

Picture 4.4. Placement of the boom during drilling(Henrik Thunberg, 2016)

 15
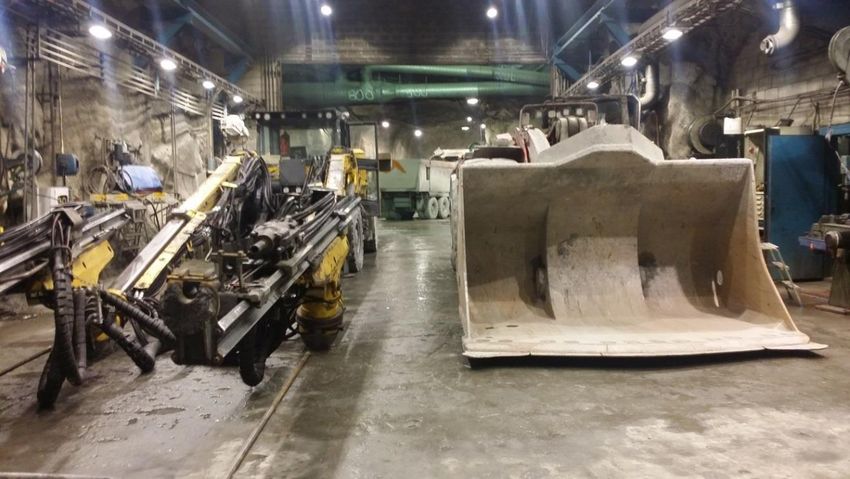
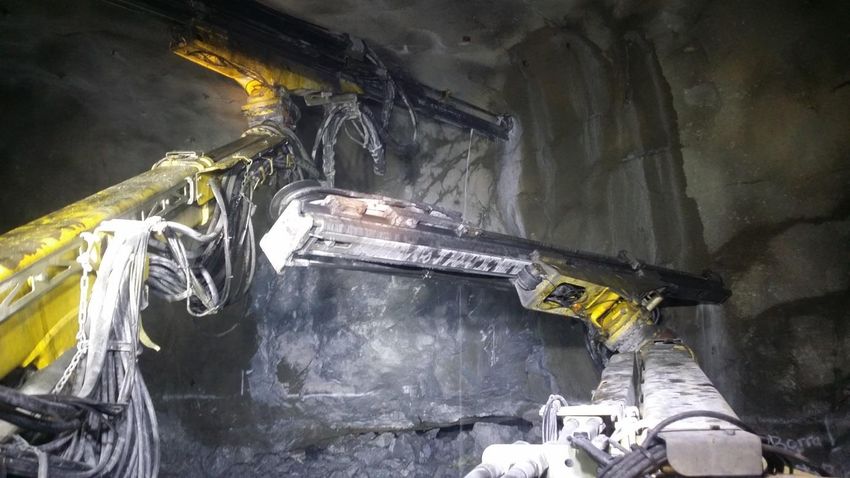
Result

In Picture 4.5 the operator had to turn the boom around and operate the boom in an upside
down position, to being able to drill the hole with the correct inclination. In this situation the
operator both have to operate the boom in a demanding position and with a limited view.

Picture 4.5. Critical boom position during drilling(Henrik Thunberg, 2016)

An overview Picture of the operation is presented in Picture 4.6. Because of the mining
excavation, the drilling rig has to be setup in a sometimes demanding position. The picture
also reveals which components which are in contact with the rock during the excavation and
which that should be considered as protected during the drilling operation.

Picture 4.6. One of the drilling rigs in mine A (Henrik Thunberg, 2016)

 16
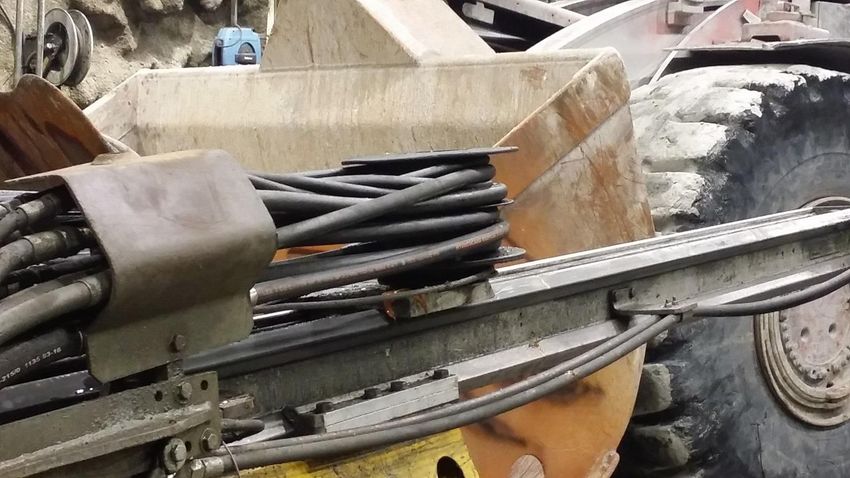
Result

 4.1.2 Workshop and services
Both studied mines have well-developed workshops and washing stations. It is possible for
the operators and maintenance staff to bring the machines into the washing plant, where fat
and oil removing liquids can be used, to wash the machine and keep the machine clean. In
Picture 4.7 the wash station in mine A is showed. The station is well developed, and it is easy
for the operator to perform a satisfying washing performance.

The picture is taken during one of the washing activates that is carried out before the rig is
handled into the workshop.

Picture 4.7. The wash station in mine A (Henrik Thunberg, 2016)

In Picture 4.8 the underground workshop is showed for mine B. The underground workshops
in both mines are well developed with good space for the maintenance staff to work in a safe
and flexible way.

Picture 4.8. The workshop in mine B (Henrik Thunberg, 2016

 17
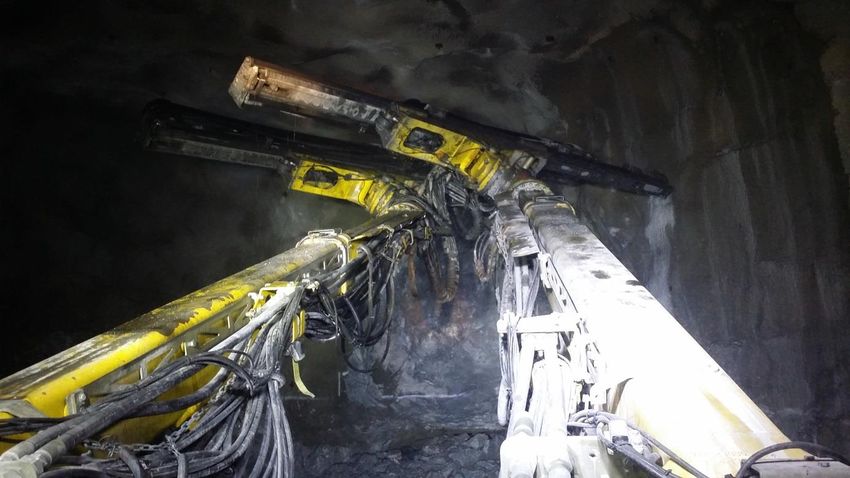
Result

 4.1.3 Mining environment
When the drilling process starts, it is likely that rocks and stones are left on the shaft floor.
Stones that is hard for the Load-Haul-Dump machines (LHD) to remove. A situation like this
is seen in Picture 4.9.The consequence of a poorly cleared floor can lead to increased scratch
on the moving subsystems, such as the boom and the rock drill. Therefore, a proper cleaning
of the floor is needed before the drilling starts.

Picture 4.9. The face of the mine before drilling (Henrik Thunberg, 2016)

Another factor affecting the operation is the darkness and narrow spaces. As seen in Picture
4.10, the operator has a limit sight on the surrounding environment and is particularly
depending on the machine's light, to be able to operate the machine in a safe way.

Picture 4.10. The drilling rig in position with the lights focusing on the face (Henrik Thunberg, 2016)

 18
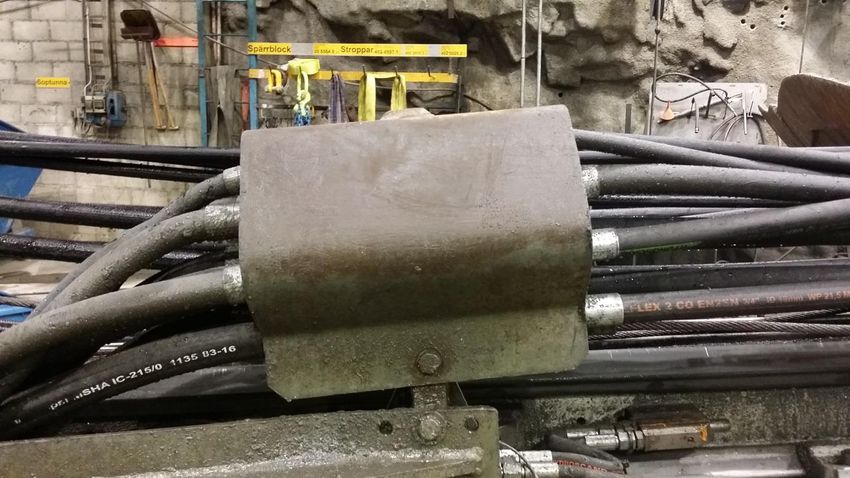
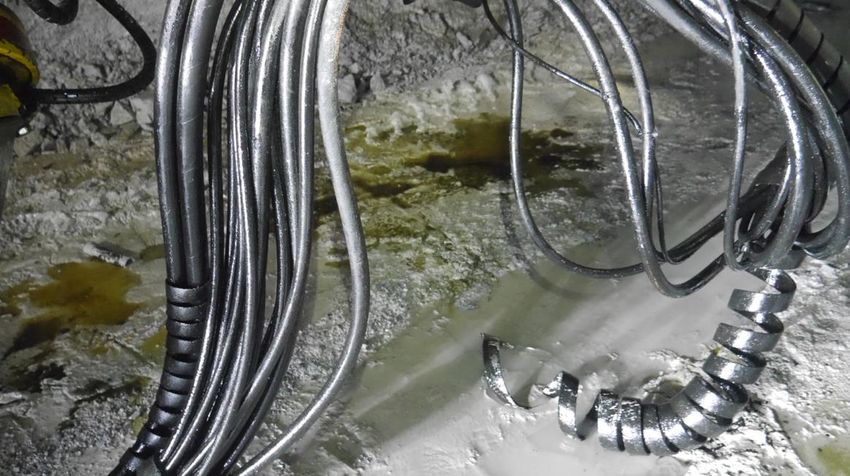
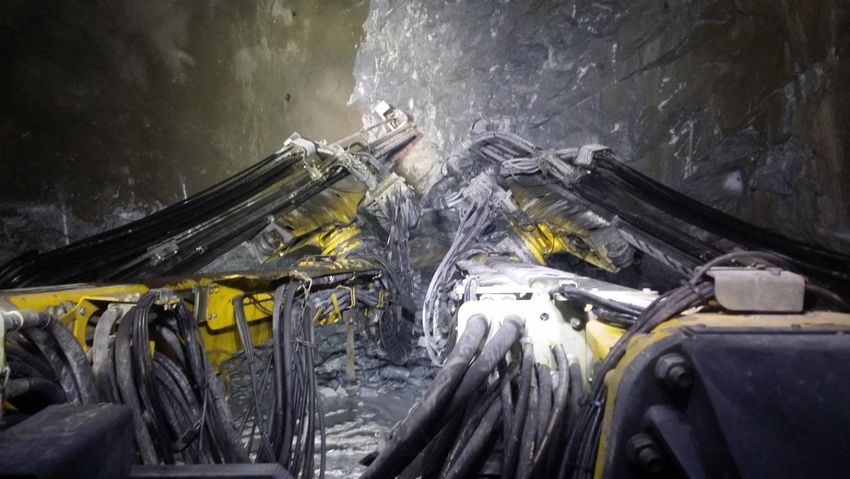
Result

The drilling rig sometimes has to operate with the boom in difficult angles near the shaft floor
when drilling the bottom holes. In Picture 4.11 a situation is showed, where the operator is
operating the machine at an angle very near to the floor. With a high risk of scratch, in
particular, the boom, rock drill and hoses.

Picture 4.11. Placement of the boom during drilling (Henrik Thunberg, 2016)

In Figure 3.2, factors impacting the reliability of the mining machine directly or indirectly are
presented.

In Picture 4.12, a breakdown of one of the hoses has occurred during the drilling. The failure
has taken place at one of the hoses that are subject for scratching the shaft floor. The
consequence is the replacement of the broken hose, refilling of hydraulic oil and handling of
the spillage caused by the leaking hose.

Picture 4.12. A broken hose and hydraulic oil leakage during drilling operation (Henrik Thunberg, 2016)

 19
Result

 4.1.4 Available failure data

Number of failures recorded
When the collected data had been analysed, it contained a total of 1464 failure posts divided
over four drilling rigs. The specific amount of failure post for each of the drilling rigs is
presented in Table 4.2.

Table 4.2. Number of failures recorded in the drilling rigs

 Drilling rig Number of failures
 A1 91
 A2 123
 B1 785
 B2 465

The available data used, has been collected between one and half year up to six years for the
different machine. The specific available data time for each of the investigated drilling rigs is
presented in Table 4.3.

Table 4.3. The amount of years of data available for the rigs.

 Drilling rig Available data (years)
 A1 1.5
 A2 1.5
 B1 6
 B2 5

When the defining the age of the drilling rig, the operation time for different components has
been collected and presented in Table 4.4. The value for the Electrical motor in drilling rig B2
is not realistic and should be discharged.

The B2 rig is the rig with both most Percussion and diesel engine hours. One can also see that
rig A1, A2 and B2 has similar percussion and electrical motor operation times. However, the
diesel engine time is also double as high for B1 than for A1 and A2.

Table 4.4. Usage of the machines and its efficient functioning time

 Measurement A1 A2 B1 B2
 Percussion (h) 3 116 2 721 2 398 5 019
 Electrical motor (h) 4 728 5 184 5 058 10 755
 Diesel engine (h) 1470 1779 3520 5573

Categorization of data and Pareto calculations
When the data has been corrected, it has then been categorised into different subsystems.
These subsystems will be further analysed by using the Pareto analysis. The classification of
the data into subsystems is presented in Table 4.5.

 20
Result

When the Pareto calculations have been done, the most frequently failing subsystems will be
further analysed.

Table 4.5. Number of failures analysed for each rig

 Number of Failures
 Subsystem A1 A2 B1 B2
 Accumulators 3 0 18 9
 Boom 14 10 18 35
 Cabin 5 8 49 34
 Cables 7 8 33 18
 Cylinders 0 5 18 6
 Electrical system 1 3 31 25
 Feeder 3 17 89 48
 Hoses 26 40 272 141
 Hydraulics 4 8 8 10
 Rock drill 12 9 110 70
 Steering system 15 15 100 54
 Valves 0 0 19 8
 Water Cooler 1 0 20 7

 4.1.5 Operation times of the drilling rigs

The efficient functioning hours for the different subsystems in the drilling rigs has been
analysed, and categories and is presented in Table 4.6 are calculated as an average usage time
per day.

Each of the measured components is used for different operations when operating the rig. The
diesel engines, for example, are used when the whole drilling rig is moving.
The Electrical motors are used to manoeuvre the boom and during the entire drilling
procedure.

Percussion time is the time for the actual drilling. When using the operation time for the
calculation, the highest value has been chosen between electrical motor 1 and 2. When
choosing between percussion right and left the same principle has been used.

The values presented in Table 4.6 shows that a diesel engine has similar operation time got a
similar average operation time for the diesel engines in all the mines. When comparing the
Electrical motor, the average operation time is also similar. The biggest difference between
the mines is the operation time for the Percussion that is almost double as high in A2 than for
the rest of the drilling rigs.

 21
Result

Table 4.6. Average operation hours of the drilling rigs
 Drilling rig
Component A1 A2 B1 B2 Function
Diesel Engine 0,87 1,16 1,13 1,15 Movement
Electrical Motor 1 2,56 3,31 2,96 3,14 Drilling ready, system up
Electrical Motor 2 3,24 3,24 2,9 3,09 Drilling ready, system up
Percussion Right 1,33 3,62 1,18 1,43 Actual drilling
Percussion Left 0,11 2,24 1,19 1,4 Actual drilling

 4.1.6 Preventive- vs. Corrective maintenance

The comparison between the number of preventive- and corrective maintenance actions for
the drilling rigs is showed in Figure 4.1.
One can see that a greater amount of corrective maintenance is reported then preventive
maintenance actions.

In the drilling rigs in mine A, a higher number of preventive maintenance actions has been
performed. In drilling rig A1, the number of recorded preventive maintenance actions stands
for 40% of the maintenance. While in drilling rigs B1, the preventive maintenance stands for
22% of the registered maintenance actions.

 PM VS CM -A1 PM vs CM -A2
 PM
 PM 32%
 40%

 CM
 60% CM
 68%

 PM VS CM -B1 PM VS CM -B2
 PM PM
 22% 25%

 CM CM
 78% 75%

Figure 4.1. Preventive vs. corrective maintenance for all available data analysed. In A1 and A2 data from 1,5
years has been analysed and in B1 and B2 data from 6 years has been analysed.

 22
Result

 4.1.7 Results from analytical analyses

Pareto calculation
The Pareto calculation shows that five subsystems are more frequently breaking down. The
results for drilling rig A1 and A2 is showed in Figure 4.2 and Figure 4.3. The subsystem with
highest defect frequency is similar for both drilling rigs in mine A. It is found that four
subsystems in A1 are causing 80% of the failures while six subsystems are causing 80% of
the failures.

In drilling rig A1, the most failing subsystems are the hoses, steering system, boom, rock drill
and cabin.

 A1
 30 100

 CUMULATIV PERCENTAGE
 DEFECT FREQUENCY

 25
 75
 20
 15 50
 10
 25
 5
 0 0

Figure 4.2. The occurrence of subsystem failures in drilling rig A1

In drilling rig A1, the most failing subsystems are the hoses, feeder, steering system, boom
and rock drill

 A2
 45 100
 DEFECT FREQUENCY

 CUMULATIV PERCENTAGE

 40
 35 75
 30
 25 50
 20
 15
 10 25
 5
 0 0

Figure 4.3. The occurrence of subsystem failures in drilling rig A2

In mine B, similar subsystems as those in mine A is subject to failures. In both B1 and B2,
five subsystems are causing approximately 80% of the failures. In all four drilling rigs, hoses
are the subsystem causing most failures. The results are seen in Figure 4.4 and Figure 4.5.

 23
Result

In drilling rig B1 the most failing subsystems are the hoses, rock drill, steering system, feeder,
and the cabin.

 B1
 300 100
 FAILURE FREQUENCY

 CUMULATIV PERCENTAGE
 250
 75
 200
 150 50
 100
 25
 50
 0 0

Figure 4.4. The occurrence of subsystem failures in drilling rig B1

In drilling rig B2 the most failing subsystems are the hoses, rock drill, steering system, feeder,
and the boom.

 B2
 160 100

 CUMULATIV PERCENTAGE
 FAILURE FREQUENCY

 140
 120 75
 100
 80 50
 60
 40 25
 20
 0 0

Figure 4.5. The occurrence of subsystem failures in drilling rig B2

When compiling all the failures the five most critical subsystems has been decided to be the
hoses, rock drill, steering system, feeder and boom. This since the boom is a more frequently
failing subsystem in 3 of 4 subsystems. The results for the compiled failures are presented in
Figure 4.6.

 24
Result

 All recorded failures
 600 100,0

 Cumulativ percentage
 Failure Frequency

 500
 75,0
 400
 300 50,0
 200
 25,0
 100
 0 0,0

Figure 4.6. All failures for all rigs

 4.1.8 Optimal Maintenance procedure
When the information of interest was collected, reliability analyses were carried out. The
feeder subsystem in drilling rig A1 was discharged from the calculation because of too few
maintenance entries, making the calculation unreliable.

The results showed that three subsystems showed a trend and had to be further analysed with
an NHPP distribution. All results are presented in Table 4.7.
The process of analysing the data, the trend test and NHPP distribution is described in the
methodology chapter.
Table 4.7. Trend test, distribution and estimated parameters.

 Machine Subsystem U-value Trend Distribution Estimated parameters
 Boom -1,66 No Gamma µ=4,80 K=0,75
 Feeder x x x x
 A1 Hoses -1,15 No Weibull 2P α=0,99 β=49,76
 Rock drill -0,17 No Gamma µ=3,63 K=1,21
 Steering system -0,7 No Lognormal σ=4,25 µ=1,0
 Boom 0,48 No Lognormal σ=4,40 µ=1,02
 Feeder 1,03 No Weibull 2P α=79,7 β=1,04
 A2 Hoses 2,93 Yes NHPP β=0,47 λ=1,35
 Rock drill 1,49 No Gamma µ=4,74 K=1,19
 Steering system 1,78 No Log logistic µ=4,21 σ=0,63
 Boom 1,03 No Lognormal σ=4,18 µ=1,2
 Feeder -1,77 No Lognormal σ=3,93 µ=1,09
 B1 Hoses -1,93 No Weibull 2P α=31,51 β=1,28
 Rock drill -2,25 Yes NHPP β= 0,79 λ=0,18
 Steering system -1,9 No Weibull 2P α=1,11 β=108,57
 Boom 0,96 No Log logistic µ=4,48 σ=0,62
 Feeder -1,68 No Lognormal σ=4,16 µ=0,97
 B2 Hoses -1,71 No Weibull 2P α=50,14 β=0,81
 Rock drill -0,85 No Exponential 2P λ=34,95 γ=2,56
 Steering system -3,5 Yes NHPP β=0,63 λ=0,18

 25
You can also read