National Carbon Offset Standard for Events - Carbon Neutral Program Pre-Event Public Disclosure Summary - Department of the Environment and ...
←
→
Page content transcription
If your browser does not render page correctly, please read the page content below
National Carbon Offset
Standard for Events
Carbon Neutral Program

Pre-Event Public Disclosure Summary
Responsible entity name
City of Melbourne

Events
Melbourne Fashion Week (31 August to 7 September 2018)
Melbourne Music week (16 to 24 November 2018)

Event Type
Large Event Portfolio

Declaration
To the best of my knowledge, the information provided in the Public Disclosure Summery is true and correct
and meets the requirements of the National Carbon Offset Standard for Events.

Angela Hann
Events Branch Manager
City of Melbourne

Australian Government
Department of Environment and Energy
Public Disclosure Summary documents are prepared by the submitting organisation. The material in the
Public Disclosure Summary documents represents the views of the organisation and does not necessarily
reflect the views of the Commonwealth. The Commonwealth does not guarantee the accuracy of the
contents of the Public Disclosure Summary documents and disclaims liability for any loss arising from the
use of the document for any purpose.
Contents
Glossary........................................................................................................................................................... 5
1     Introduction ............................................................................................................................................ 6
2     Melbourne Fashion Week ..................................................................................................................... 9
      2.1 Introduction ................................................................................................................................. 9
              2.1.1           Melbourne Fashion Week............................................................................................ 9
      2.2 Pre-event Emissions Assessment Approach .............................................................................. 9
              2.2.1           Approach ..................................................................................................................... 9
              2.2.2           Assumptions and limitations ...................................................................................... 10
              2.2.3           Sensitivity analysis .................................................................................................... 10
      2.3 Melbourne Fashion Week Emissions Scope ............................................................................ 11
              2.3.1           Materiality assessment .............................................................................................. 11
              2.3.2           Emissions inventory scope ........................................................................................ 13
              2.3.3           Data Collection .......................................................................................................... 15
      2.4 Melbourne Fashion Week 2018 emissions inventory ............................................................... 15
              2.4.1           Out of scope emissions profile .................................................................................. 15
              2.4.2           Carbon emissions profile ........................................................................................... 15
              2.4.3           Offsets summary ....................................................................................................... 17
              2.4.4           Energy ....................................................................................................................... 17
              2.4.5           Transport ................................................................................................................... 18
              2.4.6           Catering ..................................................................................................................... 19
              2.4.7           Waste......................................................................................................................... 20
              2.4.8           Construction............................................................................................................... 21
      2.5 Melbourne Fashion Week recommendations to reduce emissions .......................................... 21
              2.5.1           Potential emissions reduction initiatives .................................................................... 21
              2.5.2           Recommendations ..................................................................................................... 24
      2.6 Conclusion ................................................................................................................................ 24
3     Melbourne Music Week ....................................................................................................................... 25
      3.1 Introduction ............................................................................................................................... 25
              3.1.1           Melbourne Music Week ............................................................................................. 25
      3.2 Pre-event Carbon Assessment Approach ................................................................................ 25
              3.2.1           Approach ................................................................................................................... 25
              3.2.2           Assumptions and limitations ...................................................................................... 26
              3.2.3           Sensitivity analysis .................................................................................................... 26
      3.3 Melbourne Music Week Emissions Scope ................................................................................ 27
              3.3.1           Materiality assessment .............................................................................................. 27
              3.3.2           Emissions inventory scope ........................................................................................ 29
              3.3.3           Data collection ........................................................................................................... 31
      3.4 Melbourne Music Week 2018 Emissions Inventory .................................................................. 31
              3.4.1           Out of scope emissions profile .................................................................................. 31
              3.4.2           Carbon emissions profile ........................................................................................... 31
              3.4.3           Offsets summary ....................................................................................................... 36
              3.4.4           Energy ....................................................................................................................... 36
              3.4.5           Transport ................................................................................................................... 39
              3.4.6           Catering ..................................................................................................................... 40
              3.4.7           Waste......................................................................................................................... 40
              3.4.8           Construction............................................................................................................... 42
      3.5 Melbourne Music Week Recommendations to Reduce Emissions .......................................... 42
              3.5.1           Potential emissions reduction activities ..................................................................... 42
              3.5.2           Additional recommendations ..................................................................................... 46
      3.6 Conclusion ................................................................................................................................ 46
Appendix A        Materiality assessment and certification boundary................................................................ 47
Appendix B Emission factors .................................................................................................................... 50
Appendix C Reduction actions .................................................................................................................. 55
Appendix D Materiality assessment and certification boundary................................................................ 57
Appendix E Emission factors and summary ............................................................................................. 60
Appendix F Improved practice initiatives .................................................................................................. 64
List of tables
Table 1: Aggregated emissions summary ................................................................................................... 6
Table 2: Sensitive emissions ..................................................................................................................... 11
Table 3: Emissions inventory ..................................................................................................................... 13
Table 4: Predicted ground transport emissions ......................................................................................... 18
Table 5: Potential reductions and actions.................................................................................................. 22
Table 6: Sensitive emissions ..................................................................................................................... 27
Table 7: Emissions sources for Melbourne Music Week........................................................................... 29
Table 8: Predicted Melbourne Music Week patron transport - trips, kilometres travelled and
emissions by mode ...................................................................................................................... 39
Table 9: Anticipated waste generation at Melbourne Music Week 2018 .................................................. 41
Table 10: Potential emissions reductions by emission source .................................................................... 43
Table 11: Emissions factors used to calculate Melbourne Fashion Week emissions profile ...................... 50
Table 12: Melbourne Fashion Week 2018 emissions summary of the pre-event carbon account report ... 53
Table 13: Improved practice initiatives ........................................................................................................ 55
Table 14: Emissions factors used to calculate Melbourne Music Week emissions profile ......................... 60
Table 15: Melbourne Music Week 2018 Emissions summary of the pre-event carbon account report ...... 63
Table 16: Action reduction initiatives ........................................................................................................... 64
List of figures
Figure 1: City of Melbourne, Melbourne Fashion Week – Carbon Footprint Scope ................................... 12
Figure 2: Total emissions profile for Melbourne Fashion Week ................................................................. 15
Figure 3: Anticipated proportion of emissions by source type at Melbourne Fashion Week 2018............. 16
Figure 4: Energy breakdown from source................................................................................................... 17
Figure 5: Breakdown of predicted catering emissions ................................................................................ 19
Figure 6: Emissions associated with food and beverages.......................................................................... 20
Figure 7: Waste breakdown ........................................................................................................................ 21
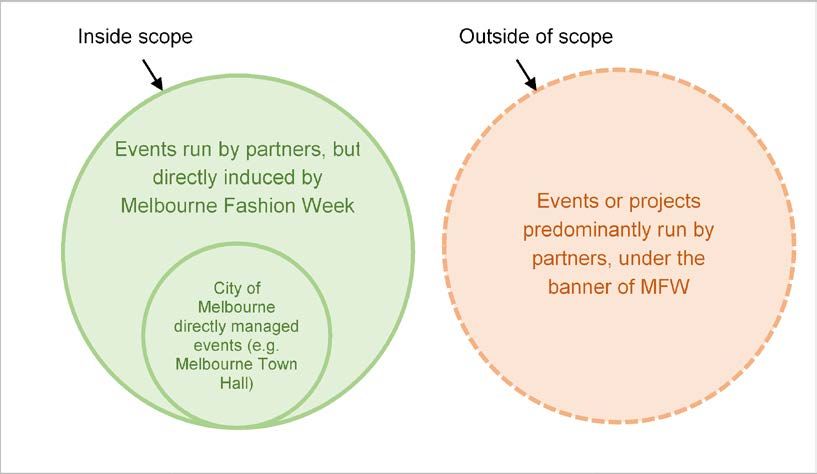
Figure 8: City of Melbourne, Melbourne Music Week – Carbon Footprint Scope ...................................... 28
Figure 9: Total emissions profile for Melbourne Music Week 2018 ............................................................ 31
Figure 10: Anticipated emissions by source type at Melbourne Music Week 2018 ..................................... 32
Figure 11: Total Melbourne Music Week emissions, breakdown by venue ................................................. 33
Figure 12: Total emissions and emissions per attendee by venue (total emissions shown as bars with
values on the left, emissions per attendee shown as dots with values on the right)................... 34
Figure 13: Predicted Melbourne Music Week 2018 Hub emissions ............................................................. 35
Figure 14: Melbourne Music Week 2018 Partner venue emissions ............................................................. 36
Figure 15: Total energy consumption and energy consumption per attendee by venue (total energy
shown as bars with values on the left, energy per attendee shown as dots with values on
the right)....................................................................................................................................... 37
Figure 16: Predicted energy use sources for the Hub for Melbourne Music Week 2018 ............................. 38
Figure 17: Predicted energy use sources for partner venues for Melbourne Music Week 2018 ................. 38
Figure 18: Emissions by food type and drink ................................................................................................ 40
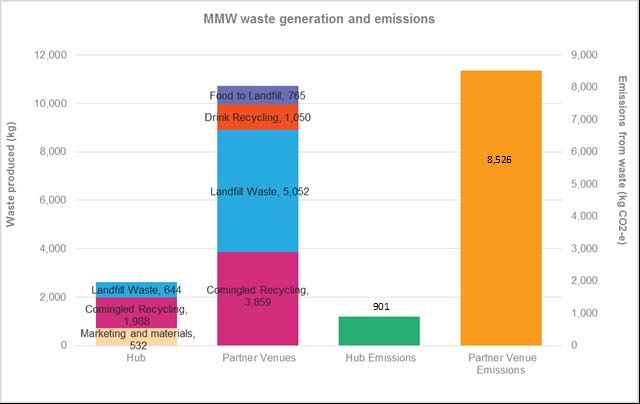
Figure 19: Comparison of projected emissions and waste disposal by venue type (left – waste
produced, right – emissions from waste) ..................................................................................... 41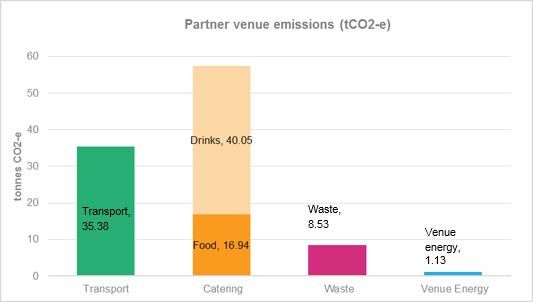
Glossary

Term                       Definition
Biofuel                    Energy derived from renewable plant and animal materials. Examples include
                           biodiesel (often based on vegetable oils), ethanol (often made of corn or
                           sugarcane) and biogas (often the product of organic waste degradation).

Carbon dioxide             A standard measure that takes account of the global warming potential of different
equivalence (CO2-e)        greenhouse gases and expresses the effect in terms of carbon dioxide impact.
                           Measured in kilograms (kgCO2-e) and tonnes (tCO2-e).

Carbon inventory           An account of the greenhouse gas emissions that are attributable to an entity or
                           event.
Carbon offsets             Represents reductions or removals of greenhouse gases from the atmosphere,
                           relative to a business-as-usual baseline. Carbon offsets are tradeable and often
                           used to negate (or offset) all or part of another entity’s emissions.

Direct GHG emissions       Emissions from sources that are owned or controlled by an organisation.

Embodied emissions         Emissions that are generated over the entire product lifecycle – including
                           production, use and end-of-life.

Energy audit               A process for documenting the energy consumed by a building or organisation and
                           evaluating where energy consumption can be reduced.

GreenPower                 Renewable energy certified under a joint initiative of the ACT, NSW, SA, VIC and
                           TAS governments GreenPower program. Visit Green Power website. 1

Indirect GHG emissions Emissions that are a consequence of an organisation’s activities, but the
                       emissions sources are not owned or controlled by the organisation.

ISO 20121                  ISO 20121: Event Sustainability Management Systems is the international
                           standard that sets out requirements for sustainable event management.

Materiality                The importance or significance of an impact source impact within the inventory.
Renewable Energy           Certificates created by power stations or small-scale installations that generate
Certificates               electricity from renewable sources. Each certificate represents one megawatt hour
                           of renewable energy generation.

Scope 1 emissions          The release of greenhouse gas into the atmosphere as a direct result of an
                           organisation’s activities.

Scope 2 emissions          The release of greenhouse gas as a result of electricity generation, heating,
                           cooling or steam that is consumed by an organisation.

Scope 3 emissions          Greenhouse gases emitted as a consequence of an organisation’s activities but by
                           another organisation (e.g. embodied energy in materials, flights).

Sustainable Event          Incorporating sustainability into the planning and implementation of events.
Management (SEM)

1    https://greenpower.gov.au/About-Us/
1 Introduction City of Melbourne has a vision for Melbourne as a bold, inspirational and sustainable city. Melbourne is well known for its annual Premier Events such as Moomba, Melbourne Music Week, Melbourne Fashion Week and New Year’s Eve. Together, these events attract thousands of patrons and visitors from interstate and overseas. City of Melbourne’s Zero Net Emissions Strategy sets an ambitious target to achieve zero net emissions for the city. In line with this strategy, City of Melbourne has been certified Carbon Neutral for Council operations under the National Carbon Offset Standard, and will continue to operate as a carbon neutral organisation. To support this strategy, City of Melbourne has released an Emissions Reduction Plan for our Operations 2016- 2021. As part of our Emissions Reduction Plan we are working to reduce the emissions from our events. In 2018, we commenced a pilot project to certify a portfolio of our premier events Carbon Neutral under the Australian Government’s National Carbon Offset Standard. To obtain certification, City of Melbourne engaged ARUP to assist establish a pre-event greenhouse gas emissions profile for two events in our Premier Events portfolio: • Melbourne Fashion Week 31 August to 7 September 2018 • Melbourne Music Week 16 to 24 November 2018. Our aggregated event portfolio is predicted to have total emissions of 993 tonnes CO2-e, as outlined in Table 1. Table 1: Aggregated emissions summary Scope Emissions source kg CO2-e 1 Generators 9,413.00 1 Gas 381.08 2 Electricity 19,694.15 3 Water 26.01 3 Landfill waste 25,231.17 3 Comingled 0 3 Drink recycling 0 3 Food to landfill 4,621.11 3 Food to compost 0 3 Non-alcoholic 34,485.64 3 Beer 134,042.12 3 Wine & spirits 29,061.87 3 Tea & coffee 6,914.97 3 Meal - with red meat 103,961.46 3 Meal - other 17,539.89 3 Dessert 987.07
Scope            Emissions source                                                                        kg CO2-e
3                Domestic flights                                                                        95,241.65
3                International flights                                                                   69,775.74
3                Train                                                                                   55,715.57
3                Tram                                                                                    99,719.43
3                Bus                                                                                     23,583.12
3                Car/Taxi/Uber                                                                          105,076.54
3                Bicycle                                                                                           0
3                Walk                                                                                              0
3                Skateboard                                                                                        0
3                Guest Accommodation                                                                         8,700.00
3                Marketing and publications                                                                  1,647.56
3                New construction materials                                                                  5,237.52
1                Generators used during/ for construction                                                          0
3                Out of scope emissions                                                                 141,679.00
N/A              Total gross emissions                                                                  993,011.00
N/A              GreenPower or retired LGCs                                                                        0
N/A              Total net emissions                                                                    993,011.00

Greenhouse gas emissions considered include carbon dioxide (CO2), methane (CH4), nitrous oxide (N20),
hydrofluorocarbons (HFCs), perfluorocarbons (PFCs), sulphur hexafluoride (SF6) and nitrogen trifluoride
(NF3).

Eligible offsets purchased include:

•   250 tonnes of Australian Carbon Credit Units (ACCU) from a savannah burning project in Western
    Australia ‘cancelled on behalf of City of Melbourne - Melbourne Fashion Week (31 August –
    7 September 2018) for its carbon neutral claim against the National Carbon Offset Standard’
    Clean Energy Regulator 2.
    Registry: Australian National Registry of Emission Units.
    Serial range: 3,758,601,279 – 3,758,601,528.
    Emission Reduction Fund Project: EOP 100641.
    Account holder: Tasman Environmental Markets Pty Ltd.

•   400 tonnes of Verified Carbon Units (VCUs) from a wind farm in China were ‘cancelled on behalf of City
    of Melbourne - Melbourne Fashion Week (31 August – 7 September 2018) for its carbon neutral claim
    against the National Carbon Offset Standard’ The APX VCS Registry 3.
    Registry: The APX VCS Registry.
    VCU serial numbers: 4185-177872387-177872786-VCU-009-APX-CN-1-1056-01032012-31082012-0.
    Originating carbon offset project: CECIC Zhangbei Gaojialiang Wind farm Project.
    Project type: Energy industries (renewable/non-renewable sources).
    Account holder: First Climate.
•   344 tonnes of Australian Carbon Credit Units (ACCU) from a savannah burning project in Western
    Australia were ‘cancelled on behalf of City of Melbourne - Melbourne Music Week (16 – 24 November

2     http://www.cleanenergyregulator.gov.au/OSR/ANREU/The-Australian-national-registry-of-emissions-units
3     https://vcsregistry2.apx.com/myModule/rpt/myrpt.asp
2018) for its carbon neutral claim against the National Carbon Offset Standard’ Clean Energy
Regulator 4.
Registry: Australian National Registry of Emission Units.
Serial range: 3,758,601,529 – 3,758,601,872.
Emission Reduction Fund Project: EOP 100641.
Account holder: Tasman Environmental Markets Pty Ltd.
Details on each individual event are provided below.
A post-event report will be provided at the conclusion of the events, following independent assurance.
4 http://www.cleanenergyregulator.gov.au/OSR/ANREU/The-Australian-national-registry-of-emissions-units2 Melbourne Fashion Week
2.1 Introduction
Arup was engaged by the City of Melbourne to develop a pre-event greenhouse gas emissions profile for
Melbourne Fashion Week 2018. The pre-event profile will be utilised to offset the events emissions prior to
the actual event later in the year. This report documents the process of predicting emissions and includes
recommendations to reduce emissions in key focus areas.
2.1.1 Melbourne Fashion Week
Melbourne Fashion Week is unique event celebrating consumer fashion. The week-long event is one of the
largest fashion events in Australia with up to 69,000 attendees in 2017. Held annually for over twenty years,
the event aims to showcase emerging and established brands, designers and models.
Hosting more than 8,000 events, festivals and exhibitions each year, the City of Melbourne recognises the
importance of sustainable events. Managing these events with a focus on sustainability has multi-
dimensional benefits ranging from the community to City of Melbourne’s strategic vision. As a large event,
Melbourne Fashion Week is an opportunity to showcase City of Melbourne’s dedication to sustainability. In
2018, Melbourne Fashion Week is projected to have 74,000 attendees including guests and staff. Large
events like Melbourne Fashion Week are resource-intensive by nature and therefore have several
opportunities to reduce emissions.
Sustainable events in recent years have become more important to organisers and attendees alike
especially with the first International Standard for Event Sustainability Management Systems (ISO 20121),
developed in 2012. The pre-event emissions profile for Melbourne Fashion Week 2018 has been developed
based on the National Carbon Offset Standards (NCOS) for Events for pre-event reporting. Predictive event
emissions were based on actual collected data from Melbourne Music Week 2015 (Melbourne Music Week
2015).
This pre-event profile includes:
• Projected greenhouse gas emissions from the event
• Identification of included and material emissions including the scope of boundary for emissions
• Recognition of sensitive emissions that can vary pre-event and during the event
• Recommendations for reducing event emissions
2.2 Pre-event Emissions Assessment Approach
2.2.1 Approach
The methodology for the pre-event emissions assessment of Melbourne Fashion Week 2018 is described
below, based on five key stages.
• Stage 1. Define emissions scope.
Arup facilitated a materiality workshop with City of Melbourne to discuss and determine the scope of the
footprint to be included in the assessment. The footprint scope that was decided upon is further detailed
in Section 2.3.
• Stage 2. Calculate 2018 emissions inventory.Arup developed a tool for assessing venue sustainability and emissions in Microsoft Excel and populated
with current emissions factors.
Using this tool, Arup created a footprint of Melbourne Fashion Week based on Melbourne Music Week
2015 to understand where the largest sources of emissions would come from before the actual event.
Results of the emissions inventory are presented in Section 2.4.
• Stage 3. Research best practice actions.
Alongside the emissions inventory calculations, Arup undertook research into best practice actions of
sustainable events management. A summary of actions to reduce emissions are presented in
Appendix C.1.
• Stage 4. Develop best practice emissions inventory.
Combining the best practice research and predicted emissions inventory resulted in the creation of a
best practice emissions inventory. This details how Melbourne Fashion Week can decrease emissions
and improve sustainability in the future.
Based on an understanding of the largest emissions sources, initiatives that could be applied to
Melbourne Fashion Week were prioritised and quantified.
• Stage 5. Recommend priority actions.
Based on the best practice inventory and research undertaken, Arup have made recommendations of
potential sustainability actions for future Melbourne Fashion Week events. These recommendations align
with the broader City of Melbourne sustainability goals, and consideration is given as to how they could
be implemented.
2.2.2 Assumptions and limitations
Data used for the pre-event carbon assessment was based on a combination of consultation with City of
Melbourne event organisers and actual emissions calculated for Melbourne Music Week in 2015. The
following assumptions were made:
• Melbourne Fashion Week has seen a growth in attendee numbers year on year by an average of 4-5%.
We assumed this growth would continue and conservatively allowed for a 7% growth to 74,000
attendees
• Relevant emissions factors have been updated for 2018
• That ground transport, catering, waste and construction profiles would be similar to that of other large
events like Melbourne Music Week (where actual data exists), allowing for emissions be calculated
proportionately
• Flight transportation estimated based on discussions with City of Melbourne event organisers
• Not all the events at Melbourne Fashion Week will be included in the emissions profile. Section 2.3.1
outlines the materiality assessment for which events were in and out of scope, primarily driven by the
ability for City of Melbourne to influence the outcomes. For the events that were outside of the scope of
the detailed analysis, additional emissions calculated based on an estimate of the scale of excluded
events, using a per person emissions average. Details of these emissions are outlined in Section 2.4.1 .
2.2.3 Sensitivity analysis
Sensitive emissions are the emissions that are subject to change between the pre-event carbon analysis and
during the event. These emissions sources can variably change depending on factors such as attendees or
location of the events. For Melbourne Fashion Week 2018, the identified sensitive emissions are catering,
waste and transport. As part of the pre-event emissions profile, these sensitive emissions must be
considered and compensated with an uplift factor. These uplift factors are way to account for extra emissionsresulting in a conservative approach to the total pre-event emissions. Table 2 below documents the sensitive
emissions, their impact and the conservative approach to quantifying them.
Table 2: Sensitive emissions
Emissions Source Effect of variation on carbon account Conservative approach for sensitive
emissions
Catering Catering represents 40% of the total A 7% increase in the emissions
predicted emissions for Melbourne associated with food and beverages has
Fashion Week 2018. An increase in been factored into the calculating for the
attendees will likely lead to an increase in report.
the emissions from catering.
Waste Waste is projected to be a small A 7% increase in waste emissions has
proportion of the total waste generation been factored into the calculations for
at 4%. It is expected that an increase in this report.
attendees will also lead to more waste
being generated from food and other
sources.
Transport Transport is predicted to be the largest Transport is divided into two categories,
source of emissions for Melbourne ground and air travel. A 7% increase in
Fashion Week 2018 at 53%, which is ground transport emissions has been
dependent upon total attendee numbers factored into the calculations for this
but most significantly on domestic and report. Air travel was estimated based on
international flights by performers or the number of performers or staff
support staff. Transport type will depend travelling directly or partially from the
on event venues, potentially changing the event. We have over-estimated these
transport profile (e.g. distant from public flights selecting the longest flight
transport, encouraging more attendees to distances as reference points for
drive cars) analysis.
2.3 Melbourne Fashion Week Emissions Scope
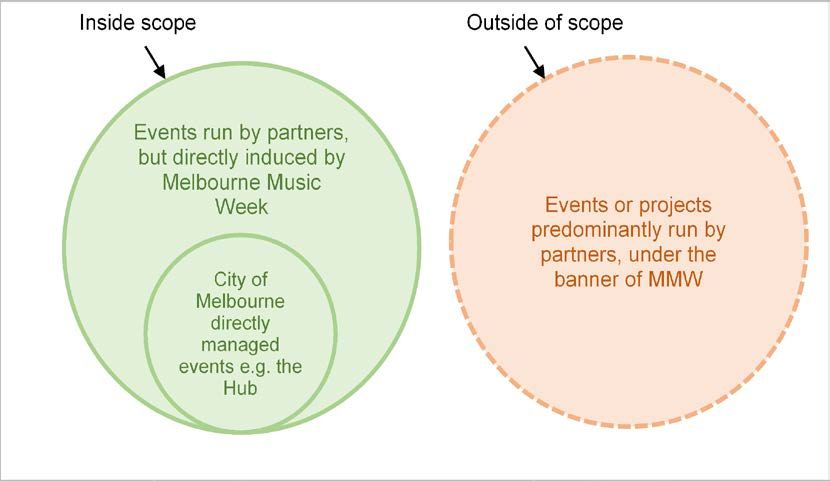
2.3.1 Materiality assessment
The eight-day event occurs across various unique venues that are directly managed by City of Melbourne or
fall under the banner of the program. Comprised of runways, exhibitions and pop-ups these events are
scattered around the city. As events are often complex programs with varied and non-standard activities, an
assessment needs to be undertaken to determine those emissions that are deemed ‘material’ to the event
and therefore should be considered within the scope of the assessment. The following four criteria were
reviewed to determine potential emission sources at the event. The materiality assessment was conducted
with City of Melbourne events staff during a workshop, based on criteria used in the emissions assessments
of previous City of Melbourne events.
1. Does City of Melbourne have high control or influence over emissions source?
To determine the scope and extent of the emissions footprint, City of Melbourne sought to understand the
particular emissions that are directly induced by the event. A structured workshop was run with the City of
Melbourne events team to define the scope of the event in terms of two factors:
• The organisation responsible for managing and programming the event; and
• Whether the event is directly induced as a result of Melbourne Fashion WeekAs a result, Melbourne Fashion Week events can be classified according to the following factors:
1. City of Melbourne directly manages event
2. Run by partner, but directly induced by City of Melbourne, Melbourne Fashion Week
3. Partner directly manages event, under the banner of Melbourne Fashion Week
Events that are classified as either classification 1 or 2, are included within the carbon footprint scope as
represented in Figure 1 below.
Figure 1: City of Melbourne, Melbourne Fashion Week – Carbon Footprint Scope
The rationale for excluding the events directly managed by venues partners from the scope of the
assessment is that those events would have:
• occurred or existed regardless of Melbourne Fashion Week and its program
• been event-managed and undertaken directly by established organisations or producers, with little City
of Melbourne involvement, and
• operated solely as a partner, or under the banner of Melbourne Fashion Week for the reasons of
coincidental timing, and shared focus or objectives.
Consistent with greenhouse gas methodologies, as City of Melbourne have limited operational control of the
above events, these have been excluded from the carbon footprint scope.
2. Is the emission source deemed one of high-risk to City of Melbourne?
Emissions sources are deemed to be high risk if there is a high perceived risk to City of Melbourne’s
reputation as a result of the emissions source (for example, highly visible impact sources such as marketing
materials). Criteria were based on City of Melbourne Moomba and Melbourne Music Week 2015 materiality
assessments.
3. Is the emission source of particular value to the event stakeholders?
High value emissions sources are those that may align with values of particular stakeholders, for example
saving water may be particularly important to some even though the associated emissions are relatively
small. The assessment of each emissions source against this criterion was based on the judgement of the
City of Melbourne event management team for Melbourne Fashion Week.4. Is the combined impact of the emission source significant in quantitative size?
The relative contribution of each emissions source to the overall Melbourne Fashion Week footprint was
based on the inventory of Melbourne Music Week 2015 emissions. The significance of each emissions
source in terms of size was based on this assessment. The preliminary inventory is included in Appendix A,
which also outlines the results of the assessment against the other criteria outlined above.
2.3.2 Emissions inventory scope
The identified sources of emissions for Melbourne Fashion Week are summarised in Table 3 below.
Immaterial emissions sources have been excluded from the scope of the inventory.
Greenhouse gas emissions considered include carbon dioxide (CO2), methane (CH4), nitrous oxide (N20),
hydrofluorocarbons (HFCs), perfluorocarbons (PFCs), sulphur hexafluoride (SF6) and nitrogen trifluoride
(NF3).
Full results of the materiality assessment are in Appendix A.
Table 3: Emissions inventory
1. City of Melbourne directly manages event
Source type Emissions source Included in Scope
scope Category
Venue energy emissions Diesel generators Yes 1
Venue energy emissions Gas usage Yes 1
Venue energy emissions Electricity usage Yes 2
Event indirect emissions Contractor vehicle use No 1
Event indirect emissions Portable toilet usage No 3
Event indirect emissions Food consumed by patrons Yes 3
Event indirect emissions Drink consumed by patrons Yes 3
Event indirect emissions Patron accommodation No 3
Event indirect emissions Patron transport Yes 3
Event indirect emissions Venue waste Yes 3
Event indirect emissions Marketing and publications Yes 3
Event indirect emissions Model/staff accommodation No 3
Event indirect emissions Model/staff flights Yes 3
Event indirect emissions Cleaning services No 3
Event indirect emissions IT services No 3
Event indirect emissions Telecommunication services No 3
Venue construction New construction materials Yes 3
impacts (MTH only)
Venue construction Staging / equipment / lighting hire No 3
impacts (MTH only)
Venue construction Diesel generators used during/for construction Yes 1
impacts (MTH only)Source type Emissions source Included in Scope
scope Category
Venue construction Fuel usage by construction contractors No 1
impacts (MTH only)
Venue construction Construction waste No 3
impacts (MTH only)
Warehouse emissions Warehouse electricity usage No 2
2. Run by partner, but directly induced by Melbourne Fashion Week
Source type Emissions source Included in Scope
scope Category
Venue energy emissions Diesel generators Yes 1
Venue energy emissions Electricity usage Yes 2
Event indirect emissions Food consumed by patrons Yes 3
Event indirect emissions Drink consumed by patrons Yes 3
N/A Patron accommodation No 3
N/A Patron transport Yes 3
N/A Venue waste Yes 3
3. Partner directly manages event, under the banner of Melbourne Fashion Week
No emission sources in scope.
The following sources have been excluded from the emissions boundary:
• Contractor vehicle use
• Portable toilet usage
• Patron accommodation
• Cleaning services
• IT services
• Telecommunication services
• Staging/ equipment/ lighting hire
• Fuel usage by construction contractors
• Construction waste
• Warehouse electricity usage
These emissions sources were deemed immaterial because they represent a small proportion of the total
emissions. The sum of these emissions on the total emissions amounts to an estimated 4.9% of the total
carbon account lower than the 5% maximum as stated in the NCOS standards for events. These were also
excluded because they are largely outside of City of Melbourne’s control.
Additionally, other emissions associated with the event including pre-event planning and preparation,
postage and freight and staff commuting are also excluded from the study. It was determined that City of
Melbourne staff are chiefly responsible for these activities, and therefore these emissions are absorbed in
the organisation’s carbon neutrality certification.2.3.3 Data Collection
Data collection sheets will be provided to all venue operators and partner contractors to collect data relevant
to the events operations. These will include energy use, diesel generators use, fuel consumption, food and
beverage sales, waste disposal and construction materials utilised.
For the transport data, surveys will be taken with a suitable sample of attendees to determine the use of
transport methods to and from the event. To ensure compliance, data collection will be embedded into the
agreement with contractors along with training of venue staff to ensure accuracy of data collection.
2.4 Melbourne Fashion Week 2018 emissions inventory
This section outlines the results of the pre-event emissions inventory analysis from Melbourne Fashion Week
2018. The emissions were analysed for the Melbourne Town Hall and in-scope partner venues.
2.4.1 Out of scope emissions profile
The emissions from events that have were deemed outside the scope of the study were included at a high
level. These events were determined as difficult to control due to third party organisations running the event
independently from City of Melbourne (e.g. independent of support or funding), therefore data collection and
a complete emissions profile would be difficult to acquire.
To ensure Melbourne Fashion Week will be certified as carbon neutral, additional emissions associated with
these events has been calculated to compensate for these events. Through discussions with Melbourne
Fashion Week event organisers, it is predicted that these events would contribute an extra 15% of activities,
equating to an additional 11,100 attendees (based on 74,000 total estimated attendees). Using the total
predicted emissions per attendee of 7.62 kg CO2-e per attendee, the additional emissions for out of scope
events equates to 84.7 tonnes CO2-e for the event.
2.4.2 Carbon emissions profile
Melbourne Fashion Week 2018 is predicted to have a total emission of 649.9 tonnes CO2-e inclusive of out
of scope events. The breakdown of emissions outlined in the rest of the report is based on only in-scope
events. These emissions were estimated from Melbourne Music Week 2015 data and discussions with
Melbourne Fashion Week 2018 organisers.
In-scope emissions is estimated to be 565.16 tonnes CO2-e. This equates to 7.62 kg CO2-e per attendee, or
71 tonnes tonnes CO2-e per day. The breakdown of emissions from sources are shown in Figure 2 and
Figure 3 below. Most of the predicted emissions for the event are from transport (52%) and catering (40%).
Figure 2: Total emissions profile for Melbourne Fashion Week
• Venue energy emissions
Utilities: 13,851 kg CO2-e
generators: 8,213 kg CO2-e
Subtotal - venue energy emissions: 22.06 tonnes CO2-e
• Transport emissions
Flights: 98,952 kg CO2-e
Group Transportation: 192,308 kg CO2-e
Accommodation: 4,640 kg CO2-e
Subtotal – Transport emissions: 295.90 tonnes CO2-e
• Catering emissions
Food: 83,970 kg CO2-e
Drink: 139,073 kg CO2-eSubtotal – Catering emissions: 223.04 tonnes CO2-e
• Waste emissions
Utilities: 21,540 CO2-e
Subtotal – water emissions: 21.54 tonnes CO2-e
• Construction emissions
Materials and activities: 2,619 kg CO2-e
Subtotal - construction emissions: 2.62 tonnes CO2-e
• Total emissions at Melbourne Fashion Week: 565.16 tonnes CO2-e
Figure 3: Anticipated proportion of emissions by source type at Melbourne Fashion Week 2018
Emission tonnes CO2-e %
Venue energy 22.06 3.9%
Transport/Accommodation 295.9 52.4%
Catering 223.04 39.5%
Waste 21.54 3.8%
Construction 2.62 0.5%
Total 565.16 N/A2.4.3 Offsets summary
Eligible offsets purchased include:
• 250 tonnes of Australian Carbon Credit Units (ACCU) from a savannah burning project in Western
Australia ‘cancelled on behalf of City of Melbourne - Melbourne Fashion Week (31 August –
7 September 2018) for its carbon neutral claim against the National Carbon Offset Standard’
Clean Energy Regulator 5.
Registry: Australian National Registry of Emission Units.
Serial range: 3,758,601,279 – 3,758,601,528.
Emission Reduction Fund Project: EOP 100641.
Account holder: Tasman Environmental Markets Pty Ltd.
• 400 tonnes of Verified Carbon Units (VCUs) from a wind farm in China were ‘cancelled on behalf of City
of Melbourne - Melbourne Fashion Week (31 August – 7 September 2018) for its carbon neutral claim
against the National Carbon Offset Standard’ The APX VCS Registry 6
Registry: The APX VCS Registry.
VCU serial numbers: 4185-177872387-177872786-VCU-009-APX-CN-1-1056-01032012-31082012-0.
Originating carbon offset project: CECIC Zhangbei Gaojialiang Wind farm Project.
Project type: Energy industries (renewable/non-renewable sources).
Account holder: First Climate.
2.4.4 Energy
The total predicted in-scope energy consumption at Melbourne Fashion Week is be 26,487 kWh
representing 22.06 tonnes CO2-e. The breakdown by energy source is shown in Figure 4 below. There is
anticipated to be an even split between mains electricity 48% and that produced by generators 47%. City of
Melbourne events staff indicated that sixteen generators were intended to be used throughout the event,
which have been included in this assessment.
Figure 4: Energy breakdown from source
5 http://www.cleanenergyregulator.gov.au/OSR/ANREU/The-Australian-national-registry-of-emissions-units
6 https://vcsregistry2.apx.com/myModule/rpt/myrpt.aspEnergy Type % Breakdown
Mains electricity 48%
Mains gas 47%
Generator 5%
2.4.5 Transport
Transport represents 52% of the total event emissions broken down into ground and air travel. To predict the
ground transport emissions for Melbourne Fashion Week 2018, data collected from Melbourne Music Week
2015 was used to indicate the proportion of event attendees traveling by different transport options. As
shown in Table 4 below, public transport (train, tram and bus) is the highest transport mode. This is expected
due to the accessibility of the Melbourne Fashion Week events being in and around Melbourne CBD.
Table 4: Predicted ground transport emissions
Passenger
Passenger kilometres Passenger
kilometres travelled: kilometres Emissions
Transport Number of travelled: Passenger travelled: (tCO2-e) Emissions
mode trips % by mode kilometres % by mode % by mode
Train 11,560 16% 234,483 17% 38 20%
Tram 22,188 30% 351,683 26% 67 35%
Bus 1,072 1% 87,063 6% 16 8%
Car, taxi, 15,470 21% 311,424 23% 71 37%
Uber
Bicycle 7,411 10% 39,523 3% 0 0%
Walk, 16,299 22% 319,827 24% 0 0%
skateboard
Total 74,000 100% 1,344,004 100% 192 100%
The event organisers for Melbourne Fashion Week have identified that the event will engage a variety of
national and international models and support staff. The total number of flights is predicted to be 40 with
6 international flights and 34 domestic flights associated with the event. It is predicted that a total of 98,952
kg CO2-e will result from air travel to and from Melbourne Fashion Week 2018.
Accommodation for models and staff have also been included in the emissions profile. City of Melbourne
indicated that they provided two nights of accommodation for all artists or staff flying to Melbourne for the
event. The emissions for accommodation were calculated using data from Crown Melbourne 2016-17 Public
Disclosure Summary 7. Data for the standard king room and twin room emissions of 0.058 tonnes CO2-e, per
night accommodation was used in the calculation of emissions. This data point was selected as it most
closely reflected that for which City of Melbourne provides to models and staff. Total predicted emissions
associated with accommodation was determined to be 4.64 tonnes CO2-e.
7 NCOS Carbon Neutral Public Disclose Summary – Crown Melbourne Limited July 2016 to June 2017-
http://www.environment.gov.au/system/files/pages/098c4887-66c4-4c9e-a6d2-fe1551b49009/files/crown-pds-2016-
17.pdf2.4.6 Catering Catering is predicted to be the second largest contributor to the greenhouse gas emissions of Melbourne Fashion Week 2018. Food and drink from all venues is predicted to amount to 223.04 tonnes CO2-e, or 40% of the total emissions for the event. Based on collected data, red meat and beer is traditionally the largest contributor to emissions from catering. It is expected that catering for this year’s Melbourne Fashion Week is likely to have a similar catering emissions profile as that of Melbourne Music Week 2015. Figure 5: Breakdown of predicted catering emissions Catering Emission % Breakdown Meal - with red meat 32% Meal - other 5% Dessert 0% Non-alcoholic 11% Beer 41% Wine and spirits 9% Tea & coffee 2%
Figure 6:   Emissions associated with food and beverages

Emission Type                                              tonnes CO2-e
Food: Meal - red meat                                      71

Food: Meal - other                                         12

Food: Dessert                                              1

Drinks: Non-alcoholic                                      28

Drinks: Beer                                               91

Drinks: Wine and spirits                                   20

2.4.7   Waste

Waste for the pre-event emissions profile has been estimated using data collected for Melbourne Music
Week 2015. It is anticipated that 21.54 tonnes CO2-e of emissions associated with waste will be generated at
Melbourne Fashion Week 2018. This figure also includes 1.1 tonnes CO2-e of marketing and publication
materials estimated from collected data from Melbourne Knowledge Week 2018. An average amount of
marketing waste was calculated and then escalated based on the number of attendees. Figure 7 below
shows the expected composition of waste generation for the event.

Overall, it is expected that half over the waste generated from the event will be recycled (comingled and
drink recycling). We may see improvement in recycling rates in 2018 with increased awareness of
sustainability and proper disposal of waste since 2015.
Figure 7:   Waste breakdown

Waste type                                  % Breakdown
Landfill waste                              41%
Comingled recycling                         42%

Drink recycling                             8%

Food to landfill                            5%
Marketing & publications                    4%

2.4.8   Construction

The specific details of the event construction needs are not yet finalised. Based on discussions with
Melbourne Fashion Week event organisers, it was agreed that there would be similar levels of construction
to that undertaken at Melbourne Music Week 2015. Construction in that year totalled 2.62 tonnes CO2-e,
primarily sourced from the construction of elements of the Melbourne Town Hall.

2.5 Melbourne Fashion Week recommendations to reduce emissions

2.5.1   Potential emissions reduction initiatives

Along with the pre-event projections of emissions, Arup also identified potential areas to reduce emissions at
the event. If all the actions to reduce emissions are applied, an overall reduction of 53.5% from the total
event could be achieved. The areas of possible reduction with actions are outlined in Table 5 below.
Table 5:   Potential reductions and actions

Emissions           2018          Post       Action                  Potential Potential    Potential
Source              Predicted     action                             reduction reduction    reduction in
                    Emissions     emissions                          in source (kg CO2-e)   Melbourne
                                  profile                            emissions              Fashion
                                  (kg CO2-e)                          (%)                   Week
                                                                                            emissions
Generators          3,525         3,349         Appropriately size   5%        176          0.03%
                                                generators

Diesel              4,682         16            Use biodiesel        99%       4,666        0.83%
Generators

Electricity usage   Combined      Combined      Energy efficient     14%       1,913        0.34%
                    electricity   electricity   light equipment
                    usage         usage
                    13,575        1230
Electricity usage   Combined    Combined        Use lights           4%        508          0.08%
                    electricity electricity     efficiently
                    used 13,575 usage
                                1230

Electricity usage   Combined    Combined        1.5 kW solar array   1%        81           0.01%
                    electricity electricity
                    used 13,575 usage
                                1230
Electricity usage   Combined    Combined        GreenPower           100%      8,119        1.45%
                    electricity electricity
                    used 13,575 usage
                                1230

Electricity usage   Combined    Combined        LED lights           22%       3,021        0.53%
                    electricity electricity
                    used 13,575 usage
                                1230

Food consumed       83,970        39,172        Replace red meat     53%       44,798       7.93%
by patrons

Drink consumed      Combined      Combined      Less carbon          66%       91,142       7.65%
by patrons          drink         drink         intensive beer
                    consumed      consumed      suppliers
                    by patrons    by patrons
                    139,073       76,167

Drink consumed      Combined      Combined      Carbon neutral       100%      19,717       3.49%
by patrons          drink         drink         wine suppliers
                    consumed      consumed
                    by patrons    by patrons
                    139,073       76,167

Patron transport    192,308       134,715       Incentivise PT       7%        12,963       10.19%

Model /staff        98,952        0             Offset flights       100%      98,952       17.51%
flights
Emissions 2018 Post Action Potential Potential Potential
Source Predicted action reduction reduction reduction in
Emissions emissions in source (kg CO2-e) Melbourne
profile emissions Fashion
(kg CO2-e) (%) Week
emissions
Model/ staff 4,640 0 Select carbon 100% 4,640 0.82%
accommodation neutral
accommodation
Venue waste Combined Combined Minimise 9% 1,838 0.33%
venue waste venue disposable
20,424 waste packaging
11,595
Venue waste Combined Combined Encourage waste 34% 6,991 1.24%
venue waste venue diversion
20,424 waste
11,595
New construction 2,454 1,069 Use recycled 56% 1,385 0.25%
materials materials
Total 535,390 8 237,848 N/A N/A 297,542 52.6%
For the full list of detailed action items, refer to Appendix C. The following actions have been identified to
have the most reduction in emissions:
Replace red meat: Meals with red meat is predicted to contribute to 32% of food-related carbon emissions.
Red meat (beef or lamb) is the highest carbon emissions intensive type of food (by $ or kg), primarily due to
the methane related emissions from livestock. By replacing red meat with chicken, kangaroo meat or
vegetarian options, up to 53% in catering-related emissions can be reduced or just over 8% of the events
total predicted emissions. Another alternative is to replace meat with sustainable seafood. One of the
approved NCOS certified organisations is Austral Fisheries which provide sustainable seafood that has been
certified as carbon neutral in their operations.
Less carbon intensive beer: Based on Melbourne Music Week 2015, beer is expected to contribute to 41%
of the food-related emissions at Melbourne Fashion Week 2018. Whilst individual counts of beer are less
emissions intensive than other beverages, the amount of beers purchased will result in it being the largest
contributor in beverage emissions. By sourcing beer from suppliers that are less carbon intensive in their
production, beverage emissions can be reduced by up to 66% and overall emissions by 7.8%.
Carbon neutral wine supplier: Wine and spirits make up 9% of the total emissions associated with
catering. There is potential here to offset these emissions by purchasing these beverages from a carbon
neutral certified supplier. Ross Hill Wine Group based in NSW is NCOS certified and could supply wine for
the event.
Offset flights: Flights associated with Melbourne Fashion Week 2018 is predicted to make up 17.7% of the
total emissions for the event. These emissions can be completely offset through the purchasing of offsets
from NCOS certified airlines. These airlines include Qantas, Tigerair Australia, Virgin Australia and Jetstar.
Biodiesel use for generators: Biofuel is energy derived from renewable plant and animal materials. By
replacing the fuel source for generators, there can be large reductions in emissions. The reduction is
8 This figure is the total of predicted emissions from sources where reductions can be achieved. This figure will differ
from the overall emissions where sources of emissions have no potential reduction actions listed.dependent on the fuel mix selected – 100% biodiesel fuels can result in a 99.9% emission reduction
compared to pure diesel generators.
Green Power: City of Melbourne can acquire GreenPower for the Melbourne Fashion Week event.
Purchasing 100% GreenPower will offset electricity-related emissions for the event. The result is not a
reduction in total electricity usage but will contribute to the renewable energy generation elsewhere in
Australia.
2.5.2 Recommendations
There is additional scope to reduce emissions at partner venues, through the influence City of Melbourne
has as the overall manager of Melbourne Fashion Week. City of Melbourne can promote sustainable options
by:
• opting to partner with venues with sustainable credentials
• deliver education programs to City of Melbourne staff and partner organisations around sustainable
event management
• providing information to partner venues on sustainable initiatives that could be implemented, for
example, installing prominent recycling bins or purchasing renewable energy
• developing contract clauses for partners that ensure partners take steps to reduce emissions, for
example, offsetting their own emissions in order to come under the banner of Melbourne Fashion Week.
2.6 Conclusion
The City of Melbourne engaged Arup to develop a pre-event emissions profile for Melbourne Fashion Week
2018. The profile will be utilised to purchase emissions to offset the actual emissions and in order to become
a carbon neutral event. The key findings were:
• Melbourne Fashion Week 2018 is predicted to have a total emission of 648.6 tonnes CO2-e inclusive of
out of scope satellite events
• Transport (52%) and food catering (40%) is expected to be the largest contributors of emissions
• Meals with red meat and beer is expected to make up 73% of total food related emissions
By applying the recommendations identified in Section 2.5.1, it is possible for Melbourne Fashion Week 2018
to reduce their emissions by 53.5% or 297.7 tonnes CO2-e.3 Melbourne Music Week
3.1 Introduction
Arup was engaged by City of Melbourne to develop a pre-event carbon emissions profile for Melbourne
Music Week 16 to 24 November 2018 (Melbourne Music Week 2018). This report outlines the findings of the
pre-event emissions inventory analysis, highlights recommendations for improving the sustainability of the
upcoming event.
3.1.1 Melbourne Music Week
Melbourne Music Week (MMW) is a unique music event that celebrates Melbourne’s thriving music scene.
Held annually in November, Melbourne Music Week highlights the creativity and innovation of Melbourne,
with over 100 events held over eight days. Melbourne Music Week 2018 will be the ninth iteration of the
event and will involve partnerships with a range of promoters, venues, labels, artists and businesses.
The City of Melbourne manages Melbourne Music Week, along with a number of other Premier Events in the
city, including Moomba Festival, Melbourne Fashion Week and New Year’s Eve celebrations. Managing
these events with a focus on sustainability provides benefits for the community and the environment, and
aligns with City of Melbourne’s vision for a bold, inspirational and sustainable city. City of Melbourne is a
recognised leader in sustainable action, demonstrated in the eco-city goals outlined as part of the Future
Melbourne strategy and Council Plan 2017-2021.
Large events such as Melbourne Music Week are resource-intensive by nature, and thus provide a special
opportunity to engage and educate attendees on issues of sustainability. Sustainable events management
has continued to gain prominence in recent years, with the first International Standard for Event
Sustainability Management Systems (ISO 20121), published in 2012. Many music festivals and events
around the world now have a growing focus on sustainable events management, with a view to reduce the
negative impacts and enhance the positive outcomes of the event. This carbon account has been prepared
based on the National Carbon Offset Standard (NCOS).
There is potential for events run by City of Melbourne, such as Melbourne Music Week, to be managed more
sustainably, reducing their impact and helping to promote sustainability to the community. This report
explores this potential through the following aims:
• Identify and analyse the pre-event greenhouse gas emissions from transport, venue energy, catering,
waste and construction from Melbourne Music Week 2018
• Use this information to assess priority areas for the implementation of sustainability initiatives throughout
the event and future years
• Research best practice in music events to understand and quantify which sustainability initiatives will be
most effective in this context.
3.2 Pre-event Carbon Assessment Approach
3.2.1 Approach
The methodology for the pre-event emissions assessment of Melbourne Music Week is described below
based on five key stages.
• Stage 1. Define emissions scope.You can also read