MARKET OVERVIEW 2020 Kansas City - Kansas City Area Development Council
←
→
Page content transcription
If your browser does not render page correctly, please read the page content below
2020
MA R KE T O V E R VI E W
        Kansas City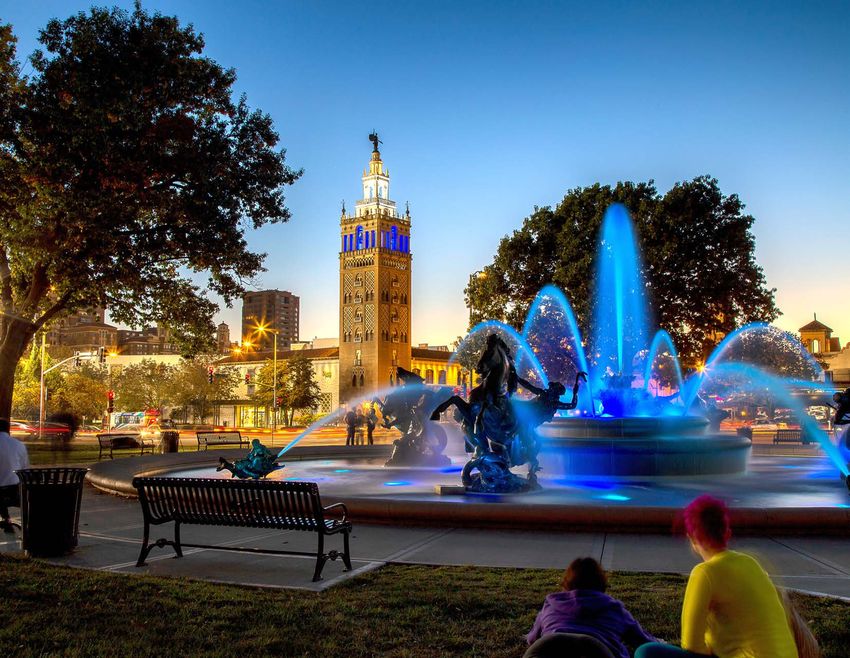
STRONG ECONOMIC FUNDAMENTALS
    •   Highly desirable central U.S. location with a vibrant economy
    •   Pro-business environment complemented by low costs of living and
        doing business
    •   Wide array of economic development support and incentives
    •   Significant banking and financial center (GSA, Federal Reserve, H&R
        Block’s World HQ)
    •   Kansas City has been dubbed the “Silicon Prairie” with the 6th-largest
        growth rate for tech talent over the last five years.
    •   Excellent quality of life and unique sense of community attract a highly
        educated workforce
    •   Unemployment rate of 3.1% compares favorably with the national rate
        of 3.4% (Dec 2019, not seasonally adjusted)
    •   Kansas City’s well-developed transportation and distribution network has
        30% more interstate miles per capita than any other city in the world,
        resulting in some of the shortest commute times in the U.S.

    KANSAS CITY MSA “AT A GLANCE”

    2,179,053                                  8.4%                                 2,273,074                                              28,148                                    35,743
        2019 Population                        2010-2019                             Estimated 2023 Population                             2019 Downtown                           Estimated 2026
         Source: ESRI, 2019               Population Growth Rate                            Source: ESRI, 2019                               Population                          Downtown Population
                                               Source: ESRI, 2019                                                                    Source: Downtown Council of               (27% growth since 2019)
                                                                                                                                          Kansas City, 2019
                                                                                                                                                                                Source: Downtown Council of
                                                                                                                                                                                     Kansas City, 2019

                              39%                            1,124,000                                           15.4%                                        3.1%
                             2013-2019                         Employment (Dec 2019)                                2010-2019                                Unemployment
                         Downtown Multifamily              Source: Bureau of Labor Statistics, 2019              Employment Growth
                            Growth (units)                                                                                                                     (Dec 2019)
                                                                                                                    Source: Bureau of
                                                                                                                                                           Source: Bureau of Labor
                        Source: Downtown Council of                                                               Labor Statistics, 2019
                                                                                                                                                               Statistics, 2019
                             Kansas City, 2019

2
KANSAS CITY
TRANSPORTATION ADVANTAGE
Kansas City is served by an excellent infrastructure
of highways and interstates, railways, major airport,
and public transportation systems. Its central location
and international airport system give local businesses
a competitive advantage in the U.S. and global
marketplace.

 With 30% more interstate miles per capita
 than any other city in the world, the Kansas
 City metro area’s efficient traffic flow offers
 its workforce efficient commutes that average
 only 23 minutes, placing Kansas City among
 the nation’s top 10 cities for best commutes.

 International airport currently undergoing a
 $1.5B renovation!

 Markets anywhere in the country or the world can be
 easily accessed, making Kansas City an ideal location
 for regional, national and international operations.

  DESTINATION           HWY MILES         FLIGHT TIMES
  Atlanta                   793                1:55
  Chicago                   501                1:15
  Dallas                    489                1:25
  Denver                    602                1:45
  Houston                   712                2:08
  Los Angeles              1,580               3:40
  Minneapolis               435                1:20
  New York                 1,221               2:51
  Orlando                  1,223               2:30
  Seattle                  1,820               3:50
  Toronto                   975                2:08
  Washington, D.C.         1,059               2:15
                                                          3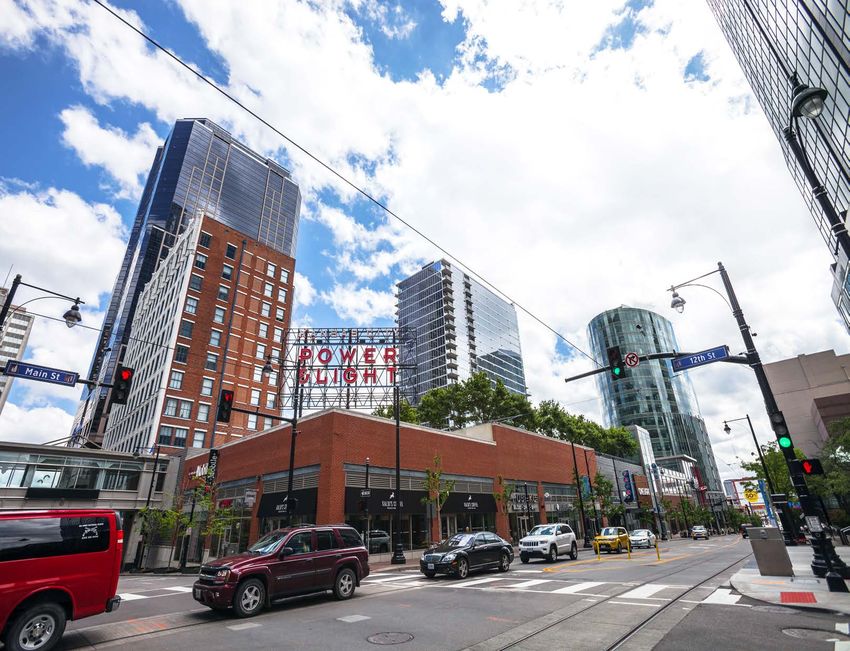
EMPLOYMENT BY SECTOR                                                                                                 COMPETITIVE COST OF LIVING
    Other : 0.9%
    Utilities : 0.9%                                                                                      Kansas City
                                                                 Health Care and
    Real Estate and Rental/Leasing : 4.2%                        Social Assistance
    Arts,EntertainmentandRecreation:4.2%                                                                    Phoenix

    Information : 4.2   %

                                                                                                          UnitedStates
    Wholesale Trade : 4.2%
                                                                 14.0   %             RetailTrade
    Public Administration : 4.2%
                                                                                                             Atlanta
    Admin. and Support &
    Waste MGMT Services: 4.5%
                                                                                                               Dallas
                                                                            10.5%     Professional,
                                     4.6%                                              Scientific,
    OtherServices,                                                                    & Technical         Minneapolis
    Except Public                                                                       Services
    Administration                   4.6    %
                                                                             9.4%                            Denver
    Transportation                     6.2%
    &Warehousing                                                                                          LosAngeles
    Finance &                                   6.2%                    9.3%
    Insurance                                                                                                Boston
                                                       6.8%   8.2%                   Manufacturing
    Construction                                                                                                         0      20     40      60           80        100   120   140   160
    Accommodation&FoodServices                                                       EducationalService                                             Cost of Living Index

    Kansas City’s economy is one of the nation’s most diverse
                                                                                                                         Kansas City’s cost of living index is 94.0 according to the
    with no one sector comprising more than 14% of its
                                                                                                                         Council for Community and Economic Research (C2ER)
    overall employment

4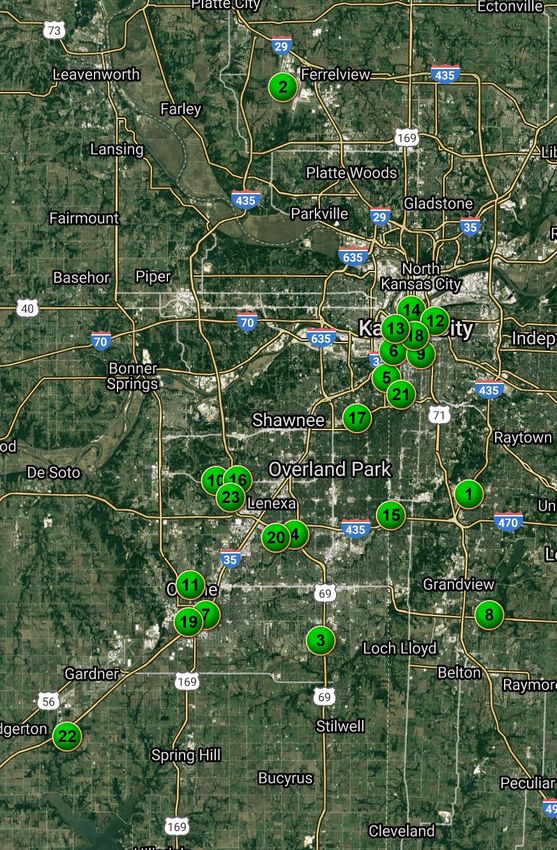
KANSAS CITY’S                                             MAJOR CORPORATIONS HEADQUARTERED IN KANSAS CITY
LARGEST PRIVATE EMPLOYERS
                                                          1. AMC Entertainment                 9 Garmin International               17. Sprint
EMPLOYER                                      EMPLOYEES   2. American Century Investments      10. H&R Block (#726)                 18. UMB Financial
                                                          3. Black & Veatch                    11. Hallmark                         19. Evergy (#817)
Cerner Corp.                                   14,000     4. Burns & McDonnell                 12. JE Dunn                          20. Waddell & Reed
HCA Midwest Health System                       9,934     5. Cerner Corporation (#519)         13. Kansas City Southern (#815)      21. YRC Worldwide (#532)
                                                          6. Commerce Bank                     14. Lansing Trade Group
The University of Kansas Hospital               9,810     7. Ferrellgas Partners (#977)        15. Lockton
St. Luke’s Health System                        8,020     8. Freightquote                      16. Seaboard Corp. (#481)

Children’s Mercy Hospital & Clinics             7,096
                                                          Note: Fortune 1000 Companies Denoted with 2018 Rank, AMC Entertainment Inc. is disqualified
Ford Motor Company                              7,030     because of its majority foreign ownership. Garmin is excluded due to its incorporation in Switzerland.
Sprint Corp.                                    6,000
Hallmark Cards Inc.                             5,000
Garmin International                            3,651
Honeywell                                       3,637
Truman Medical Center                           3,488
Black & Veatch                                  2,926
NPC International, Inc                          2,889
Burns & McDonnell                               2,792
Olathe Health                                   2,550
BNSF International                              2,500
Amazon                                          2,500
Commerce Bank                                   2,459
Advent Health                                   2,453
UnitedHealth Group                              2,400
Farmers Insurance                               2,282
General Motors                                  2,200
Evergy Inc.                                     2,185
Prime Healthcare                                2,144
UMB Bank                                        2,105
US Bank                                         2,100
Source: Kansas City Business Journal, 2018.

                                                                                                                                                                   5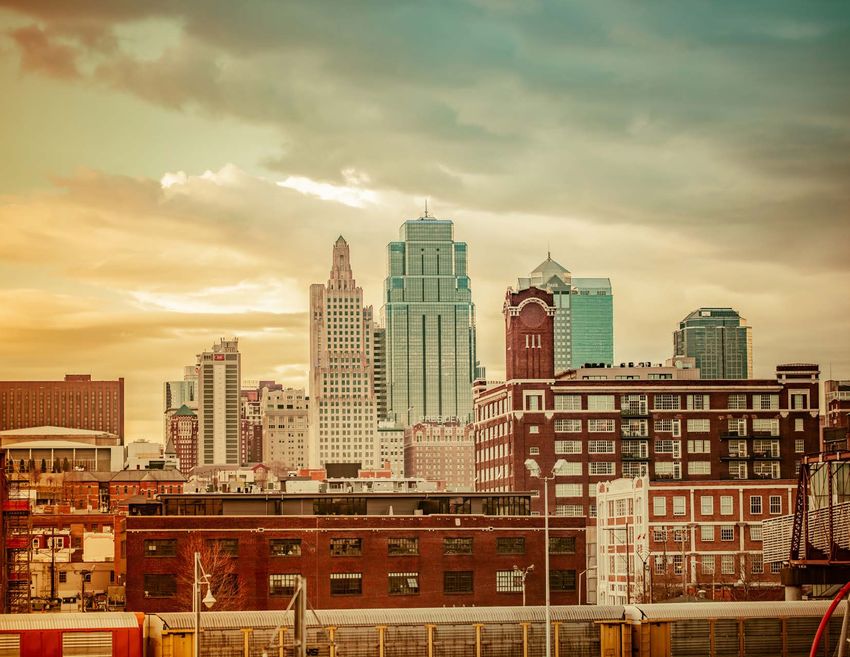
MAJOR RECENT MSA DEVELOPMENTS
          NAME                                      S TAT U S        LOCATION   CO S T
     1    Cerner Trails Campus                      Ongoing          Suburban   $4.45 B

     2    KCI Single-Terminal Airport           Under Construction   Suburban   $1.50 B

     3    BluHawk                                   Ongoing          Suburban   $750 M

     4    CityPlace                                 Ongoing          Suburban   $450 M

     5    University of Kansas Medical Center       Complete         Suburban   $370 M

     6    Loews Convention Center Hotel         Under Construction   Downtown   $325 M

     7    Garmin HQ Expansion                       Ongoing          Suburban   $263 M

     8    Gateway Sports Village                Under Construction   Suburban   $234 M

     9    Children’s Mercy Research Tower       Under Construction   Downtown   $200 M

     10   Lenexa City Center                        Ongoing          Suburban   $200 M

     11   Johnson County Courthouse             Under Construction   Suburban   $175 M

     12   Embassy Suites (Federal Reserve)      Under Construction   Downtown   $146 M

     13   Waddell & Reed HQ                     Under Construction   Downtown   $140 M

     14   Commerce Tower Renovation                 Complete         Downtown   $130 M

     15   Burns & McDonnell HQ Expansion            Ongoing          Suburban   $127 M

     16   Sonoma Plaza – Mixed Use              Under Construction   Suburban   $120 M

     17   Mission Gateway – Mixed Use           Under Construction   Suburban   $110 M

     18   Two Light Apartments                      Complete         Downtown   $105 M

     19   Olathe Medical Center                     Complete         Suburban   $100 M

     20   Johnson County Community College          Complete         Suburban   $99 M

     21   46 Penn Center Office Tower           Under Construction   Suburban   $93 M

     22   Kubota North American D.C.                Complete         Suburban   $87 M

6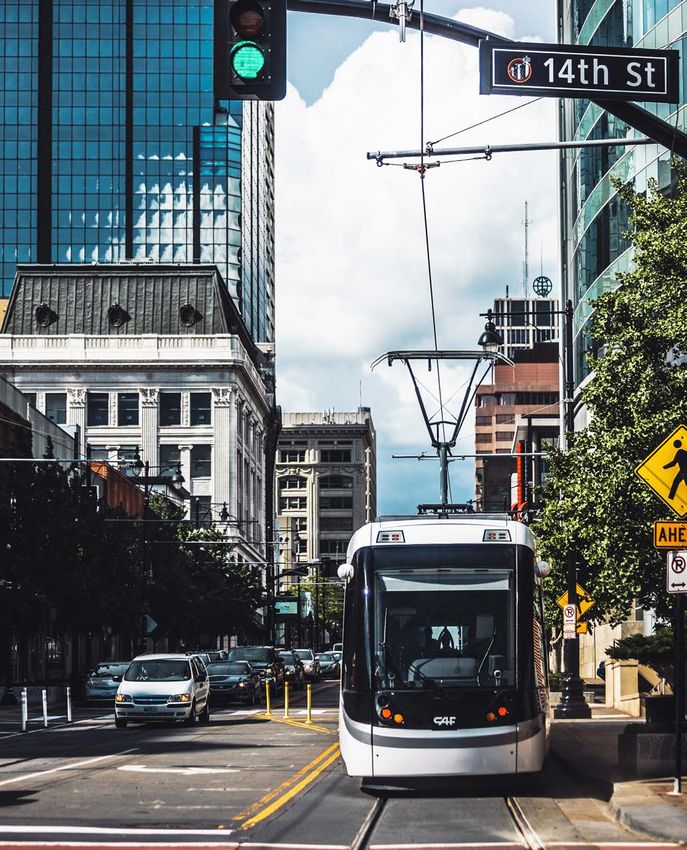
7
BIOSCIENCE
    The Kansas City region is a proven global leader in animal health, drug
    development, diagnostics and clinical research. Locating in the Kansas City
    area provides access to a network of companies and organizations which
    collaborate in helping businesses grow and advance their technologies.
    Kansas City sits in the heart of the Animal Health Corridor, stretching from
    Manhattan, KS to Columbia, MO. The corridor is home to more than 300
    animal health companies, representing the largest concentration in the world
    (75% of industry businesses).

    REGIONAL BIOSCIENCE ORGANIZATIONS
    •    BioKansas
    •    BioResearch Central
    •    Kansas Bioscience Authority
    •    Kansas City Animal Health Corridor
    •    Kansas City Area Life Sciences Institute
    •    Missouri Biotechnology Association
    •    Missouri Technology Corporation

               The ANIMAL HEALTH                Kansas city is the heart of         20 UNIVERSITIES          Rated 5th per capita in clinical          The region offers
             CORRIDOR, anchored by                the ANIMAL HEALTH            throughout the region offer      trials conducted by 100+          8 INCUBATORS and several
        Manhattan, KS, and Columbia, MO,       CORRIDOR which represents      undergraduate, graduate and          CLINICAL RESEARCH                  SCIENCE PARKS are
               is home to more than           56% of total worldwide animal     post-doctorate degrees in        ORGANIZATIONS in the           available or under development
               300 ANIMAL HEALTH               health, diagnostics, and pet   bioscience-related programs                 region
           COMPANIES,representing the                   food sales
         largest concentration in the world

8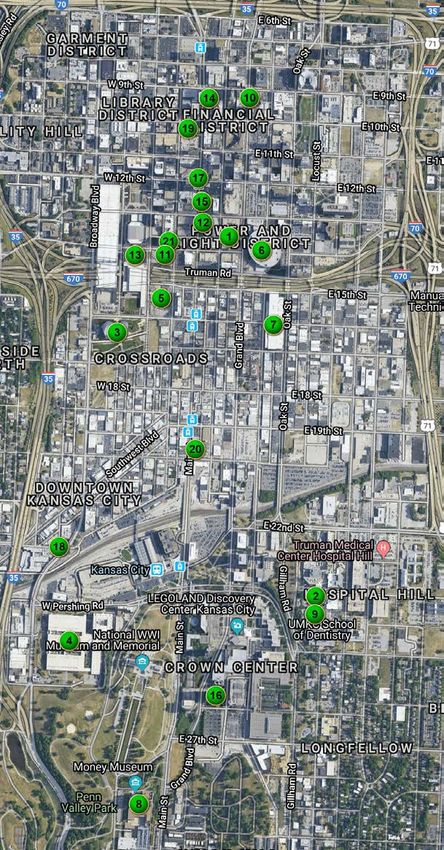
SPORTS DESTINATION

Sprint Center Arena                                                                 Kansas Motor Speedway
$276-Million, state-of-the-art entertainment venue and arena seats 18,500           Home to NASCAR, the facility hosts over 200 events each year and
people and has hosted more than 11 million guests since its opening in 2007,        boasts a 1.5 mile oval track and 74,000 person seating capacity.
making it one of the busiest arenas in the nation.
                                                                                    Children’s Mercy Park
Arrowhead Stadium                                                                   Home to Sporting Kansas City (Major League Soccer), the stadium has
Home of the 2020 Super Bowl Champion Kansas City Chiefs. One of the most            a capacity of 18,467 for soccer and 25,000 for concerts.
iconic football stadiums in the country, and also holds numerous other events
throughout the year. The stadium has a seating capacity of 76,416 (6th largest in   T-Bones Stadium
the NFL), and underwent a $375 million renovation in 2010.                          The 4,800 seat stadium is home to the T-Bones a professional baseball team and
                                                                                    member of the American Association of Independent Professional Baseball.
Kauffman Stadium
Commonly referred to as “the K”, home to the Kansas City Royals the stadium         Silverstein Eye Centers Arena
is one of the crown jewel ballparks Major League. The K has played host to the      The 5,800 seat arena is home to the Kansas City Mavericks an affiliate of the NHL’s
World Series twice over the past four seasons and was showcased at the 2012         Calgary Flames, and the Kansas City Comets a professional indoor soccer team
All-Star Game. Current seating capacity is 37,903, with additional standing         and member of the MASL
room to exceed 40,000.

     Children’s Mercy Park                                                                                                                     Sprint Center Arena

     T-Bones Stadium                                                                                                                           Kauffman Stadium

     Kansas Motor Speedway                                                                                                                     Silverstein Eye Centers Arena

                                                                                                                                               Arrowhead Stadium

                                                                                                                                                                               9
AMENITIES
Power & Light District World Class Museums
Located in the heart of Downtown Kansas City, the mixed-use development Kansas City is a major cultural center, featuring one of the
comprises nine city blocks and the district’s more than one-half million largest collections of national museums in the country.
square feet includes over 50 unique shops, restaurants, bars, and
entertainment venues.
Village West
Located on the west side of Kansas City, KS, the Village West area is the #1
tourist destination in Kansas. Anchored by the Kansas Motor Speedway and
Children’s Mercy Park. Also located in the Village West area is the 730,000
sf Legends outdoor shopping center, Kansas City T-Bones Park, Nebraska
Furniture Mart (one of the largest home furnishing stores in North America),
Liberty Memorial & the National
Cabelas, Great Wolf Lodge, and Hollywood Casino. World War I Museum
Negro Leagues Baseball Museum
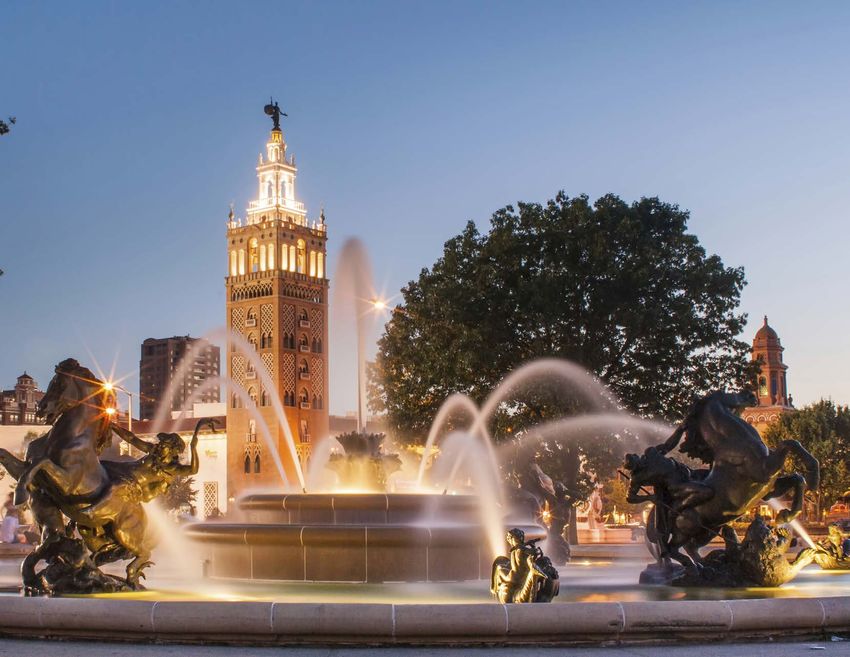
Country Club Plaza
Often referred to simply as “The Plaza” offering more than 150 shops and
restaurants in a historic outdoor setting inspired by the architecture and
ambiance of Seville, Spain.
Crown Center The Money Museum
American Jazz Museum
Often called a “city within a city”, Crown Center is one of the nation’s first (Located at The Federal Reserve Bank)
mixed-use redevelopments. The Crown Center shops contains approximately
50 retailers and restaurants. Entertainment options include Sea Life Aquarium,
Legoland, Crown Center Ice Terrace, Coterie Theatre, and Union Station
(Science City, Planetarium, City Stage Theatre, Regnier Extreme Screen Theatre,
Special Event Spaces, Fine Restaurants)
The National Museum of
Zona Rosa National Airline History Museum
Toys and Miniatures
Open-air, mixed-use shopping center with over 100 merchants and restaurants.
Featuring a variety of upscale retail, restaurants, entertainment, office space,
and luxury residential units.
Starlight Theatre
One-of-a-kind historic outdoor theatre with
Broadway musicals, Off-Broadway shows, and concerts.
National Frontier Trails Museum The National Archives at Kansas City
Kauffman Center for the Performing Arts
Completed in 2011, the $413 million venue is nationally recognized as an
architectural icon. Hosts diverse performances of local to global acclaim and
also provides a performance home for its resident companies, the Kansas City
Ballet, the Lyric Opera and the Kansas City Symphony.
The Nelson-Atkins Museum of Art Kemper Museum of Contemporary Art
10KANSAS CITY IS THE BARBECUE CAPITAL OF THE WORLD
Barbecue in Kansas City is more than just a way of preparing food, it’s an institution with a
rich tracing back to the early 1900’s. Today over 100 barbecue restaurants can be found
spread across the Kansas City metro. Visitors from around the world are drawn to the area to
experience Kansas City’s unique cuisine.
AWARD-WINNING LOCAL FAVORITES
Arthur Bryant’s Barbecue Joe’s Kansas City Bar-B-Que
The 18th & Vine Classic is a legendary Nationally celebrated restaurant, well known
hotspot visited by the likes of former for its original location in a former Gas
Presidents Harry Truman, Jimmy Carter, Station in Kansas City, KS.
and Barack Obama.
Q39
Gates Bar-B-Q One of the hottest restaurants in Kansas City,
A Kansas City original family owned this restaurant is one of the newer barbecue
company dating back to 1946. joints in town but has quickly gained a
reputation as one of the best in town.
Fiorella’s Jack Stack Barbecue
For more upscale tastes this restaurant is a
local favorite with an expansive menu.
THE AMERICAN ROYAL & THE WORLD SERIES OF BARBECUE
The American Royal spans almost the entire fall season, including more than 40 activities
headlined by the three-day World Series of Barbecue Event. Events include a barbecue judging
class, horse shows, rodeo, livestock show, and much more.
The World Series of Barbecue attracts roughly 50,000 people and 600-plus competition teams,
the event is recognized as the biggest barbecue contest and celebration in the world.
Beyond the livestock shows, rodeos, and barbecue competition, The American Royal serves
for a greater purpose of educating the public about the role of agriculture in the 21st Century.
The American Royal reaches over 104,000 people each year, including over 16,000 students
through programs and outreach, providing over 100 scholarships for academic excellence and
achievements and hosts more than 2,400 contestants in nationally recognized competitive events.
OTHER LOCAL BARBECUE COMPETITIONS
• Great Lenexa BBQ Battle • NKC Missouri State BBQ Championship
• KC Kosher BBQ Championship • Sam’s Club National BBQ Tour
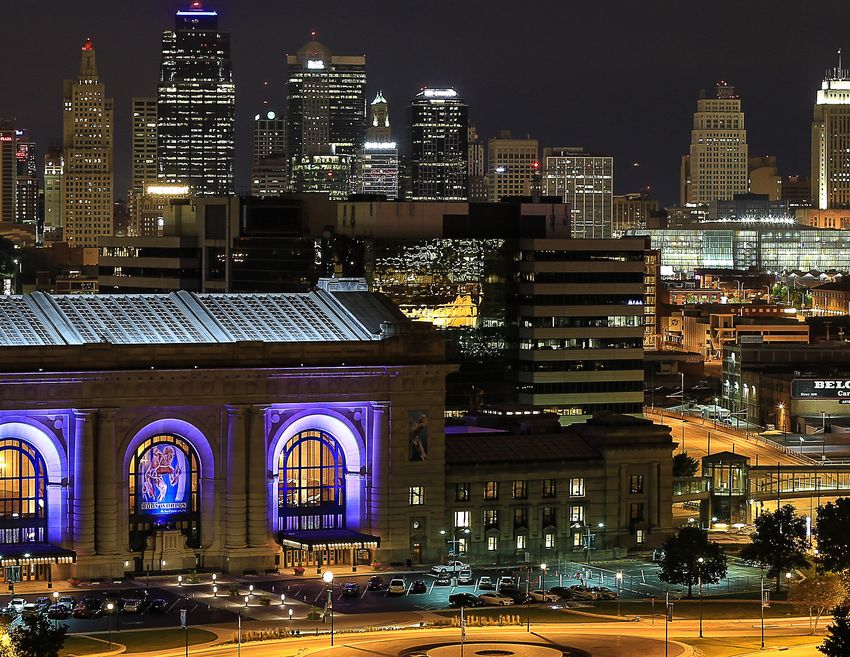
11DOWNTOWN DEVELOPMENT
Renter Occupied
Median Age 2019-2026 Daytime Population BachelorsDegreeorHigher Housing Units 2000-Q4 2019 2000-Q4 2019 2000-Q4 2019 Q1 2014-Q4 2019
(2019 estimate) ProjectedPopulationGrowth (2019 estimate) (2019 estimate) (2019 estimate) Capital Invested New Multifamily Units New Hotel Units Downtown Office Market
Occupancy Increase
33.4 27% 114,915 52.2% 69.0% $7.7 B 8,169 2,156 600 bps
(metro avg. 38.0) (metro avg. 37.5%) (metro avg. 33.0%)
Downtown Kansas City is in the midst of a major revitalization, restoring the vibrant urban core that existed decades ago. Kansas City had particularly suffered from the flight to the
suburbs in post-war America. By the early 2000’s downtown Kansas City had virtually no place to live, and even less to do. The 21st Century brought a new wave of developers who
saw the potential in downtown and were willing to invest in its future. Highlighted by the major development of the Power & Light District (P&L) and the state-of-the-art Sprint Center,
the city’s urban core has transformed into a premier area to live, work, and play. The 1 million sq. ft. of retail and entertainment space created by the P&L in 2007 helped to spark a
new generation of downtown visitors.
More recently a residential boom has begun with 5,505 units completed since 2014, and another 2,595 units under construction with completion expected over the next two years.
The majority of these new units are in redeveloped historic office and industrial buildings that had long sat vacant. While most in previous generations would have never considered
downtown as a place to call home, today downtown is becoming the hip place to live, particularly for millennials coveting the chance to live in a walkable urban center.
Kansas City has the fastest growing Downtown area DOWNTOWN POPULATION GROWTH 2010 - 2018
in the Midwest 70
60
50
40
30
20
10
0
s
it
uis
ee
nd
ille
ity
lis
ti
go
lis
bu
na
tro
po
apo
uk
sC
ica
a
Lo
isv
lum
cin
vel
nea
De
lwa
nsa
ian
Ch
u
St.
Cle
Cin
Lo
Min
Co
Ind
Mi
Ka
12MAJOR DOWNTOWN DEVELOPMENTS
NAME COMPLETION YEAR CO S T
1 Power & Light District 2007 $850 M
2 Children’s Mercy Hospital 2012 $600 M
3 Kauffman Center for the Performing Arts 2011 $413 M
4 IRS Processing Facility 2006 $370 M
5 Loews Convention Center Hotel 2020 $325 M
6 Sprint Center Arena 2007 $276 M
7 KC Star Printing & Distribution Facility 2006 $200 M
8 Federal Reserve Bank of Kansas City 2008 $200 M
9 Children’s Mercy Research Tower 2020 $200 M
10 Embassy Suites 2019 $148 M
11 Waddell & Reed HQ 2021 $140 M
12 H&R Block HQ 2006 $138 M
13 KC Convention Center Grand Ballroom 2007 $135 M
14 Commerce Tower 2017 $130 M
15 Two Light 2018 $105 M
16 Shook Hardy & Bacon HQ 2003 $100 M
17 Downtown Streetcar 2016 $100 M
18 Crossroads Westside Apartments 2018 $90.5 M
19 Hanover Loft Apartments 2003 $82.0 M
20 City Club Apartments 2019 $72.0 M
21 Power & Light Apartments 2016 $70.0 M
1314
OFFICE MARKET

          12.9%                                  $20.93                             6.6%                        599,543 SF                        237,447 SF
             Vacancy
                                              Gross Avg. Asking                 Asking Lease Rate               2019 Net Absorption                       2019
               Rate
                                                 Lease Rate                    Increase Year-over-                                                  M.T. Completions
                                                                                      Year

    Source: CBRE Research, Q4 2019.      Source: CBRE Research, Q4 2019.   Source: CBRE Research, Q4 2019.    Source: CBRE Research, Q4 2019.   Source: CBRE Research, Q4 2019.

•      Kansas City’s office market is historically stable, bolstered
       by its affordable occupancy costs and central U.S.
       location. Comprised of 52.5 million sq. ft. of multi-tenant         Net Absorption and Vacancy Rates
       office space, 39% of which is high-quality Class A space.

•      Vacancy rates have been declining over the long term.
       From Q4 2015 to Q4 2019, vacancy rates declined by
       180 basis points (bps) in the overall market, 110 bps
       in the Suburban market, and 310 bps in the
       Downtown submarket.

•      Net absorption totaled 1.2 million sq. ft. from
       2017-2019 in the overall market.

•      Asking lease rates increased 6.6% from Q4 2018 to Q4
       2019 in the overall market, 5.6% in the Suburban market,
       and 9.5% in the Downtown submarket.

•      Multiple competitive office projects reached completion in
       2019. CityPlace III, a 120,268 sq. ft. building which was
       100% leased soon after completion; Lenexa City Center
       completed 94,269 sq. ft. of office space contained in four
       seperate mixed-use buildings; and Corrigan Station II a
       22,910 sq. ft. building downtown.
                                                                            Source: CBRE Research, Q4 2019.
•      On-going multi-tenant construction totaled 566,637 sq.
       ft. at the end of Q4 2019, with 46% of the space pre-
       leased.

                                                                                                                                                                                  15
OFFICE MARKET: RECENT, NOTABLE EXPANSIONS AND RELOCATIONS
Kansas City’s big-city business amenities and small-market ease of living has made it a preferred corporate location. The following companies
have recently announced plans to either locate significant new operations or expand existing operations across the Kansas City metro.
CO M PA N Y # JOBS TYPE YEAR CO M PA N Y # JOBS TYPE YEAR
150 Expansion 2016 70 Expansion 2018
300 New 2017 225 New 2018
650 Expansion 2017 400 Expansion 2018
125 Expansion 2017 65 New 2018
2016-
400 Expansion
2018 568 New 2019
4,000
*12,000
Expansion 2018
more
1,000 Expansion 2019
planned
500 New 2018 150 New 2019
250 Expansion 2018 100 New 2019
135 Expansion 2018 700 Expansion 2019
Cerner Innovations Campus CityPlace III (Wellsky) Burns & McDonnell (Corporate HQ Expansion)
16OFFICE MARKET: STATISTICS
Office Submarkets Occupancy Rates and Asking Rates
100% $30.00
90% $25.00
$20.00
80%
$15.00
70%
$10.00
60% $5.00
50% $0.00
2013 2014 2015 2016 2017 2018 2019
Occupancy Occupancy Class A
Occupancy Class B Direct Average Asking Rents (Gross)
Direct Average Asking Rents (Gross) - Class A Direct Average Asking Rents (Gross) - Class B
Source: CBRE Research, Q4 2019.
Market Statistics | Fourth Quarter
SUBMARKET INVENTORY SF VACANCY OCCUPANCY NET ABSORPTION SF (Q4 2019) NET ABSORPTION (2019) DIRECT AVERAGE ASKING RENTS (FS)
Downtown 12,378,799 15.6% 84.4% 22,568 70,113 $21.11
East Kansas City 3,066,483 11.6% 88.4% 2,047 (10,184) $16.71
Kansas City North 4,524,704 21.2% 78.8% (35,767) 255,620 $17.98
Kansas City, KS 939,163 5.2% 94.8% 250 31,181 $16.12
Midtown 1,396,142 9.5% 90.5% 3,208 (36,276) $17.43
Plaza 3,262,059 9.2% 90.8% 1,177 (109,267) $26.56
North Johnson County 5,425,749 9.6% 90.4% 15,595 58,702 $21.45
South Johnson County 17,556,684 11.8% 88.2% 165,765 163,382 $22.35
South Kansas City 3,976,267 11.2% 88.8% 50,650 173,089 $19.29
Suburban 40,147,251 12.1% 87.9% 202,925 529,430 $20.87
Metro Overall 52,526,050 12.9% 87.1% 225,493 599,543 $20.93
Source: CBRE Research, Q4 2019.
Includes multi-tenant office buildings 10,000 sf+
17MULTIFAMILY MARKET
MARKETVIEW
4.7% $979 4,062 3,126
Vacancy Rent/Unit ($) 2019 Net Completions (Units)
Rate Absorption (Units)
Source: CBRE Research, Q4 2019. Source: CBRE Research, Q4 2019. Source: CBRE Research, Q4 2019. Source: CBRE Research, Q4 2019.
• Kansas City’s consistent population growth, developing
transportation system, and stable economic base have Net Absorption and Asking Rent
made it a prime target for multifamily investment by
national capital.
Units, 000's Asking Rent ($/unit)
• The Kansas City metro population has increased 7.8% 5 $1,000
since the 2010 census, outpacing the Midwest average
growth of 3.6% over the same time period.
4 $950
• Net absorption totalled 4,062 units in 2019, ahead of
2018 which finished with a total net absorption of 3,286.
The Kansas City market posted over 13,000 units of 3 $900
positive net absorption over the last 4 years.
• Downtown Kansas City, MO delivered 777 units in 2019. 2 $850
Young professionals/millennials are flocking to the area
and demand is far-out pacing supply. An additional 2,595
units are under construction with expected completions 1 $800
over the next two years.
• New suburban development will focus on areas with a 0 $750
strong live-work-play environment. These are submarkets 2013 2014 2015 2016 2017 2018 2019
located outside of the urban core that have characteristics
similar to downtowns, such as Lenexa City Center,
Total Net Absorption Asking Rent ($/unit)
CityPlace, or the revitalization of downtown Overland
Park. Source: CBRE Research, Q4 2019.
18INDUSTRIAL MARKET
4.6% $4.86 MARKETVIEW
6.2 MSF 4.5 MSF
Vacancy Avg. Asking Lease 2019 Net 2019
Rate Rate (NNN) Absorption Completions
Source: CBRE Research, Q4 2019. Source: CBRE Research, Q4 2019. Source: CBRE Research, Q4 2019. Source: CBRE Research, Q4 2019.
• Kansas City is in an ideal location for the evolving
industrial climate. With a central location and exceptional
transportation network featuring 30% more interstate miles Net Absorption and Vacancy Rates
per capita than any other city in the nation. Kansas City is
home to four railroad intermodals and handles more rail Sq. Ft., "000's" Vacancy Rate (%)
traffic (in terms of tonnage) than any other city in the U.S.
With the rise in industrial development and demand across 4,000 7.0
the nation over the last 8 years, Kansas City has grown 3,500
from a secondary market into a strategic market with 6.0
fundamentals that rival some of the top markets 3,000
in the nation. 2,500 5.0
• A total of 29.7 million sq. ft. of industrial space was 2,000 4.0
developed from 2015-2019, one the highest total in the 1,500
Midwest. 3.0
1,000
• Major drivers for Kansas City include e-commerce, third- 500 2.0
party logistics, and motor vehicle manufacturing.
0
1.0
• Kansas City is the second largest hub for automotive (500)
manufacturing in the nation, featuring plants for both Ford (1,000) 0.0
and General Motors.
Q1 2017 Q2 2017 Q3 2017 Q4 2017 Q1 2018 Q2 2018 Q3 2018 Q4 2018 Q1 2019 Q2 2019 Q3 2019 Q4 2019
• Vacancy rates declined 130 bps from Q4 2016 to Q4 Clay Jackson Johnson Platte Wyandotte Total Net Absorption (L) Vacancy Rate (R)
2019. This decline is evidence of the strength of the
market as it coincided with 16.8 million sq. ft. completed Source: CBRE Research, Q4 2019.
over the same time period.
• Since the end of the Great Recession in 2012, the Kansas
City market has posted 37.1 million sq. ft. of positive net
absorption (an average of 4.6 million sq. ft. per year).
19RETAIL MARKET
MARKETVIEW
7.0% $13.03 82,602 SF 150,599 SF
Vacancy Avg. Asking Lease 2019 Net Absorption 2019 Completions
Rate Rate (NNN)
Source: CBRE Research, Q4 2019. Source: CBRE Research, Q4 2019. Source: CBRE Research, Q4 2019. Source: CBRE Research, Q4 2019.
• The retail market is evolving, driven by the rise in
e-commerce and changing consumer dynamics. Retail Completions
Experience based retailers are thriving, and other retailers
are beginning to understand the importance of providing
innovative customer experiences and pushing the
Completed Sq. Ft.
entertainment aspect of the shopping experience. (000s)
500
• Partially shielded from the effect of e-commerce, grocery 450
stores experienced strong growth both nationally and
locally. One of the fastest growing retailers was Sprouts
400
Farmers Market which has added five locations in the past 350
five years in the Kansas City metro. Grocery continues to 300
grow in Kansas City with three Price Choppers recently
completed and a new Whole Foods location near the 250
UMKC campus. Aldis has also been active renovating and 200
relocating stores throughout the metro.
150
• Substantial development activity continues, with 1.7 100
million sq. ft. completed between 2017-2019. Significant 50
completions for retailers over that time-period included
McKeever’s Market in Lenexa; Cosentino’s Price Chopper 0
in Overland Park (BluHawk), Blue Springs, and Grain Q1 2017 Q2 2017 Q3 2017 Q4 2017 Q1 2018 Q2 2018 Q3 2018 Q4 2018 Q1 2019 Q2 2019 Q3 2019 Q4 2019
Valley; Costco in Kansas City, MO; Menards in Kansas
City, MO; Lowe’s in Overland Park; Academy Sports and Downtown East Kansas City Kansas City Kansas North Johnson County
B&B Theatres in Liberty; Main Event at the Edgewood
Farms development in Kansas City, MO; Whole Foods in Kansas City North Plaza South Johnson County South Kansas City
Kansas City, MO; Home Goods and Frontier Justice in
Kansas City, KS; and Dave & Buster’s at the Corbin Park
development in Overland Park. Source: CBRE Research, Q4 2019.
20KC RANKINGS
Top 10 in Economic Growth Potential No. 5 in Outstanding Architecture
Business Facilities, 2019 Curbed, 2017
Kansas and Missouri Top 10 States for Retirement No. 4 Best City for Career Opportunities
Bankrate, 2019 Fast Company, 2017
No. 2 U.S. Cities for High Paying Jobs No. 1 City for an Affordable Getaway
and Low Cost of Living Travel + Leisure, 2016
CNBC Make It, 2018
No. 1 Stadium in MLB
No. 5 Best Places for Work Life Balance Sports on Earth, 2016
Business Insider, 2018
6 Cities that Offer the
No. 3 Best Cities for Jobs Best Value for Startups
Glassdoor, 2017 Forbes, 2016
No. 2 City for High Wage Jobs Hotbed of Arts & Culture
Forbes, 2017 National Center for Arts Research, 2016
No. 4 City for Manufacturing Job Growth Happiest City to Work
Forbes, 2017 Forbes, 2016
No. 5 City for Tech Jobs Top 10 Most Affordable Cities
Money, 2017 PureWow, 2016
No. 4 Best City for Startups in U.S. No.1 Most Lovable City
Entrepreneur, 2017 Huffington Post, 2016
No. 9 Destination City Kansas City: A Future Ready Economy
U-Haul, 2017 Dell, 2016
No. 5 City for College Grads The Top Ten Cities for Creatives (#10)
Yahoo Finance, 2017 Huffington Post, 2015
No. 2 City for Women in Tech No. 4 Most Cultured Cities in America
SmartAsset, 2017 Huffington Post, 2015
Most Spectacular Theatre in the U.S. America’s Most Charming Cities
Curbed, 2017 Travel + Leisure, 2015
No.15 Busiest Metro for Forget Silicon Valley:
Commercial Construction 7 Better Cities for Startups
Dodge Data & Analytics, 2017 U.S. Department of Commerce, 2015
21T H A N K YO U CBRE © 2020 All Rights Reserved. All information included in this letter/proposal pertaining to CBRE, Inc.—including but not limited to its operations, employees, technology and clients—is proprietary and confidential and supplied with the understanding that such information will be held in confidence and not disclosed to any third party without CBRE’s prior written consent. This letter/proposal is intended solely as a preliminary expression of general intentions, is for discussion purposes only, and does not create any agreement or obligation by CBRE to negotiate or continue negotiations. CBRE shall have no contractual obligation with respect to the matters referred to herein unless and until a definitive, fully-executed agreement has been delivered by the parties. Prior to delivery of a definitive executed agreement, and without any liability to the other party, either party may (1) propose different terms from those summarized herein, (2) enter into negotiations with other parties and/or (3) unilaterally terminate all negotiations with the other party hereto. CBRE and the CBRE logo are service marks of CBRE, Inc. All other marks displayed on this document are the property of their respective owners, and the use of such logos does not imply any affiliation with or endorsement of CBRE.
You can also read