Greater Downtown Miami - Mid-Year Residential Market Study Update August 2018 - Prepared for the Miami Downtown Development Authority (DDA) By ...
←
→
Page content transcription
If your browser does not render page correctly, please read the page content below

Greater Downtown Miami
Mid-Year Residential Market Study Update

                     August 2018

Prepared for the Miami Downtown Development Authority (DDA)
By Integra Realty Resources (IRR)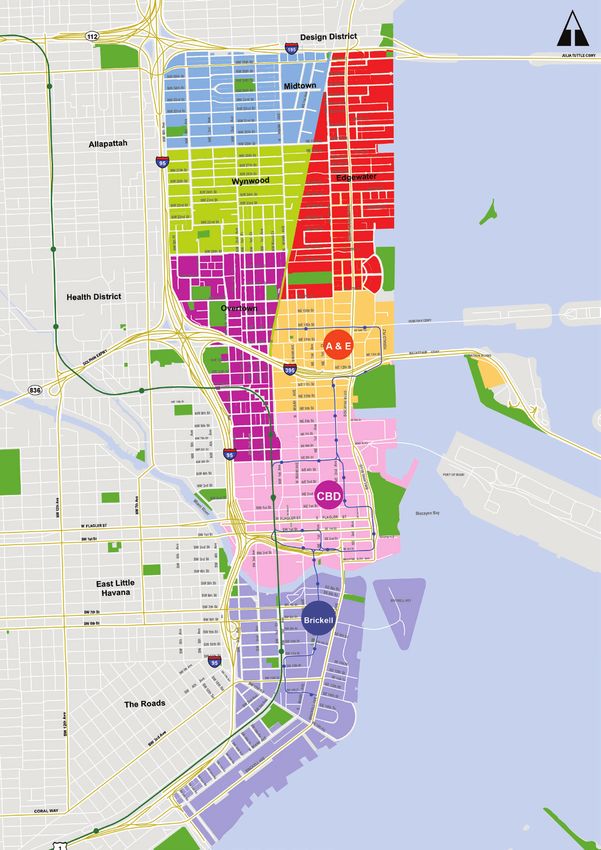
Greater Downtown Miami
Mid-Year Residential Market Study Update

Prepared for the Miami Downtown Development Authority (DDA)
by Integra Realty Resources (IRR)

August 2018

For more information, please contact

IRR-Miami/Palm Beach
The Dadeland Centre
9155 S Dadeland Blvd, Suite 1208
Miami, FL 33156
305-670-0001
dbowen@irr.com
Contents

2   Introduction
4   Greater Downtown Miami Market Submarket Map
5   What’s Changed Since Year-End 2017?
10 Submarket Analysis
12 Resale Condominium Pricing
15 Rental Market Statistics
18 Conventional Apartment Rents
20 Conventional Rental Market Supply
23 Condo Development Process Appendix
Introduction

Integra Realty Resources – Miami/Palm Beach (IRR-Miami) is pleased to present the following
Residential Real Estate Market Study within the Miami Downtown Development Authority’s
(Miami DDA) market area, defined as the Greater Downtown Miami market. This report updates
IRR-Miami’s findings on the local residential real estate market through July 1, 2018.

Key findings from this mid-year study are as follows:

• While everyone wants to see a continued “economic extension” prompted by tax cuts,
  strong wage growth, and overall positive economic news, Greater Downtown Miami’s
  new construction market continues to wind down the under-construction inventory of
  condominiums. The final push of condominium deliveries in Greater Downtown will happen
  towards the end of 2018, namely in Edgewater and the Arts & Entertainment District.

• Condominium rents and velocity year over year experienced normalized increases of
  2 to 3 percent on all but the 3-bedroom product.

• The continuing story of condo pricing declines is now set squarely in the resale condominium
  market. While average resale pricing declined again, and may even decline a bit further, the
  average pricing is quickly nearing the replacement cost threshold.

• Newer resales will not retreat as quickly because the sellers are new buyers with a higher
  average cost basis. As a result, new project sales will be slower overall in the coming
  12 to 18 months. This does not portend economic doom despite the market naysayers.

• The market champions who believe money will continue to flow into new condo developments
  against a wall of resale inventory can only credibly make that argument if the development
  offers something that’s not available in the resale market.

• Average rental rates downtown rebounded from a down-year in 2017. This “rent wobble”
  was largely due to project deliveries in 2017 which needed to stabilize, and the market rents
  in 2017 reflected increased pre-leasing activity and higher vacancy as projects competed with
  one another.

2 | Integra Realty Resources
Introduction

• The “rent wobble” of early 2017 could reasonably be expected to occur again in early 2019
  following the pending conventional multi-family deliveries expected at the end of 2018.
  Year-over-Year rents retreated -1.8% - 3.9% on a price per SF basis for one and two bedroom
  units. Studio units were the stand-out winner in 2018 with 16% average rent growth, and new
  projects coming to market with smaller average unit sizes and lower overall “chunk rents”
  may find similar success.

• While market-makers are plotting how to time the market, the largest fundamental decision
  is your own view on the length of continued economic expansion. How long can it last?
  How deep will be the retreat?

• The Integra mid-year 2018 report reflects the sum of all hopes (bulls) and fears (bears) in
  the market. There are many on both sides. No matter whether you are a bull or a bear, the
  condominium development market is standing on solid ground as of midyear 2018.

                               Respectfully,

                               Integra Realty Resources (IRR) – Miami/Palm Beach

                               Anthony M. Graziano, MAI, CRE, FRICS
                               Senior Managing Director

                               Dan Bowen
                               Market Research Analyst

3 | Integra Realty Resources
Greater Downtown Miami Market Submarket Map

The map opposite
illustrates the
boundaries of the
Miami DDA, as well
as each submarket
within the Miami
DDA market.

                     4 | Integra Realty Resources
What’s Changed Since Year-End 2017?

T  he headline change is the market since Q4-2017 was the completion of 1,145 units at SLS Lux,
   Aria on the Bay, and Hyde Midtown. This drops the total number of units remaining under
construction downtown at 3,849, down from nearly 5,000 units at YE 2017.

The development pipeline in Brickell has largely closed out and the last project under construction,
Brickell Flatiron, is reportedly experiencing high sales volume. In Edgewater, most of the product
under construction, largely comprised of The Related Group’s Paraiso District projects, is pre-sold
and slated for delivery in the second half of 2018. This year will also mark the substantial close out
of the Arts & Entertainment District when Canvas delivers, further diminishing the construction
pipeline across Greater Downtown (Figure 1b).

Some developers are reading the tea leaves and trying to be the first project “back” in a submarket
when value trends turn upward. In Brickell, Una started taking reservations, while Smart Brickell
launched directly into contracts. Okan Tower and YotelPad opened sales offices at their respective
sites in the CBD making the submarket one to watch in 2019 (Figure 1a).

5 | Integra Realty Resources

What’s Changed Since Year-End 2017?

Figure 1a
Greater Downtown Miami Current Growth – Contracts and Reservations
Submarket                      Building                        Avg. SF   Units   Status
Brickell                       Una                               2,478    135    Reservations
CBD		                          YotelPad                           563     215    Reservations
CBD		                          Okan Tower (former Sterling)       TBA     389    Reservations
Edgewater                      Bentley Edgewater Condo-Hotel      905     207    Reservations
Brickell                       One River Point                   1,284    350    Contracts
Brickell                       Smart Brickell                     632     100    Contracts
# in Contracts			                                                         350
# in Reservations			                                                      596

Figure 1b
Greater Downtown Miami Current Growth – Under Construction and Q2 Completions
Submarket                      Building                        Avg. SF   Units   Status
A&E                            Canvas                             892     513    Under Construction
A&E                            1000 Museum                       5,389     83    Under Construction
Brickell                       Flatiron                          1,334    549    Under Construction
CBD		                          Paramount Miami                   1,793    512    Under Construction
CBD		                          Aston Martin Residences           2,000    390    Under Construction
Edgewater                      Gran Paraiso                      1,549    317    Under Construction
Edgewater                      Paraiso Bay Tower I               1,360    360    Under Construction
Edgewater                      One Paraiso                       1,682    272    Under Construction
Edgewater                      Paraiso Bayviews                  1,044    388    Under Construction
Edgewater                      The Edgewater                      778      30    Under Construction
Edgewater                      26 Edgewater                       645      86    Under Construction
Edgewater                      Elysee                            3,383    100    Under Construction
Edgewater                      Missoni Baia                      2,950    249    Under Construction
# Under Construction			                                                  3,849

Brickell                       SLS Lux                           1,250    450    Complete
Edgewater                      Aria on the Bay                   1,317    648    Complete
Midtown                        Hyde Midtown                       944     410    Complete
# Completed Since Prior Report		                                 1,145   1,103

6 | Integra Realty Resources

What’s Changed Since Year-End 2017?

A   s this report was heading to press, Swire announced it was moving forward with plans for two
    large Brickell City Centre expansion sites near the river, and whispers of larger plans in Wynwood
began to emerge.

If there is a theme in the first half of 2018, it is that there are two camps of professionals in the market
firmly staked out in their thumbs up or thumbs down position. For lack of a better term, these are the
market’s bulls and bears.

The bears see devastation in the making as we enter a late cycle development period, one of the
longest economic expansions in US history, and few indications that currency and international
demand will return anytime soon.

The bulls believe that Miami has reached critical launch velocity in its downtown urban lifestyle, critical
mass, and residential appeal; and that continued massive liquidity in the equity and debt markets will
remain long-term. The bulls believe that the new Miami developers are emerging that will build without
50% presales, and who will use primarily their own equity with strong private or public balance sheets.
The bears counter this is just a sign of late cycle mechanics that makes the fall even worse.

What the bears cannot deny is that the on-going predictions of the market’s demise do not account for
the declining inventory of new construction being successfully delivered. What the bulls cannot deny
is that even as projects close-out, many units (25%+) immediately return to the market for resale. This
is having a depressing affect on the average resale value and the total resale listing inventory, which is
abnormally high.

What is evident in the composition of the remaining product under construction starting in 2019 is a much
more highly differentiated market, with product offerings in the $350,000 range, to as high as $8 Million.
Instead of shooting for a massive middle-market, the majority of the remaining pipeline will cater to
ultra-luxury, or competitive alternatives for local (primarily domestic) urban dwellers who buy versus rent.

7 | Integra Realty Resources
What’s Changed Since Year-End 2017?

O    n which side do you land? Whichever you are, bull or bear, the fact is that any economic stress
     that might cause a mis-step in the new construction market will have almost no impact relative
to the last downturn. By the end of 2018, the total number of units under construction will be less
than 2,500 units city-wide, a pipeline that is less than 10% as large as the pipeline during the last
reversal of fortune.

This extended economic rebound following tax reform, coupled with high liquidity in all sectors,
has mostly absorbed any massive shocks to the development pipeline.

Figure 2
Current Greater Downtown Miami Condo Pipeline – Q2 2018
Submarket                 Complete     Under Construction   Contracts   Reservations   Proposed   Totals

A&E                             0             596              0             0          2,291     2,887
Brickell                       4,939          549             450           135         5,160     11,233
CBD                            352            902              0            604         5,838     7,696
Edgewater                      1,698         1,802             0            207         1,296     5,003
Midtown                        410             0               0             0            0        410
Wynwood                         11             0               0             0           448       459
Total (2018 Midyear)           7,410         3,849            450           946        15,033     27,688
Total (2017 Q4)                6,312         5,002            520           344        15,016     27,194
Total (2017 Midyear)           5,180         5,078           1,225          505        14,381     26,369

Figure 2 outlines this continued decline of projects imminently entering the pipeline. This should allow
a 24-36 months stabilization of existing resales, which could bring prices back to equilibrium. Property
resales in newer buildings will be slower than older resales primarily because the seller’s cost basis is
higher. Predictions of deep discounts in resale pricing on newly delivered developer-product abound,
with the potential of bulk offerings continuing to make social media headlines. Nonetheless, no major
announcements on bulk deals are evident.

8 | Integra Realty Resources
What’s Changed Since Year-End 2017?
F rom trough to peak, the market topped out in Q2 2016 with a total of 7,499 units under construction.
We survived the danger-zone of stalled projects, or major pockets of standing developer inventory.
Integra’s estimate of “Proposed” projects counts all announcements, approvals, and conceptual plans
ever put forth for vacant or redevelopment sites in the city. To be sure, there is significantly more to come
in Wynwood and Midtown than currently in the proposed count. However, if this last peak demonstrated
the normalized development pace, Miami has another 2-3 cycles of 6,000 – 8,000 units downtown.
The ”proposed” pipeline as tracked by Integra is not imminent. Many of these projects get tabled or
redesigned through multiple market cycles. This represents the long-term (25+ year potential) of the
by-right landscape downtown, not current proposals that will emerge in the near-term 5-year time horizon.
Figure 3
Greater Downtown Miami Condo Market Size – Q2 2018
Submarket Current Market Current % Potential Long % Growth
Size [1] Growth Growth Term Growth Longterm
A&E 4,052 596 15% 2,291 57%
Brickell 24,782 1,134 5% 5,160 21%
CBD 6,640 1,506 23% 5,838 88%
Edgewater 5,750 2,009 35% 1,296 23%
Midtown 1,388 0 0% 0 0%
Wynwood 111 0 0% 448 404%
Total (2017) 42,723 5,245 12% 15,033 35%
[1] Long-Term Growth is the remaining Conceptual units, net of current growth
[2] Current Growth is all Under Construction, Contracts and Reservations
[3] Long Term Growth: 25+ year potential
Figure 3 outlines the critical mass by submarket. By the close of 2019, the city will have nearly 48,000
condominium units available in downtown plus another 11,500 conventional apartment units (Figure
9a). Despite new activity in Little Haiti, Little Havana, Coral Gables, and Dadeland, a compelling
case can be made that downtown has reached critical residential mass unmatched anywhere in the
county, or region, even accounting for condo units that are not occupied full-time.
9 | Integra Realty ResourcesSubmarket Analysis
A summary of the key changes to date:
Brickell
SLS Lux has been completed, and additional information about Smart Brickell has
allowed us to report a definitive number of condominiums with 100 units currently taking
contracts. Una, a new bay-front project near the Rickenbacker Causeway, has launched
reservations. On the rental side, the Panorama Tower – Florida’s tallest building – has
delivered and is currently in lease-up with its first residents now occupying the tower.
CBD
The Aston Martin groundbreaking in late 2017 was a boost of enthusiasm in an
otherwise quiet market for new groundbreakings. Sitting at the mouth of the Miami
River with Biscayne Bay and Brickell Key views, the power of the Aston Martin brand
will be on display. Following other branded projects in the market, Aston Martin is
targeting an ultra-lux buyer on a prime waterfront site.
Paramount Miami reports stronger-than-projected presales. This ambitious mixed use
project at full build-out could become a new focal point for development in the CBD.
Completion of conventional rental projects X Miami and Muze Met Square is
imminent. Some say the X Miami (formerly Vice) project will test the market’s for
smaller unit size in exchange for a lower “chunk” rent. This will be an interesting
contrast to Panorama finding the highest end of the rental market in the city’s tallest
residential building.
Arts and Entertainment
Square Station, a 710-unit conventional rental, has been delivered, and completion
of the condominium project Canvas is considered to be imminent. Art Plaza also
broke ground on 655 conventional apartment units.
10 | Integra Realty ResourcesSubmarket Analysis
Edgewater
Aria (648 units) has been completed, and deliveries at Related Groups’ Paraiso
projects are expected to complete shortly starting with Paraiso Bay. Despite Related’s
strong record of success in Edgewater, one of downtown’s most notable and active
players is waiting on the sidelines following the completion and close-out of the
majority of its Edgewater portfolio by the end of 2018.
Midtown
Midtown 29 completed in the first half of 2018, and work is ongoing at Midtown 6 and
8, all representing conventional rental product. Condominium Hyde Midtown also
delivered in the current period.
Wynwood
There are currently two ongoing rental developments in Wynwood – Wynwood 25 and
the Bradley (formerly Wynwood 26). There are no condo projects in the pipeline as
Wyn26 has been canceled after the developers reportedly failed to secure financing.
Overtown
Miami-Dade County is currently conducting an RFP for the redevelopment of Block
45, a county-owned parcel centered at 152 Northwest 8th Street near the Historic
Overtown Metrorail station in an area currently dominated by state and county
offices. This development will likely be majority retail and affordable housing but may
contain some market-rate rentals. Sawyer’s Landing (Block 55) is also proposed for
115 units of workforce housing and 220,00- SF retail.
11 | Integra Realty ResourcesResale Condominium Pricing
Figure 4
Average $/SF Sale Price Trend – Greater Downtown Miami Resale Market
$500
$457
$431 $426
$405
$372 $392
$400
$305
$300
$240
$221 $224
$200
$100
0
2009 2010 2011 2012 2013 2014 2015 2016 2017 1H 2018
F igure 5 shows that resale pricing continued to dip slightly in 2018, returning in between 2013-2014
levels on a per square foot (PSF) basis. This appears to be mainly driven by an ever-increasing
inventory of new listings even as sales velocity increases has ticked up in the past year. May and
June of 2018 represent two of the three strongest months since 2015 in terms of sales volume.
This uptick in velocity may be in response to softening pricing, but can also be largely characterized
by the markets’ recognition that pricing is unlikely to fall much below $350/SF which is generally
seen as replacement cost.
12 | Integra Realty ResourcesResale Condominium Pricing
Figure 5
Greater Downtown Miami Condo Listings (Built 2001+) by Month
(Zip codes: 33127, 33128, 33129, 33130, 33131, 33132, 33136, 33137)
Date For Sale New Listing Sold Pended Date For Sale New Listing Sold Pended
Jul-13 1,273 338 164 198 Jul-16 3,032 374 92 86
Aug-13 1,320 333 163 164 Aug-16 2,990 396 105 114
Sep-13 1,424 328 159 145 Sep-16 3,064 457 86 85
Oct-13 1,524 366 130 156 Oct-16 3,121 407 81 77
Nov-13 1,583 306 143 106 Nov-16 3,167 389 88 82
Dec-13 1,591 280 134 121 Dec-16 3,124 353 94 104
Jan-14 1,645 419 108 175 Jan-17 3,198 553 68 90
Feb-14 1,684 375 105 156 Feb-17 3,258 452 85 100
Mar-14 1,822 446 159 157 Mar-17 3,304 530 114 142
Apr-14 1,904 422 148 149 Apr-17 3,264 403 111 109
May-14 1,918 387 144 155 May-17 3,277 467 142 160
Jun-14 1,926 351 146 146 Jun-17 3,251 422 117 120
Average 1,635 363 142 152 Average 3,171 434 99 106
Jul-14 1,939 345 132 120 Jul-17 3,268 440 119 105
Aug-14 1,932 340 118 155 Aug-17 3,317 464 128 118
Sep-14 1,931 356 135 147 Sep-17 [1] 3,264 285 73 62
Oct-14 2,006 410 131 140 Oct-17 3,302 437 95 104
Nov-14 2,078 342 114 104 Nov-17 3,370 473 85 100
Dec-14 2,152 357 124 99 Dec-17 3,408 395 126 106
Jan-15 2,127 399 109 136 Jan-18 3,400 571 91 120
Feb-15 2,146 408 106 153 Feb-18 3,497 500 100 109
Mar-15 2,264 499 140 143 Mar-18 3,542 410 108 135
Apr-15 2,428 518 112 155 Apr-18 3,513 427 139 164
May-15 2,481 413 152 139 May-18 3,518 472 138 160
Jun-15 2,539 452 133 124 Jun-18 3,505 400 109 117
Average 2,169 403 126 135 Average 3,409 440 109 117
Jul-15 2,568 438 130 144 [1] Hurricane Irma.
Aug-15 2,546 410 126 128
Sep-15 2,619 465 136 139
Oct-15 2,726 511 128 108
Nov-15 2,792 396 104 109 Despite recent increases in velocity, Figure 5
Dec-15 2,747 346 126 100
shows the impact that the continued flow of
Jan-16 2,859 536 90 84
Feb-16 2,976 528 83 123 new listings is having on the resale market in
Mar-16 2,980 431 111 121 greater downtown Miami.
Apr-16 3,045 469 95 110
May-16 3,041 412 88 136
Jun-16 3,057 454 120 100
Average 2,830 450 111 117 Source: Trendgraphix, compiled by Integra Realty Resources, Inc.
13 | Integra Realty ResourcesResale Condominium Pricing T he average listings per month column (Figure 5) shows the persistently high average asking inventory, and the peaks and valleys of the summer versus winter selling season. Notably, Hurricane Irma severely disrupted deal-flow in September, and disrupted the overall market for six months or longer. Despite a shortfall of 130 sales based on prior year norms, the market sales and pended listings is up YTD over 2017. The listing inventory is not likely to start declining until the balance of the condo construction pipeline delivers, gets relisted, and the market has time to stabilize back to average listing inventory in the 2,800 units per month average. Admittedly, the listing per month also includes condos that are listed for sale or rent, so when rented, these listings come off the for-sale market even though they were not pended and sold. A good deal of this inventory build-up is not solely related to the state of the condo market as much as a weakening of the for-rent market which is exposing buildings to remain in the for-sale listing statistics longer. Unfortunately, the near-term outlook that residents will flock back to the condo rental market en masse represents a pretty strong bet against the quickly expanding conventional rental market. A detailed examination of rental market statistics indicates sufficient vacancy and new product deliveries that support the conclusion that resale listing inventory is not likely to decline anytime soon. The good news is, with very remote chances of major project failures and no significant overhang of developer-owned units following delivery, the private market for condominiums can likely withstand any major price volatility. The smart money is betting that average resale condo pricing may continue its gradual decline with an equilibrium point of $360+/- per SF. We are very near the inflection point without near-term signs of market distress. It’s hard to argue there could be any better time to buy as pricing edges down late cycle. 14 | Integra Realty Resources
Rental Market Statistics

IRR’s reporting in Summer 2016 and Summer 2017 provided in-depth analysis of the rental demand
 and pricing for both conventional rental properties and the shadow rental market comprised of condo
inventory available for lease. After decreasing in 2017, condominium rents recovered across most size
categories in 2018, although they remain below the 2016 high-water-mark of $2,677 per month.

The condo rental market in Figure 6 indicates that average rents are down $50-$100 per month from
the high of 2016. This is not such a dramatic shift in rental pricing. On a percentage basis (Figure 6a),
condo rental pricing by unit type, excluding 3-bedrooms, experienced a healthy 2%-3% growth in both
price per unit and price per SF. The three bedroom units at the top end of pricing ($4,500+ per month)
retreated on pricing -5.9% (price per SF); and -1.1% in relative monthly price.

Some of this retreat in rents in 2017 and rebound in early 2018 was a result of conventional projects in
lease-up coupled with condo inventory delivering, and coming to market for lease.

15 | Integra Realty Resources
Rental Market Statistics

Figure 6
Average Condo Leasing Price – Greater Downtown Miami
				                                    Studio 			                  1 BR 			                     2 BR 			               3 BR
Year 		          Overall       $/Unit         $/SF         $/Unit          $/SF         $/Unit         $/SF    $/Unit          $/SF
2012		           $2,255        $1,421         $2.64        $1,804         $2.33         $2,625         $2.13   $4,340          $2.25
2013		           $2,371        $1,504         $2.67        $1,926         $2.30         $2,819         $2.21   $4,427          $2.51
2014   [1]       $2,481        $1,632         $2.92        $2,008         $2.48         $2,908         $2.32   $4,346          $2.60
2015   [1]       $2,582        $1,698         $3.03        $2,139         $2.62         $3,008         $2.45   $4,773          $2.89
2016   [1]       $2,677        $1,683         $2.97        $2,165         $2.66         $3,009         $2.46   $4,675          $2.72
2017   [1]       $2,522        $1,628         $2.96        $2,008         $2.49         $2,942         $2.38   $4,573          $2.77
2018   [1]       $2,584        $1,661         $3.08        $2,083         $2.57         $2,944         $2.46   $4,521          $2.61
[1] Midyear.

Figure 6a
Average Condo Leasing Price – Year-over-Year Changes
				                                    Studio 			                  1 BR 			                     2 BR 			               3 BR
Year 		          Overall       $/Unit         $/SF         $/Unit          $/SF         $/Unit         $/SF    $/Unit          $/SF
2013		            5.1%          5.9%          1.4%          6.8%          -1.4%          7.4%          4.0%    2.0%            11.8%
2014		            4.6%          8.5%          9.4%          4.3%          7.5%           3.1%          4.8%    -1.8%           3.5%
2015		            4.1%          4.0%          3.6%          6.5%          5.8%           3.4%          5.7%    9.8%            11.1%
2016		           3.7% [2]       -0.9%         -2.0%         1.2%          1.5%           0.0%          0.4%    -2.0%           -6.0%
2017		           -5.8%          -3.3%         -0.3%         -7.3%         -6.4%         -2.2%         -3.3%    -2.2%           2.0%
2018		            2.5%          2.0%          4.1%          3.7%          3.1%           0.1%          3.4%    -1.1%           -5.9%
[2] Increase in overall prices reflects larger unit mix (including 4 and 5 bedrooms not reported in detail).

16 | Integra Realty Resources
Rental Market Statistics

W     hen looking at condominium rentals within the individual submarkets, we that most (except
      for A&E) are performing well; Brickell and Edgewater saw 6%-12% price increases with notable
increases in year-over-year volume. The CBD and Midtown experienced flat or slightly declining
average rents, but also with a large jump in volume of leases.

Figure 7
Condominium Rental Rates (YTD 2018)
                    Overall       Overall     Year-over-Year   Total # Leases/   Year-over-Year   # of Households
Submarket           Asking       Achieved      Price Change        Month         Volume Change       (2018 est.)
Brickell            $3,695        $2,677           6%                236              34%             19,053
CBD                 $2,887        $2,270           0%                101              44%              8,180
A&E                 $5,338        $3,213          -17%               10               -35%             8,188
Edgewater           $3,334        $2,716          12%                79               84%
Midtown             $2,738        $2,442           -3%               18               42%             7652 [1]
Wynwood             $2,700        $2,538
Conventional Apartment Rents
W ithin conventional rental communities, the picture is generally one of stability. Rent growth
remains below inflation for most property and price categories among class A- and B
communities, with studios and one-bedrooms reporting average rent declines.
In the conventional market, as property technology (#proptech) evolves, the use of daily pricing systems
for apartment projects is creating efficiency in market pricing to more finely tune rental rates based on
availability by unit type and other characteristics. During periods of high vacancy when projects are in
lease-up, these systems adjust pricing to solve for market pricing equilibrium. This partly explains the
2017 dip in conventional rental pricing. A review of the upcoming late 2018 deliveries could have a similar
affect on short-term rents heading into the fourth quarter of 2018.
Figure 8
Overall Downtown Conventional Rental Rate Survey (2,474 Total Units, Class A- and B)
$/Unit Studio 1 BR 2 BR 3 BR
Average SF $/Unit $/SF SF $/Unit $/SF SF $/Unit $/SF SF $/Unit $/SF
Q3 2014 $1,976 638 $1,585 $2.49 864 $1,605 $1.86 1221 $2,106 $1.73 1752 $2,622 $1.50
Q2 2015 $2,121 638 $1,856 $2.91 864 $1,774 $2.05 1221 $2,241 $1.84 1752 $2,707 $1.55
Q2 2016 $2,123 638 $1,937 $3.04 864 $1,772 $2.05 1221 $2,257 $1.85 1752 $2,652 $1.51
Q2 2017 $2,164 638 $1,906 $2.99 864 $1,831 $2.12 1221 $2,274 $1.86 1752 $2,751 $1.57
Q2 2018 $2,175 638 $1,867 $2.93 864 $1,823 $2.11 1221 $2,305 $1.89 1752 $2,752 $1.57
Q3 2014 -
Q2 2015 7.3% 17.1% 10.5% 6.4% 3.2%
% Change
Q2 2015 -
Q2 2016 0.1% 4.4% -0.1% 0.7% -2.0%
% Change
Q2 2016 -
Q2 2017 0.7% -1.6% 3.4% 0.7% 3.6%
% Change
Q2 2017 -
Q2 2018 0.5% -2.0% -0.5% 1.4% 0.0%
% Change
As shown in in Figure 8, the Class A-/B remained relatively steady despite the addition of new Class A
inventory and condo units available for lease. Studio and 1-Bedroom rents retreated modestly,
2 Bedroom average rents grew 1.4% year over year, and 3-Bedroom rents remained level.
18 | Integra Realty ResourcesConventional Apartment Rents
Figure 8a
Overall Downtown Conventional Rental Rate Survey (Class A, Sample Size Varies as Projects are Delivered)
Average # of Studio 1 BR 2 BR 3 BR
Rent Units SF $/Unit $/SF SF $/Unit $/SF SF $/Unit $/SF SF $/Unit $/SF
Q2 2018 $2,175 2,474 638 $1,867 $2.93 864 $1,823 $2.11 1,221 $2,305 $1.89 1,752 $2,752 $1.57
Class A- & B
Q2 2018 Class A $2,466 4,774 510 $1,873 $3.67 845 $2,164 $2.56 1,150 $2,796 $2.43 1,624 $3,916 $2.41
Q2 2017 Class A $2,360 2,349 516 $1,615 $3.13 775 $2,064 $2.66 1,095 $2,711 $2.48 1,437 $3,960 $2.76
Class A Premium
13.4% 25.3% 21.4% 28.8% 53.5%
(%) – PSF
YoY Change
4.5% 17.2% -3.9% -1.8% -12.5%
(% ) – PSF
Studio rents jumped 17.2% on a price per SF basis, one and two-bedroom rents retreated -3.9% and -1.8%
respectively. The largest decline in rents per SF was in the three-bedroom rents, although those units on
average jumped in average size nearly 200 SF as Panorama entered the rent survey results. The survey
uses a rolling sample as new units enter the market, so large swings in average unit size can overstate a
decline on a price per SF basis.
Overall average rents on a gross basis increased 4.5% on average year over year. However, average
weighted price per SF declined by 2.2%. Renters this year will be getting more size for their money.
Class A-/B three bedrooms are a bargain at the moment with an average $2,752 per month, with three
bedroom condo options averaging $4,421, and conventional Class A projects averaging $3,916 per month.
19 | Integra Realty ResourcesConventional Rental Market Supply F igure 9a illustrates the current status of Miami’s under construction rental pipeline. The past 12-months, the market has delivered over 2,400 units at Square Station, Solitair, Panorama, 2500 Biscayne, and Midtown 29. Another 1,600 units will deliver in the coming 6-9 months, likely forcing average rental rates to wobble during the lease-up of new deliveries, with a normalized uptick in rents by next Summer. Unlike the condo development market where debt constraints and/or the cost of capital slowed many developers, the market for capital (debt and equity) for new urban multi-family remains robust. Just about the only market indication holding back new multi-family development has been the 2017 rent wobble, and perhaps some discipline on the part of lenders to price risk based on future supply concerns. This story is playing out in many submarkets around South Florida, and in most major markets across the U.S. A housing shortage due to undersupplied single family development continues to provide tailwinds to multi-family housing demand. Large multi-family developers and institutional investors prefer not to build into a wall of new construction deliveries. At the same time, the window is closing for cheap(er) long-term capital, so the race has been on. By the end of 2018, that race in downtown Miami will have largely been won. IRR Miami predicts new construction will slow as new employment growth plateaus. Core population growth will still contribute to new demand, but the structural 7%-9% vacancy in the market is sufficient to absorb near-term (24 month) demand without significant new multi-family construction. Like condominium projects in 2017, next year will be a much harder year to justify new multi-family construction in downtown Miami. Every market could use a pause without a hard reset. As we head into late 2018, the conventional rental development market will have its thumb largely on pause. 20 | Integra Realty Resources
Conventional Rental Market Supply

Figure 9a
Greater Downtown Miami Rental Pipeline - Under Construction and Complete Projects
Submarket              Building                                          2018 Q2 Status                 # Units Completion Date
Arts & Entertainment Art Plaza                                            Under Construction               655            TBD
Brickell             MaiZon at Brickell                                   Under Construction               262         Q4 2019
CBD                  Muze Met Square                                      Under Construction               391         Q3 2018
CBD                  Park Line MiamiCentral                               Under Construction               816         Q4 2018
CBD                  X Miami (formerly Vice)                              Under Construction               464         Q3 2018
CBD                  Caoba (fka 7th St Promenade)                         Under Construction               444         Q3 2018
CBD                  7th Street Promenade Tower 2                         Under Construction               429            TBD
Edgewater            Biscayne 27                                          Under Construction               330         Q4 2019
Edgewater            Modera Edgewater                                     Under Construction               297            2019
Midtown              Midtown East Phase 1                                 Under Construction               500            TBD
Midtown              Midtown 6                                            Under Construction               447            TBD
Midtown              Midtown 8                                            Under Construction               387            TBD
Wynwood              Wynwood 25                                           Under Construction               289            TBD
Wynwood              The Bradley                                          Under Construction               175       2019-2020
Arts & Entertainment Melody                                               Complete                         500            2016
Arts & Entertainment Square Station                                       Complete                         710         Q2 2018
Brickell             Solitair Brickell (former Brickell Bayview Center) Complete                           438         Q1 2018
Brickell             Panorama                                             Complete                         821         Q2 2018
Brickell             SoMa                                                 Complete                         418            2015
Brickell             Broadstone at Brickell                               Complete                         372            2017
Brickell             Brickell View Terrace                                Complete                          76            2016
CBD                  Flagler on the River                                 Complete                         250            2014
CBD                  Monarc at Metropolitan 3                             Complete                         462            2015
Edgewater            2500 Biscayne                                        Complete                         156         Q2 2018
Midtown              Midtown 5                                            Complete                         400            2017
Midtown              Eve at the District                                  Complete                         197            2017
Midtown              Midtown 29                                           Complete                         309         Q1 2018
		                                                               Total # of Units Under Construction     5,886
		                                                              Total # of Units Completed YTD 2018      2,434
		                                                           Total # of Units Completed in 2016-2017     1,545
		                                                                Total # Units Completed 2014-2015      1,130
		                                                            Conventional Market Size/Rent Survey       2,474
		                                                                      Total # Units U/C or Proposed   24,110

21 | Integra Realty Resources
Conventional Rental Market Supply
Figure 9b
Greater Downtown Miami Rental Pipeline - Proposed Projects
Submarket Building                                 2018 Q2 Status              # Units
A&E       School Board                             Proposed                     1100
          Melody II                                Proposed                      630
          The Arts                                 Proposed                      550
          Miami Plaza                              Proposed                      425
          Omni Station                             Proposed                     TBD
          70-90 NE 17th St                         Proposed                      225
Brickell  One Brickell II                          Proposed                      500
          TBD Allen Morris/Related                 Proposed                     TBD
          1111 Brickell (Yacht Club Phase II)      Proposed                      897
          Brickell Fire Station                    Proposed                      196
          1430 Brickell (TBD)                      Proposed                     TBD
          Tobacco Road                             Proposed                     TBD
          El Eden Micro Units                      Proposed                      132
          Possible Redevelopment - 1809 Brickell   Proposed                     TBD
          Smart Brickell Rental                    Proposed                       89
CBD       Luma at Miami World Center               Proposed                      439
          Lynx Tower                               Proposed                      483
          Miami World Center Block E               Proposed                      418
          Miami River Village                      Proposed                     TBD
          Grand Station                            Proposed                      300
          Nexus Riverside                          Proposed                      462
          Nexus Riverside Central                  Proposed                      900
          54 West Flagler                          Proposed                      391
          225 SE 2nd St                            Proposed                     TBD
          M-Tower                                  Proposed                      440
          Miami Station Tower f/k/a Krystal        Proposed                      153
          200 NMA                                  Proposed                      328
          533 NE 2 Ave                             Proposed                      150
          One Bayfront Plaza (RENTAL)              Proposed                     1361
          400 Biscayne (RENTAL)                    Proposed                      690
          Potential Olympia Theater                Proposed                      300
          5 Plaza                                  Proposed                     TBD
          Macy’s Redevelopment                     Proposed                     TBD
          Knight Center Towers                     Proposed                     TBD
          2nd & 2nd                                Proposed                      637
Edgewater 1900 Biscayne                            Proposed                      429
          1836 Biscayne (Possible Condo)           Proposed                      352
          700 Edgewater                            Proposed                     TBD
          AR Edgewater                             Proposed                      171
          Quadro 3900 Biscayne                     Proposed                      198
          Ellipsis                                 Proposed                       34
          The Village                              Proposed                     TBD
          Miami 18                                 Proposed                     1400
          2000 Biscayne (Rental)                   Proposed                      393
          1775 Edgewater                           Proposed                      444
          2501 Biscayne                            Proposed                     TBD
          Modera Biscayne Bay                      Proposed                      296
          “25” (RENTAL)                            Proposed                       93
          Prince Choice Redevelopment              Proposed                     TBD
Midtown   Midtown East Phase 2                     Proposed                      212
          Midtown 7                                Proposed                      391
Wynwood   2801 NW 3rd Avenue                       Proposed                      264
          2110 N Miami Ave                         Proposed                      163
          Wynwood Plant                            Proposed                      306
          Westdale Wynwood                         Proposed                      202
          Wynwood Plant                            Proposed                      306
          Wynwood 26                               Proposed                      176
          222 Wynwood                              Proposed                       35
          2110 N Miami Ave                         Proposed                      163
		                                                 Total # of Units Proposed   18,224

22 | Integra Realty Resources
Condo Development Process Appendix
Proposed Reservations Contracts Under Completed
Construction
The proposed phase The reservations The contracts The Contracts stage The site This is the final
is the initial phase phase is the phase is when the is typically the improvements and stage of the
of the development second phase of initial proposition make-or-break stage vertical construction development
process; a conceptual the development and reservation of development have commenced. process; as the
plan for a new process; the of a completely as the project was At this stage of construction of the
building or project developer and undefined either well-received development, the units is completed,
is initiated by architectural/ development idea by buyers, investors, project has secured CO’s (Certificates
a developer or design team meets the actual and lenders, or sufficient pre-sales of Occupancy) are
property owner. produce additional contracting for sale it was not. If the with significant issued, and the
The developer may renderings and upon the receipt of developer has as a deposits and most closing of the unit
release a press floor plans; the further deposits. sufficient number likely a financing sales are finalized.
release or a news sales centers are The architectural of sale contracts, commitment.
story with an initial opened and the and construction buyer deposits, These projects will
rendering to gauge finishes, amenities, drawings are and a commitment enter the market
the interest in the and features of completed; the for financing, under a reasonably
project, but the the project are developer obtains the project’s definitive timeline
project size may disclosed. The government construction of 24-48 months,
change over time to developer files permitting and will most likely depending upon the
conform to market with the State of approvals. The commence. If the scale of the project
demand and/or as Florida to be able final unit floor project was not and surrounding
site due diligence to take reservations plans are defined well-received, either infrastructure
constrains the and deposits for as the reservations by a lack of pre-sales, requirements.
process. units during this are converted to or insufficient equity
stage. This begins sales contracts from initial investors
the pre-sale phase with additional or debt financing,
during which buyer deposits a project may be
reservations are upon filing of the scrapped, shelved, or
taken. Master Declaration significantly altered
of Condominium. in another future
Changes to these attempt (either later
documents are in the cycle or in the
costly, and therefore next one). Projects
the development which fail the
plan tends to Contracts stage may
be more static move all the way
following this phase. back to Proposed
during this process.
23 | Integra Realty ResourcesDisclaimer & Acknowledgment The information provided herein is for informational purposes. This publication does not render legal, accounting, appraisal, counseling, investment, or other professional advice. Should such services or other expert assistance be needed, it is recommended that the services of a competent person or firm, having access to the details of the situation, be employed. 24 | Integra Realty Resources
Images

Cover:     Photo used with permission by Miami DDA.
Page 2:    Photo credit: © 2015 IRR-Miami/Palm Beach.
Page 4:    Photo credit: © 2015 IRR-Miami/Palm Beach. Map courtesy Miami DDA.
Page 5:    Photo credit: © 2015 IRR-Miami/Palm Beach.
Page 10:   Brickell, artist’s rendering of Brickell CityCentre used by permission of Swire Properties Inc.
           CBD, photo courtesy Miami DDA.
           Arts and Entertainment, photo courtesy Miami DDA.
Page 11:   Edgewater, photo credit: © 2015 IRR-Miami/Palm Beach.
           Midtown, photo courtesy Miami DDA.
           Wynwood, photo credit: © 2014 IRR-Miami/Palm Beach.
           Overtown, by Ebyabe, Wikimedia Commons.
Page 12:   Photo credit: © 2015 IRR-Miami/Palm Beach.
Page 15:   Photo credit: © 2015 IRR-Miami/Palm Beach.
Page 18:   Photo credit: © 2015 IRR-Miami/Palm Beach.
Page 20:   Photo credit: © 2015 IRR-Miami/Palm Beach.

25 | Integra Realty Resources
You can also read