Traffic, transport and access - Western ...
←
→
Page content transcription
If your browser does not render page correctly, please read the page content below
15.         Traffic, transport and access
 The road network in the vicinity of the airport site is currently relatively uncongested, with only sections of Narellan Road and
 Camden Valley Way experiencing congested conditions in peak periods. While there is currently spare capacity on much of the
 network near the airport site, there is congestion on the broader strategic network including the M4 Motorway, M5 Motorway, M7
 Motorway and M31 Hume Highway.

 The construction of Stage 1 would generate an estimated 1,254 additional vehicle movements per day on the surrounding road
 network during the construction period. This includes 314 peak hour vehicle movements during the AM peak period. In the
 context of the broader Western Sydney region, this would not be considered a significant increase. A community awareness
 programme would be implemented during construction, to ensure that the local community and road users are kept informed
 about any construction activities and expected delays. A traffic and access management plan would also be implemented to
 ensure that construction traffic (including any oversize vehicles) is appropriately managed.

 The operation of Stage 1 is expected to result in approximately 41,858 vehicles entering and leaving the airport site each day by
 2030. With the introduction of the M12 Motorway, this additional traffic is not likely to significantly affect the operation of the
 surrounding road network but is expected to result in:

 •     a small increase in congestion at The Northern Road / M4 intersection; and

 •     a small increase in congestion on Mamre Road.

 Significant road improvement works are proposed as part of the Western Sydney Infrastructure Plan, in addition to those
 identified in the Broader Western Sydney Employment Area and South West Priority Growth Area. These are expected to
 provide sufficient capacity to cater for the forecast passenger and employee traffic demand associated with the proposed airport
 in 2030.

 The public transport, walking and cycling systems proposed by the NSW Government and local councils in the region would
 also have sufficient capacity to cater for the expected airport passenger and employee demand at the proposed airport. An
 assessment of the surface traffic impacts of the longer term development is presented in Chapter 35. It considers the possible
 extension of the South West Rail Link to the airport site in response to increasing demand.

15.1. Introduction
This chapter provides a review of the expected traffic and transport impacts associated with the
construction and operation of the proposed airport. The chapter draws on a comprehensive
Surface Transport and Access Study (included at Appendix I), summarising its main findings and
identifying mitigation measures to address potential impacts.
The assessment addresses the requirements of the Guidelines for the Content of a Draft
Environmental Impact Statement – Western Sydney Airport (EIS guidelines) issued by the
Commonwealth Department of the Environment. The EIS Guidelines include a requirement to
assess all relevant impacts including specific consideration of changes in traffic movements during
construction and operation (associated with both passenger movements and workers).

                           Western Sydney Airport – Environmental Impact Statement – Volume 2                                    209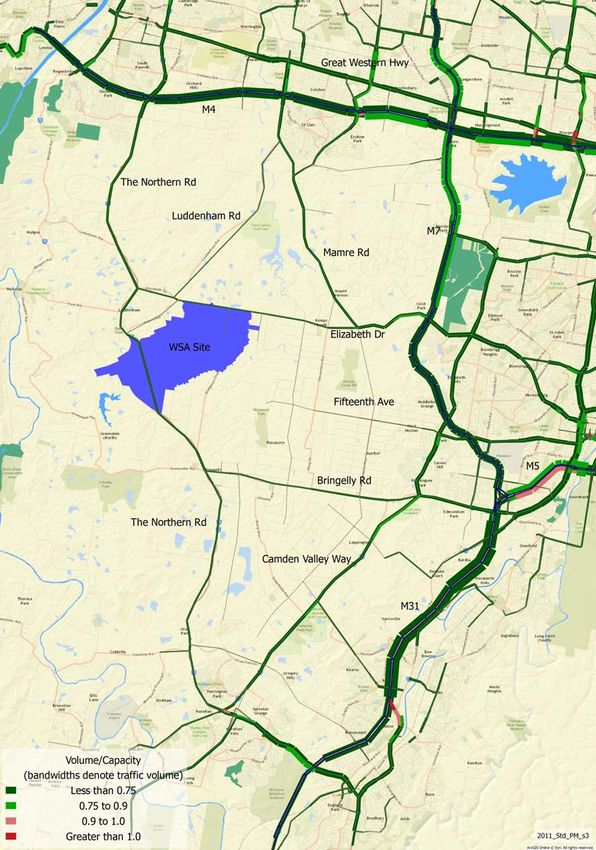
15.2. Methodology
15.2.1. Assessment approach
Assessment of the potential traffic, transport and access impacts has involved a consideration of
both the construction and operation of the proposed Stage 1 airport development.
For the construction phase, the assessment focuses on traffic impacts that would be associated
with the haulage of materials, plant and equipment, as well as the traffic generated by construction
workers. For the purpose of analysing the potential construction impacts, 2021 was selected as
representative of the peak construction year, during which the highest number of construction
vehicle movements are likely to be generated.
For the operation phase, the assessment focuses on the impact of the proposed airport, operating
at its intended capacity of 10 million annual passengers, operating at its intended capacity of 10
million annual passengers, on wider transport networks in the Western Sydney region. Two
modelling ‘scenarios’ were developed for the purpose of this assessment:
•   ‘Do minimum’ which represents the minimum transport network improvements required to
    maintain status quo, without consideration of the expected additional demand generated by
    the proposed airport; and
•   ‘With airport’ which includes consideration of the expected additional demand generated by
    the proposed airport.
The operational assessment involved:
•   determination of the trips expected to be generated by the proposed airport;
•   analysis of how those trips are likely to be distributed across the transport system;
•   assessment of the resulting impacts on the transport system; and
•   identification of appropriate mitigation measures to alleviate the impacts.
Assessment of the road traffic impacts of the long term development is included in Chapter 35
(Volume 3).

15.2.2. Transport modelling and analysis
15.2.2.1. Strategic Travel Model
The potential impacts of constructing and operating the proposed Stage 1 airport were assessed
using the Strategic Travel Model (Version 3). The Strategic Travel Model is a best practice tool,
operated by the NSW Bureau of Transport Statistics and is used for projecting travel patterns in
Sydney, Newcastle and Wollongong under different land use, transport and pricing scenarios. The
model is typically used to test alternative settlement, employment and transport policies, to identify
likely future capacity constraints, or to determine potential usage levels of proposed new transport
infrastructure or services. The Strategic Travel Model is programmed to model the years 2011,
2016, 2021, 2026, 2031 and 2036. The 2031 model year was therefore adopted for the
assessment of the potential impacts of the Stage 1 development.

210 Western Sydney Airport – Environmental Impact Statement – Volume 2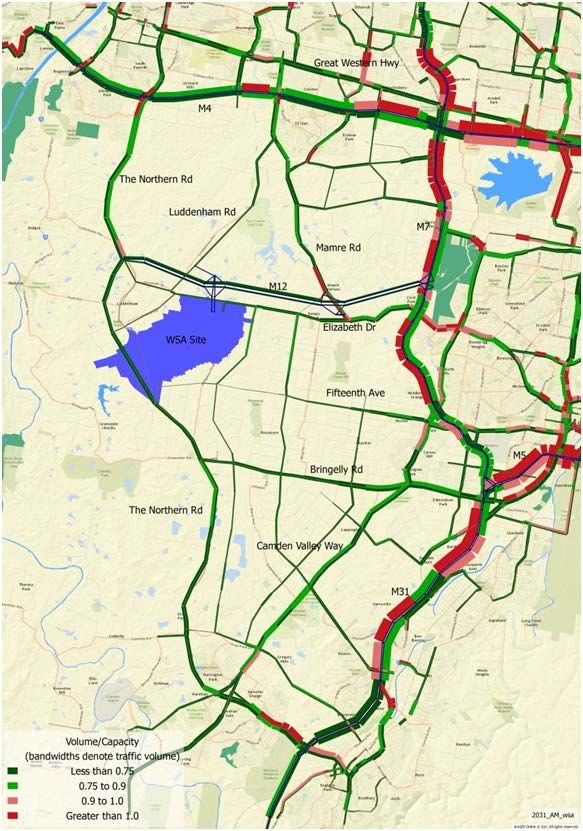
15.2.2.2. Modelling process
Transport modelling typically comprises four main stages:
1.   determination of trip generation, or travel frequency (how many trips would occur to and from a
     nominated travel zone with regard to the demographics and land uses of that zone);
2.   trip distribution (where these trips are likely to go);
3.   assignment of travel mode choice (car, bus, rail, ferry or a combination); and
4.   assignment of route (chosen for each trip and mode, and between each origin and
     destination). This stage provides the detail for the number of vehicles on each road and people
     on each public transport service.
For the purposes of this assessment the following adjustments to the model were necessary:
•    removal of trips destined for airport travel zones in the Strategic Travel Model. This allows
     assessment of a scenario that does not include the proposed airport (the ‘do minimum’
     scenario), which can then be used to identify the specific impact of the proposed airport in
     addition to other development forecasts for Western Sydney;
•    changes to the number of trips to and from the airport site for cars, light goods, rigid and
     articulated vehicles. This represents construction traffic in 2021 and Stage 1 operational traffic
     in 2031;
•    inclusion of additional road infrastructure in the form of the proposed M12 Motorway and
     associated connections. This project is currently in the planning phase. The proposed
     motorway is expected to run generally parallel to Elizabeth Drive and provide direct motorway-
     grade access to the proposed airport. The project and any associated environmental
     assessment and approval requirements are the responsibility of NSW Roads and Maritime
     Services (Roads and Maritime). It is assumed that the proposed M12 would be operational
     when the proposed airport opens and it is therefore included in all ‘with airport’ model
     scenarios, but excluded from the ‘do minimum’ scenarios; and
•    inclusion of a railway extension from Leppington in the east, linking the airport with St Marys,
     to the north for the long term assessment scenario.
The proposed corridor for the Outer Sydney Orbital has not yet been defined and was not included
in the modelling undertaken for this assessment.
Following these model alterations, the revised travel demand was reassigned to the road network.
This was done for the AM peak (7:00 am to 9:00 am), the PM peak (3:00 pm to 6:00 pm), the
period between these peaks (9:00 am to 3:00 pm), and the evening period (6:00 pm to 7:00 am).
Only the AM peak and PM peak are reported here because these are the periods during which the
capacity of the road network is most constrained. The assignment occurred in two stages:
•    assignment of heavy vehicle demand; and
•    assignment of the car demand. This was divided into toll-paying trips and non-toll-paying trips
     on the motorway network.

                       Western Sydney Airport – Environmental Impact Statement – Volume 2            211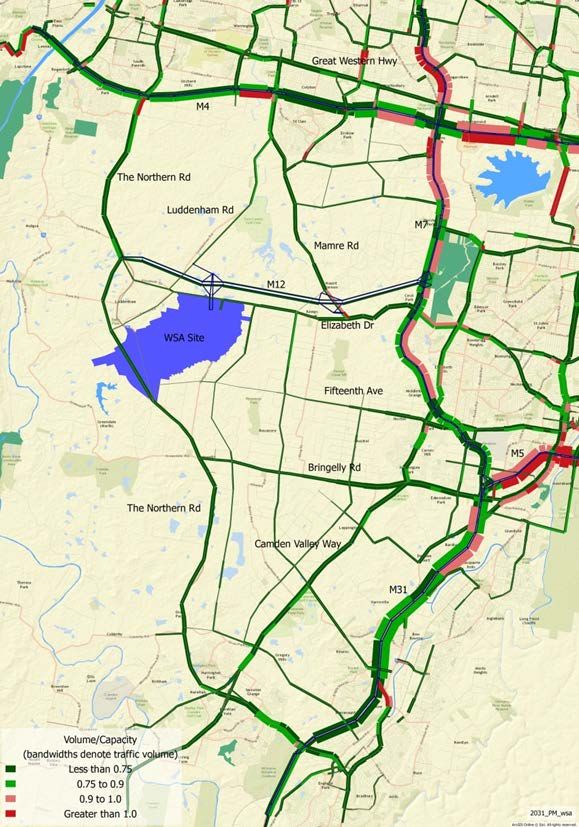
15.2.2.3. Trip generation and modelling assumptions
For the assessment of construction impacts, daily light vehicle numbers were estimated using the
assumption that 80 per cent of construction personnel would drive to and from the airport site on
any given day, and that the remainder would either use public transport or car-pooling. Heavy
vehicle volumes were estimated following an analysis of the indicative construction schedule
described in Section 6.2.1.
Trip generation and traffic generation associated with the operation of the proposed Stage 1 airport
were estimated using the Sydney Airport Land Transport Model. This model describes the types of
trips to Sydney Airport and is based on surveys completed in 2008.
The modelling process has also taken into account recent developments in airport operation, such
as self-check-in and notification of customers and security clearance times, which generally
allow people to arrive at the airport closer to their flight departure time and depart from the airport
more quickly.
It was also assumed that the main airport access road would be limited to three traffic lanes and
one bus lane in each direction. This would act as a capacity constraint over the longer term,
resulting in a shift away from cars towards public transport.

15.2.2.4. Assessment criteria
Assessment of the potential traffic, transport and access impacts has been undertaken with
reference to the Guide to Traffic Generating Developments (RTA 2002). This guideline suggests a
process and methodology for assessment which is familiar to NSW stakeholders and the
community. The operational traffic assessment process outlined in the guidelines stipulates
that the operating characteristics need to be compared with agreed performance criteria as
described below.
Midblock capacity
The capacity of urban roads is generally determined by the capacity of the intersections or the
‘mid-block’ capacity (the sections of roads between intersections). The mid-block capacities for
roads can be estimated and compared to the existing traffic volumes in terms of volume to
capacity ratios.
The volume/capacity ratio (VCR) is a measure of the amount of traffic carried by a section of road
compared to its nominal capacity. As VCR nears one, the speed on the link decreases and both
the likelihood and the duration of flow breakdowns increase.
The Austroads Guide to Traffic Management 2 outlines Level of Service (LoS) criteria for mid-block
sections of road based on the VCR. A summary of LoS criteria is presented in Table 15–1.

2
    Part 3: Traffic Studies and Analysis (2009)

212 Western Sydney Airport – Environmental Impact Statement – Volume 2
Table 15–1 – Level of Service descriptions for roads

 Level of       Uninterrupted flow facilities                  Uninterrupted flow facilities (arterial Volume/capacity
 Service        (motorways)                                    and collector roads)                    ratio
 (LoS)
 A              Free flow conditions in which individual       Primarily free flow operations at average travel           0.00 to 0.34
                drivers are unaffected by the presence of      speeds, usually about 90% of the free flow speed
                others in the traffic stream. Freedom to       (FFS) for the given street class. Vehicles are
                select desired speeds and to manoeuvre         completely unimpeded in their ability to manoeuvre
                within the traffic stream is extremely high,   within the traffic stream. Control delay at signalised
                and the general level of comfort and           intersections is minimal.
                convenience provided is excellent.

 B              Zone of stable flow and drivers still have     Reasonably unimpeded operations at average travel          0.35 to 0.50
                reasonable freedom to select their desired     speeds, usually about 70% of the FFS for the street
                speed and to manoeuvre within the traffic      class. The ability to manoeuvre within the traffic
                stream, although the general level of          stream is only slightly restricted and control delays at
                comfort and convenience is less than with      signalised intersections are not significant.
                LoS A.

 C              Also in the zone of stable flow, but most      Stable operations; however ability to manoeuvre and        0.51 to 0.74
                drivers are restricted to some extent in       change lanes in mid-block locations may be more
                their freedom to select their desired speed    restricted than at LoS B, and longer queues, adverse
                and to manoeuvre within the traffic stream.    signal coordination or both may contribute to lower
                The general level of comfort and               average travel speeds of about 50% of the FFS for
                convenience declines noticeably at this        the street class.
                level.

 D              Close to the limit of stable flow and is       A range in which small increases in flow may cause         0.75 to 0.89
                approaching unstable flow. All drivers are     substantial increases in delay and decreases in travel
                severely restricted in their freedom to        speed. LoS D may be due to adverse signal
                select their desired speed and to              progression, inappropriate signal timing, high
                manoeuvre within the traffic stream. The       volumes or a combination of these factors. Average
                general level of comfort and convenience       travel speeds are about 40% of FFS.
                is poor, and small increases in traffic flow
                will generally cause operational problems.

 E              Occurs when traffic volumes are at or          Characterised by significant delays and average            0.90 to 0.99
                close to capacity, and there is virtually no   travel speeds of 33% of the FFS or less. Such
                freedom to select desired speeds or to         operations are caused by a combination of adverse
                manoeuvre within the traffic stream. Flow      progression, high signal density, high volumes,
                is unstable and minor disturbances within      extensive delays at critical intersections and
                the traffic stream will cause breakdown.       inappropriate signal timing.

 F              In the zone of forced flow. With LoS F, the    Characterised by urban street flow at extremely low        1.0 or greater
                amount of traffic approaching the point        speeds, typically 25% to 33% of the FFS. Intersection
                under consideration exceeds that which         congestion is likely at critical signalised locations,
                can pass it. Flow breakdown occurs and         with high delays, high volumes and extensive
                queuing and delays result.                     queuing.
Source: Adapted from Austroads Guide to Traffic Management – Part 3: Traffic Studies and Analysis.

                             Western Sydney Airport – Environmental Impact Statement – Volume 2                                            213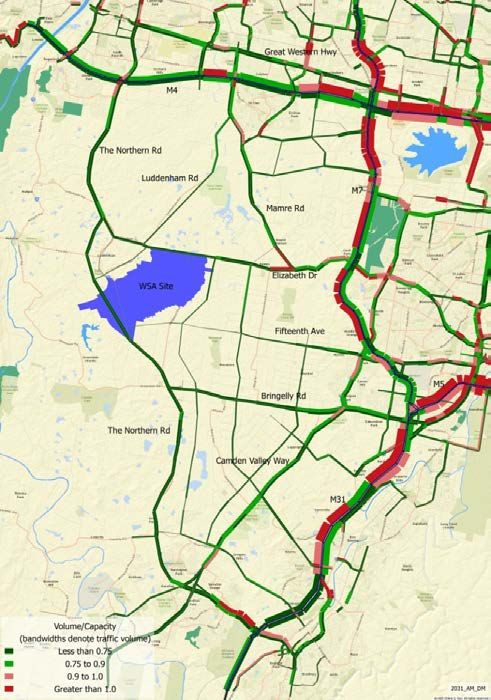
15.3. Existing environment
15.3.1. Existing road network
Roads and Maritime define four levels in a typical functional road hierarchy, ranging from high
mobility and low accessibility, to high accessibility and low mobility. These road classes are:
•     Arterial Roads – controlled by Roads and Maritime typically no limit in flow and designed to
      carry vehicles long distances between regional centres;
•     Sub-Arterial Roads – can be managed either by council or by Roads and Maritime under a
      joint agreement. Typically, their operating capacity ranges between 10,000 and 20,000
      vehicles per day, and their aim is to carry through-traffic between specific areas in a sub
      region, or provide connectivity from arterial road routes (regional links);
•     Collector Roads – provide connectivity between local sites and the arterial road network, and
      typically carry between 2,000 and 10,000 vehicles per day; and
•     Local Roads – provide direct access to properties and the collector road system and typically
      carry between 500 and 4,000 vehicles per day.
A description of the roads within and servicing the airport site, including their functional category is
provided in Table 15–1. The location of these roads and the broader land use context are shown in
Figure 15–1.
Table 15–2 – Existing roads servicing the airport site

 Road                        Functional       Description
                             category
 Westlink M7 Motorway        Arterial         The M7 Motorway connects Western Sydney with the broader road network and
                                              Sydney CBD by providing an uninterrupted journey between the M2, M4 and M5
                                              motorways. It is a fully electronic toll road with no toll booths that uses a distance
                                              based tolling system.
                                              In the vicinity of Elizabeth Drive, the M7 has two lanes in each direction separated
                                              by a grass median around 14 metres wide. The M7 provides for travel at variable
                                              speeds up to 100 kilometres per hour. An off-road shared cycle / pedestrian
                                              pathway traverses the motorway and connects with the Sydney Cycleway network.

 The Northern Road           Arterial         The Northern Road connects Narellan in the south west to the Great Western
                                              Highway in Penrith. In the vicinity of Luddenham, The Northern Road has an
                                              undivided carriageway with one lane in each direction and a sign posted speed limit
                                              of 80 kilometres per hour.

 Elizabeth Drive             Arterial         Elizabeth Drive connects The Northern Road at its western end, and the M7
                                              Motorway to the Hume Highway at Liverpool. Between The Northern Road and the
                                              Mamre Road roundabout, Elizabeth Drive has an undivided carriageway with one
                                              lane in each direction and a sign posted speed limit of 80 kilometres per hour.
                                              Elizabeth Drive between Mamre Road and the M7 has two eastbound lanes and
                                              one westbound lane. In the vicinity of Wallgrove Road, Elizabeth Drive carries
                                              around 26,000 vehicles per day.

 Bringelly Road              Collector        Bringelly Road connects to The Northern Road at Bringelly and to Camden Valley
                                              Way at Horningsea Park. Bringelly Road is around 10 kilometres in length and has

214 Western Sydney Airport – Environmental Impact Statement – Volume 2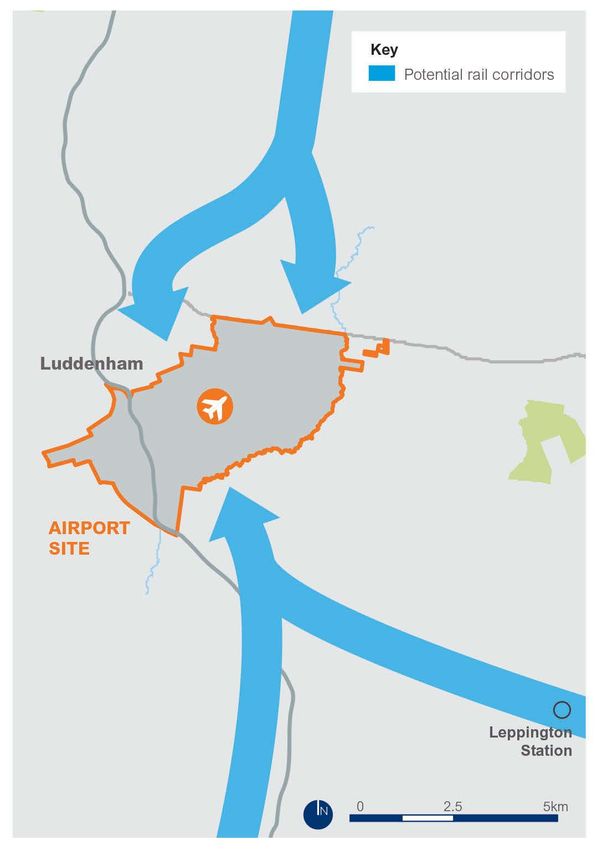
Road                                  Functional   Description
                                      category
                                                   an undivided carriageway with one lane in each direction, unsealed shoulders and a
                                                   sign posted speed limit of 80 kilometres per hour for the majority of its length.

Badgerys Creek Road                   Collector    Badgerys Creek Road connects The Northern Road at a roundabout to the north of
                                                   Bringelly to Elizabeth Drive, and is around seven kilometres in length. The
                                                   carriageway is undivided with one lane in each direction, unsealed shoulders and a
                                                   sign posted speed limit of 80 kilometres per hour.
                                                   The on-site component of Badgerys Creek Road was compulsorily acquired by the
                                                   Australian Government.

Adams Road                            Collector    Adams Road connects The Northern Road at Luddenham to Elizabeth Drive. The
                                                   carriageway is undivided with one lane in each direction and a sign posted speed
                                                   limit of 70 kilometres per hour.

Mamre Road                            Arterial     Mamre Road connects the Great Western Highway in St Marys to Elizabeth Drive.
                                                   Mamre Road has an undivided carriageway with one lane in each direction and has
                                                   a sign posted speed limit of 80 kilometres per hour.

Local roads within the airport site   Local        The following local roads are located within the airport site: Ferndale Road; Fuller
                                                   Street; Gardiner Road; Jackson Road; Jagelman Road; Leggo Street; Longleys
                                                   Road; Pitt Street; Taylors Road; Vicar Park Lane; and Winston Close.
                                                   These roads were compulsorily acquired, in part or in full, by the Australian
                                                   Government in July 1991 and are currently maintained by Liverpool City Council
                                                   under an agreement with the Australian Government.

Existing land use in the vicinity of the proposed airport is shown in Figure 15–1. The areas
surrounding the airport site are mostly rural properties with a few residential areas adjacent to The
Northern Road and Park Road intersection and further south of The Northern Road.

                                Western Sydney Airport – Environmental Impact Statement – Volume 2                                        215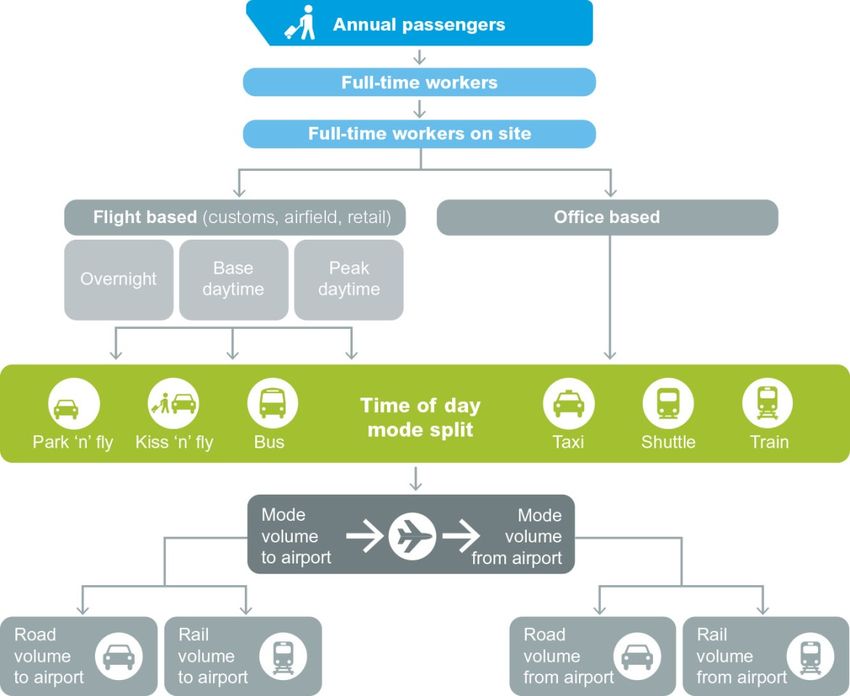
AD
DE
O G RE
R AT W
A
LEVY ST R JAM IS O H O BAR
NUE
REET N R O AD ES T T S TR E
PAR
E ER N
IV ET
OA D
R HIG
H WA
LE AVE
Y
NAY
FR
AD
AN
YO R K R
AD
RO
CI
LE O
E RO MA XWE C AR SR
LL S TR E E PEN OA
CARLI S
ES
T C AD D E TE R
RO
NS ROA D ES S TR D
D
PA G
BO R EE T
BR U C
CASTLE
PE
R O AD OUG
KENT ROAD
H RO
RR
SH E AD
OTO R WAY PH E
AD
ERN M RD S
OA
WE S T TR E
MAM R E R O
ET
D
HO ME S
TE A D R
O AD
E R O AD
BA
NK
AD
SD
O
RI R
FERRERS ROAD
VE K
R
V
PA
WALLG R O
E
IN
SK
R
E
MU
LGOA R D
G S HILL ROAD
KIN
OA
D LI TTL
T R OA E FIE
LI GH LD
FA IR S RO
AD
AD
RO
M
HA
EN
M7
DD
LI NK
LU
W ES T
PA RK R ELI ZABE
O AD TH DRIV
E
AD
SI LVERDA LE RO AD
O
SR
AM
RO AD
AD
W E IR
COW PASTUR E R O A D
OA D
AD
ROA D
O
NR
SHIRE R
VE
HA
BE N
RO A D
GE
RID
MA RSH
TS B
K
TAYLOR D EVO N
S C R EE
ASIN RO
AD
FIF TEE
SR
NTH AVENUE
WILSON RO
OAD
AD
BAD G ERY
RO
AD
EN U E
ER
Y
DW
DSO N AV
G STREET
LE R O A D
GR EEN DA
ED M O N
KIN
BRING EL
LY RO AD
BAR R Y
R N R O AD
AVENU
[KBM: 91]
E
O R TH E
N:\AU\Sydney\Projects \21\24265\GIS\Maps\Deliverables\KBMNEWTEMPLATE.mxd
AY
W
TH E N
Y
LE
DE
L
CU
VA
EP
TH
EN
WE
FI
RO
MD
EL
I LL
M
D
B A
DS
CA
O
RO
AY R
IR
RA
RO
W ON
OA
D
AD
BY
A
H S
IG M
D
ST
H A
RO
E LLI
AN
M I
AD
OA D
W
HU
EDR
ORA
EW
ER
E DRIV
S
AN G
N
RO
A
P
COBBITTY ROAD RK AD
AD
SPIT FIR
SR
D RI
VE RO
TO
BO B
N
MI
LEGEND Data Source: Please refer to "Digital Data Sources" on the second page of the EIS
Airport site B6, Enterprise Corridor IN1, General Industrial R4, High Density Residential RU4, Rural Small Holdings
B1, Neighbourhood Centre Deferred Matter IN2, Light Industrial R5, Large Lot Residential RU5, Village
B2, Local Centre E1, National Parks and Nature IN3, Heavy Industrial RE1, Public Recreation SP1, Special Activities
Reserves
B3, Commercial Core R1, General Residential RE2, Private Recreation SP2, Infrastructure
E2, Environmental Conservation
B4, Mixed Use R2, Low Density Residential RU1, Primary Production SP3, Tourist
E3, Environmental Management
B5, Business Development R3, Medium Density Residential RU2, Rural Landscape W1, Natural Waterways
E4, Environmental Living
W2, Recreational Waterways
0 0.75 1.5 3
Figure 15.1 - Road network and land use Kilome tre s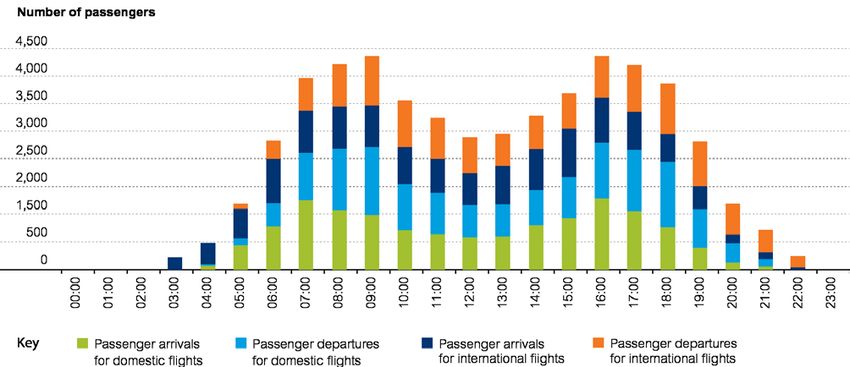
15.3.2. Traffic volumes and profile
Daily traffic volumes recorded for roads within the vicinity of the proposed airport are provided in
Table 15–3. Data presented are for 2005 (the last year these counters were in operation) and
represent a combination of vehicle counts and axle pair counts. An axle pair is the equivalent of a
passenger car (passenger car unit) with two axles and is a standard method of determining the
volume of traffic passing a counting location. A correction factor is applied to the axle spacing to
determine a volume for heavy vehicles.
Table 15–3 – Average annual daily traffic 2005

Location                                        Average annual daily traffic       Count type
The Northern Road north of Bringelly Road       16,944                             Vehicle

The Northern Road north of Elizabeth Drive      16,654                             Vehicle

Elizabeth Drive east of The Northern Road       7,311                              Axle pairs

Mamre Road south of Erskine Park Road           13,793                             Vehicle

Bringelly Road west of Camden Valley Way        8,900                              Axle pairs

Bringelly Road east of The Northern Road        6,212                              Axle pairs

Roads and Maritime have permanent counting stations on Elizabeth Drive at Cecil Hills and
Bonnyrigg. Recent results from these counters and the percentage growth per annum are
presented in Table 15–4.
Table 15–4 – Elizabeth Drive traffic volumes and growth rate

Location         Direction         2008      2008          2014           2014               % growth per
                                             combined                     combined           annum
                                                                                             compounding
Elizabeth        Westbound         10.927    22,523        12,923         26,598             2.8%
Drive at Cecil
                 Eastbound         11,596                  13,675
Hills

Elizabeth        Westbound         16,726    35,600        17,989         38,121             1.2%
Drive at
                 Eastbound         18,874                  20,132
Bonnyrigg

Table 15–5 provides a summary of the 2015 traffic counts undertaken by Roads and Maritime for
The Northern Road and Bringelly Road.

                             Western Sydney Airport – Environmental Impact Statement – Volume 2             217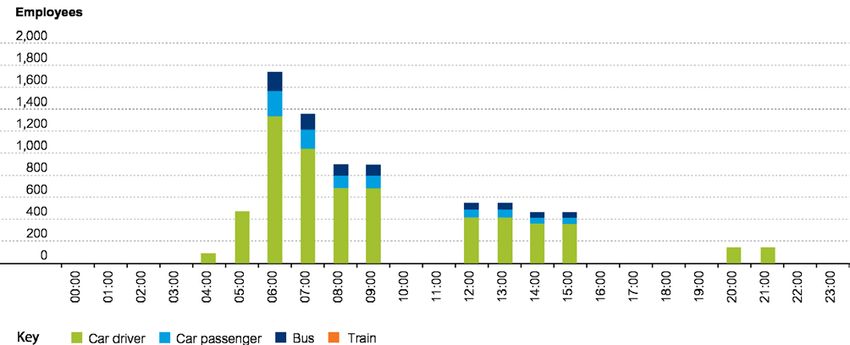
Table 15–5 – Existing daily traffic volumes 2015
Location Vehicles per day Vehicles per day Vehicles per day
(weekday) (weekend) (7 day average)
The Northern Road north of Bringelly Road 16,916 12,286 15,593
The Northern Road south of Bringelly Road 14,745 11,100 13,704
Bringelly Road east of The Northern Road 6,462 4,908 6,018
15.3.3. Existing road network performance
The Sydney Strategic Travel Model provides a mechanism for assessing the impact of land use
and transport infrastructure changes. In order to provide an understanding of the current transport
system, the 2011 base year model has been analysed to provide an insight into the prevailing peak
period performance in the area surrounding the proposed airport site. No changes were made to
the 2011 model for this analysis.
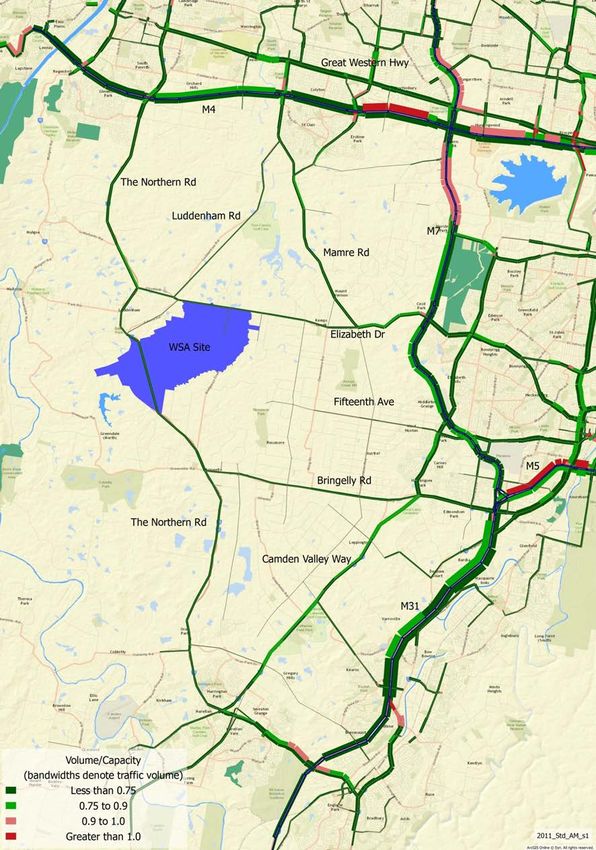
Modelling indicates that the road network in the vicinity of the airport site is currently relatively
uncongested (2011 base model), with only sections of Narellan Road and Camden Valley Way
showing a level of service (LoS) of D or worse in either the AM or PM peak periods.
While there has been development in the area since 2011, including the Broader Western Sydney
Employment Area and the South West Priority Growth Area, there remains spare capacity on
much of the network near the airport site. Figure 15–2 and Figure 15–3 show the existing (2011)
network conditions.
While roads near the airport site are relatively unconstrained, there are constraints on the broader
strategic motorway network for the 2011 scenario. For the AM peak, the model shows capacity
constraints on the following components of the network:
• M4 Motorway:
LoS F eastbound to the west of the M7; and
LoS E eastbound to the east of the M7;
• M7 Motorway:
LoS E in both directions south of the M4; and
LoS E southbound to the north of the M4;
• M5 Motorway:
LoS F eastbound, east of the M7; and
• Narellan Road:
LoS E southeast-bound towards the M31 Hume Motorway.
218 Western Sydney Airport – Environmental Impact Statement – Volume 2In the PM peak, capacity constraints are generally less acute, but the model still shows constraint
for the following motorway locations:
• M5 Motorway:
LoS E, westbound, east of the M7.
• M4 Motorway:
LoS D, westbound along much of the length of the M4; and
• M7 Motorway:
LoS D in both directions, particularly close to the M4 intersection.
Western Sydney Airport – Environmental Impact Statement – Volume 2 219Note: Volume/capacity ratio bandwidth definitions are outlined in Table 15–1 Figure 15–2 – 2011 AM peak volume/capacity − existing conditions 220 Western Sydney Airport – Environmental Impact Statement – Volume 2
Note: Volume/capacity ratio bandwidth definitions are outlined in Table 15–1
Figure 15–3 – 2011 PM peak volume/capacity – existing conditions

                             Western Sydney Airport – Environmental Impact Statement – Volume 2   221
15.3.4. Road safety and crash history
Roads and Maritime crash data were available for the major roads in the vicinity of the proposed
airport. The data are summarised in Table 15–6. Crash rates are generally consistent with the
traffic volumes carried by these roads.
Table 15–6 – Crash data for key roads near the airport site
Location Period Crashes % resulting in
injury (fatality)
The Northern Road – between Maxwell Street and Mersey Street January 2009 to December 2013 304 43% (1%)
The Northern Road – between Badgerys Creek Road and Mersey July 2009 to June 2014 16 38% (6%)
Street
Bringelly Road – between The Northern Road and Camden Valley July 2009 to June 2014 113 54% (2%)
Way
Elizabeth Drive – between The Northern Road and M7 Motorway July 2009 to June 2014 157 48% (1%)
Mamre Road – between Elizabeth Drive and M4 Motorway July 2009 to June 2014 159 50% (1%)
Badgerys Creek Road – between Elizabeth Drive and The July 2009 to June 2014 24 9% (0%)
Northern Road
Adams Road – between Elizabeth Drive and The Northern Road. July 2009 to June 2014 6 67% (0%)
15.3.5. Public transport
There are currently four bus routes that traverse the airport site and/or service the
immediate surrounds:
• Route 789 Penrith Interchange to Luddenham;
• Route 801 Liverpool Interchange to Badgerys Creek Road;
• Route 855 Austral to Liverpool via Prestons and Churchill Gardens; and
• Route 856 Bringelly to Liverpool via Prestons and Churchill Gardens.
The following train interchanges are closest to the airport site:
• T1 Western Line – Penrith Interchange;
• T2 Inner West and South Line – Liverpool Interchange; and
• South West Rail Link – Leppington.
Penrith and Leppington railway stations are around 15 kilometres from the site and Liverpool is
around 21 kilometres from the site.
222 Western Sydney Airport – Environmental Impact Statement – Volume 215.3.6. Pedestrians and cyclists
Pedestrian and cycling infrastructure in the area is currently limited, reflecting the predominantly
rural character of the area.
As the South West Priority Growth Area lands develop, additional cycleway links will be provided
and integrated within the Liverpool cycleway network. By 2018, the expected Bringelly Road Stage
1 and Stage 2 upgrades described in the Western Sydney Infrastructure Plan will deliver more than
10 kilometres of shared pedestrian and cyclist paths between Leppington and The Northern Road.
According to the Western Sydney Infrastructure Plan, The Northern Road is expected to have
shared pedestrian and cyclist paths between Narellan and the M4 Motorway by 2019.
15.4. Assessment of impacts during construction
15.4.1. Construction traffic volumes and distribution
Construction vehicles would access the site via Elizabeth Drive, Anton Road, The Northern Road
and Badgerys Creek Road. Construction vehicle generation would be expected to reach its peak in
2021. Table 15–7 provides the expected traffic volumes by period and vehicle type.
Table 15–7 – Peak construction vehicle generation
Vehicles Direction AM peak Inter-peak PM peak Evening Total (vtpd)
Light vehicles In 264 88 0 88 440
Out 0 66 220 154 440
Semi-trailers In 4 11 5 2 22
Out 4 11 5 2 22
B-Double and Truck and Dog In 21 63 31 50 165
Out 21 63 31 50 165
Total 314 302 292 346 1,254
The following vehicle distribution assumptions were made for the purposes of assessment:
• the majority of light vehicles would arrive and depart the site between 5.00 am and 7.00
pm; and
• heavy vehicles would operate to and from the site 24 hours per day during aviation
infrastructure works.
The geographic distribution of light vehicles was assumed to be consistent with existing vehicle
movements in this area derived from the existing 2021 Strategic Travel Model.
Detailed information on a probable distribution for heavy vehicles was not available; however the
following assumptions are considered reasonable:
• 50 per cent of trips to and from the M31 Hume Motorway;
• 20 per cent of trips to and from the M5;
Western Sydney Airport – Environmental Impact Statement – Volume 2 223• 10 per cent of trips to and from the M4 (east);
• 10 per cent of trips to and from the M4 (west); and
• 10 per cent of trips to and from the M7 (north).
15.4.2. Effect on road network performance
The expected distribution and volume of construction traffic discussed in Section 15.4.1 suggests
there would be approximately 160 additional vehicle movements (to and from the airport site) on
Elizabeth Drive during the AM peak and 150 additional vehicle movements (to and from the airport
site) on Elizabeth Drive during the PM peak.
Modelling indicates that this level of additional traffic volume would not result in operating
conditions worse than LoS C on Elizabeth Drive in the vicinity of the airport site.
There would be capacity constraints on the wider network, principally on the M4, M5 and M7
motorways; however:
• these constraints currently exist;
• the LoS does not deteriorate when construction traffic is included; and
• the proportion of construction traffic compared to overall traffic, reduces with distance from the
airport site and therefore the impact of construction is reduced with distance from the site.
The types of vehicle movements associated with the construction of the proposed airport would not
significantly impact on the surrounding transport system, with the exception of potential oversized
vehicle movements required for the delivery of equipment. These movements may require
temporary road closures or suitable escorts.
15.5. Assessment of impacts during operation
To assess the potential transport network impacts of the proposed Stage 1 airport operation,
consideration was given to the travel demand associated with passengers, employees and freight.
The expected trip generation for each of these groups is considered in Section 15.5.1,
Section 15.5.2 and Section 15.5.3 respectively. The consequential transport network impacts are
discussed in Section 15.5.6. Road infrastructure providing access to the proposed airport is
described in Chapter 5 (Section 5.9).
The assessment has not considered traffic associated with future commercial development. While
the proposed airport includes authorisation for future non-aeronautical commercial development,
the details of such development would be developed by the ALC and would be subject to
authorisation under the Airports Act.
224 Western Sydney Airport – Environmental Impact Statement – Volume 215.5.1. Future transport network
15.5.1.1. Road network
As part of the Western Sydney Infrastructure Plan the Commonwealth and New South Wales
governments have committed $3.6 billion over 10 years in major road infrastructure upgrades in
Western Sydney. These upgrades would relieve pressure on existing infrastructure and provide
connectivity to the new airport and surrounding areas before the proposed airport begins operation.
The key projects which comprise the Western Sydney Infrastructure Plan are listed in Table 15–8.
Table 15–8 – Key Western Sydney Infrastructure Plan projects
Initiative Description
The Northern Road Upgrade to a minimum of four lanes from Narellan to the M4 Motorway.
M12 Motorway Construction of a new four-lane motorway between the M7 Motorway and The Northern Road.
Bringelly Road Upgrade to a minimum of four lanes from Camden Valley Way to The Northern Road.
Werrington Arterial Construction of the Werrington Arterial by upgrading Kent Road and Gipps Street to four lanes
between the Great Western Highway and the M4 Motorway.
Ross Street, Glenbrook Upgrade of the intersection of Ross Street and the Great Western Highway to reduce congestion.
Local roads $200 million package for local roads upgrades.
15.5.1.2. Public transport network
There are three additional bus routes identified by Transport for NSW to services the proposed
airport. These routes are:
• Liverpool-Badgerys Creek-Penrith (suburban);
• Campbelltown-Oran Park-Badgerys Creek (suburban); and
• Leppington-Badgerys Creek-Mt Druitt (local).
The service frequencies would be determined based on the demand for travel to the
proposed airport.
15.5.1.3. Rail
While no rail connection to the proposed airport is currently expected until after 2031, planning for
the proposed airport preserves flexibility for several possible rail alignments including a potential
express service. Potential rail corridors are shown by Figure 15–4. A final alignment would be
determined in consultation with the New South Wales Government and some enabling work may
be required during Stage 1 to future-proof the corridor.
Western Sydney Airport – Environmental Impact Statement – Volume 2 225Figure 15–4 – Potential future rail corridors 226 Western Sydney Airport – Environmental Impact Statement – Volume 2
15.5.2. Passenger trip generation
In 2031, it is estimated that the proposed airport would be handling up to 10 million passengers per
year. In order to understand the transport impact these passenger movements may have, they
need to be translated into ‘trips’ and assigned to the surrounding road network using the Strategic
Transport Model. This process is illustrated in Figure 15–5.
While this figure shows rail as a mode of transport, the proposed Stage 1 development does not
currently include a rail service. Planning for the proposed airport preserves flexibility for several
possible rail alignments including a potential express service. A final alignment will be determined
in consultation with the New South Wales Government.

Figure 15–5 – Process for determining passenger trip generation

                       Western Sydney Airport – Environmental Impact Statement – Volume 2         227
15.5.2.1. Flight movements
A passenger flight profile for Stage 1 was developed based on the number of daily and peak hour
passenger flights. The profile for 2031 is shown in Figure 15–6.
Figure 15–6 – Flight arrivals/departures profile 2031
In 2031 a total of 170 passenger flights per day would be expected, of which 149 flights are
assumed to be domestic and 21 international. During the peak hour, anticipated to be between 7
am and 8 am, there is predicted to be 22 passenger flights, split evenly between arrivals and
departures (for both domestic and international sectors).
15.5.2.2. Passenger movements
For each domestic and international flight, a profile for the passengers entering and exiting the
airport was determined based on the Sydney Airport Land Transport Model, as explained
in Section 15.2.2. The following assumptions were made for the purposes of calculating
passenger volumes:
• for each domestic aircraft, an average capacity of 180 passengers with an average flight
occupancy of 90 percent; and
• for each international aircraft, an average capacity of 420 passengers with an average flight
occupancy of 90 percent.
228 Western Sydney Airport – Environmental Impact Statement – Volume 2Using the passenger profile and the above assumptions, a passenger arrival/departure profile was
developed in order to determine the associated demand for ground transport services. The
resulting profile is illustrated in Figure 15–7.
Figure 15–7 – 2031 Ground transport demand per hour (2031)
15.5.2.3. Transport mode split
The Sydney Airport Land Transport Model (and its assumed mode split) was used to assign the
calculated ground transport demand to the modes listed in Table 15–9.
Table 15–9 – 2031 assumed mode split
Mode 2031 assumed mode split
Domestic International
Drop-off Pick-up Drop-off Pick-up
Kiss and fly 30% 30% 40% 40%
Park and fly 35% 35% 30% 30%
Taxi 20% 20% 20% 20%
Shuttles 5% 5% 5% 5%
Bus 10% 10% 5% 5%
Rail was not considered because no rail connection to the proposed airport is currently expected
until after 2031. Walking and cycling to the airport (as passengers) was assumed to be minimal.
Suitable dwell times for each mode were then applied (with, for example, longer times assumed for
international kiss and fly passengers when compared to their domestic counterparts).
Western Sydney Airport – Environmental Impact Statement – Volume 2 229Figure 15–8 shows the number of expected passenger arrivals via ground transport at the proposed airport. Figure 15–9 shows the total departures expected via ground transport from the proposed airport. Figure 15–8 – Total passenger arrivals at the proposed airport via ground transport Figure 15–9 – Total passenger departures from the proposed airport via ground transport 15.5.2.4. Traffic generation The trips (by mode) shown in Figure 15–8 and Figure 15–9 were assigned to vehicles entering and exiting the airport site to determine the passenger related traffic generation (excluding vehicle movements that only circulate internally within the airport site, such as some taxi movements). 230 Western Sydney Airport – Environmental Impact Statement – Volume 2
Figure 15–10 shows that in 2031, 1,359 vehicles would be expected to enter the airport site during
the AM peak period and 1,425 vehicles would be expected to enter the airport site during the PM
peak period.
Figure 15–11 shows that in 2031, 1,453 vehicles would be expected to leave the airport during the
AM peak and 1,388 would be expected to leave the airport during the PM peak.

Figure 15–10 – Passenger vehicles entering the proposed airport site

Figure 15–11 – Passenger vehicles leaving the proposed airport site

15.5.3. Employee trips
Airfield, terminal and airside employment estimates are directly related to the volume of
passengers expected to pass through the proposed airport. A ratio of 750 workers per one million
annual passengers has been used as a reasonable basis on which to estimate the number of full
time employees at the airport.

                       Western Sydney Airport – Environmental Impact Statement – Volume 2      231
In order to determine the expected number of trips generated by these employees; they were allocated into shifts across the proposed 24-hour operation of the airport and then assigned to a transport mode. Figure 15–12 illustrates the process. Figure 15–12 – Employee trip generation 15.5.3.1. Employees and shifts Up to 7,600 employees would likely be required to service the proposed airport in 2031. Consistent with the experiences at Sydney Airport and other international airports, it was assumed that up 80 per cent of employees (6,158) would be on-site during Stage 1 on any given day. The airport employees were categorised as follows: • airfield operations (three shifts of 8.5 hours); • terminal support (two shifts of 7 hours plus two split-shifts of four hours); and • office workers (two shifts of nine hours, offset by one hour). 232 Western Sydney Airport – Environmental Impact Statement – Volume 2
15.5.3.2. Employee arrival and departure profiles
A profile for employee arrivals and departures prior to and after their shifts was developed and is
shown in Figure 15–13. The profile acknowledges that some employees would arrive in the hour
before their shift starts and/or leave in the hour after their shift finishes.

Figure 15–13 – Employee arrival and departure profile (2031)

Figure 15–13 shows that the peak arrival for the AM peak period is expected to be around 1,386
employees and the PM peak departure for employees (between 7.00 pm and 8.00 pm) is
1,086 employees.

15.5.3.3. Mode split
The employee mode split has been determined using the Sydney Airport overall mode splits for
journey to work, but reassigning the 11 per cent of trips taken by train (to Sydney Airport) to car
based modes for the proposed airport. This recognises that the proposed airport is not expected to
have a railway line until after 2031.
Additionally, it was assumed that no employees would use public transport during early morning
hours due to service limitations.

                        Western Sydney Airport – Environmental Impact Statement – Volume 2        233
Figure 15–14 and Figure 15–15 show the expected distribution of arrivals and departures. It can be seen that the AM arrival volume for employees is expected to be 1,345 employees during the AM traffic peak hour (7.00 am to 8.00 am), with the majority arriving by car. The departure volume for employees is predicted to be greater than 1,300 during the PM traffic peak hour. Figure 15–14 – Employee arrivals by mode and time of day Figure 15–15 – Employee departures by mode and time of day 234 Western Sydney Airport – Environmental Impact Statement – Volume 2
15.5.3.4. Traffic generation
The calculated employee arrivals and departures were assigned to vehicles to determine the
number of vehicles entering and leaving the airport site throughout the 24-hour operational period.
The results are shown in Figure 15–16 for arrivals and Figure 15–17 for departures. Employee
traffic generation peaks would be expected to be outside the main traffic peak periods of 7−9 am
and 4−6 pm.

Figure 15–16 – Employee vehicle arrivals by mode (2031)

Figure 15–17 – Employee vehicle departures by mode (2031)

                       Western Sydney Airport – Environmental Impact Statement – Volume 2       235
15.5.4. Freight trips
Freight demand has been identified for air freight cargo and for the delivery of aviation fuel to the
fuel farm. Demand estimates for airport consumables (e.g. food, retail items) or waste removal
cannot be calculated before a detailed terminal plan is developed and have therefore been
excluded from the assessment.
The freight demand for air cargo is estimated to be 190,793 tonnes in 2031. It has been assumed
that the cargo freight arrives at and departs from the airport on heavy rigid trucks, semi-trailers and
B-doubles. Table 15–10 gives the estimated heavy vehicle volumes (and car equivalents).
Table 15–10 – 2031 two-way truck movements
Vehicle type 2031 annual 2031 daily 2031 hourly 2031 car equivalents
movements movements movements per hour
Heavy Rigid Truck 53,051 152 6 13
(12.5 metres long)
Semi-Trailer 6,376 17 1 2
(19 metres long)
B-Double 1,822 10.59 0 1
(23 -26 metres long)
15.5.4.1. Fuel deliveries
Assuming a fuel supply pipeline is not available to service the proposed airport, it has been
estimated that in 2031 approximately 43 B-doubles of fuel per day would be required to meet
Stage 1 fuel use requirements. This would be equivalent to about two B-doubles per hour, or 35
passenger car units (pcus) per hour on average entering and leaving the airport site.
15.5.5. Total airport traffic generation estimate
A total airport trip generation estimate has been calculated using the totals for passengers,
employees and freight provided in the previous sections. Table 15–11 presents the results divided
into representative two-hour periods, with a 24-hour total.
Table 15–11 – Total modelled traffic to / from the proposed airport in 2031
AM peak Interpeak PM peak Evening 24 hour
2 hour 2 hour 2 hour 2 hour
Arriving at airport
Passengers 2,582 1,862 2,518 1,276 15,774
Airport workers 1,375 498 190 573 4,871
Freight (TNR) 9 26 13 57 277
Total (arriving) 3,966 2,386 2,721 1,905 20,922
236 Western Sydney Airport – Environmental Impact Statement – Volume 2AM peak Interpeak PM peak Evening 24 hour
2 hour 2 hour 2 hour 2 hour
Departing from Airport
Passengers 2,286 1,983 2,312 1,357 15,774
Airport workers 0 411 1,027 704 4,885
Freight (TNR) 9 26 13 57 277
Total (departing) 2,295 2,420 3,353 2,117 20,936
15.5.6. Effect on network performance
As noted in Section 15.5.4, operation of the proposed Stage 1 development is expected to result in
20,992 vehicles accessing the site and 20,936 vehicles leaving the site each day. This would
increase traffic on nearby north−south routes in the area including The Northern Road. At the
same time, the opening of the M12 Motorway would attract traffic from the M4 corridor, Elizabeth
Drive, Bringelly Road and Fifteenth Avenue, reducing the volumes on these east−west routes.
There are two drivers of the changes in volumes. Firstly, the proposed airport would introduce
more trips on the network in this area. Secondly the M12, which would provide primary access to
the airport, would have a diversionary effect on traffic movements in the wider area, attracting
vehicles to the M12 corridor that would otherwise have used Elizabeth Drive, Bringelly Road or the
M4 Motorway. This would have the effect of:
• reducing volumes on the M4;
• reducing volumes on Bringelly Road and Elizabeth Drive; and
• increasing volumes on The Northern Road.
Table 15–12, Figure 15–18 and Figure 15–19 show the 2031 network conditions for the ‘do
minimum and ‘with airport’ assessment scenarios, for the respective AM and PM peak periods.
The following specific network effects would be expected:
• improved LoS on Elizabeth Drive as a result of the diversion of trips on to the M12;
• a deterioration in LoS on The Northern Road:
to LoS D on sections of The Northern Road between the M12 and M4 (AM/PM peaks);
to LoS E just north of Elizabeth Drive (AM peak); and
to LoS F just south of the M4 (AM/PM peaks);
• increase in LoS on sections of Mamre Road near the M12;
• reduction in LoS on Mamre Road north of Erskine Park Road; and
• the M12 motorway maintains a LoS no worse than B.
Western Sydney Airport – Environmental Impact Statement – Volume 2 237Having regard to the proposed road developments in the vicinity of the airport site, by 2031 it is predicted that the proposed airport would not generate the level of traffic required to significantly impact the operation of the surrounding road network. 15.5.7. Public transport, walking and cycling The public transport, walking and cycling networks proposed by the NSW Government and local councils are expected to have sufficient capacity to cater to the expected airport passenger and employee demand. Bus routes 789 and 801 currently traverse the airport site and would therefore need to be appropriately altered in consultation with the bus operator and Transport for NSW. 15.5.8. Access Ground transport infrastructure to service the proposed airport is discussed in Section 5.9 (Chapter 5 in Volume 1). Local traffic originating in Bringelly which currently travels north to Elizabeth Drive via Badgerys Creek Road would no longer be able to do so. A high standard alternative route (via The Northern Road and the proposed M12 Motorway) is expected to be available to service this traffic. 238 Western Sydney Airport – Environmental Impact Statement – Volume 2
Table 15–12 – Level of Service for 2031 with and without the proposed airport

Id            Road                     Location                                   Without the airport                           With the airport
                                                                       AM Peak              PM Peak               AM Peak                PM Peak
                                                                       Nbd/Ebd    Sbd/Wbd   Nbd/Ebd     Sbd/Wbd   Nbd/Ebd   Sbd/Wbd      Nbd/Ebd   Sbd/Wbd
1             The Northern Road        North of Elizabeth Drive        C          D         C           C         C         E            D         C

2             The Northern Road        South of M4                     F          C         D           F         F         D            D         F

3             The Northern Road        South of Bringelly Road         C          B         B           C         D         B            B         C

4             M4                       West of Mamre Road              F          D         D           F         F         D            D         F

5             M4                       West of M7                      F          D         D           E         F         D            D         E

6             M7                       South of M4                     F          F         F           E         F         F            F         E

7             M7                       South of Elizabeth Drive        F          D         D           D         F         D            D         E

8             M5                       East of M7                      F          E         E           F         F         E            E         F

9             M31                      South of Campbelltown Road      F          E         D           E         F         E            D         E

10            Narellan Road            North of Tramway Drive          D          F         D           D         D         F            D         D

11            Bringelly Road           West of Cowpasture Road         D          C         C           C         D         C            C         C

12            Cowpasture Road          At M7                           F          E         D           F         F         E            D         F

13            Elizabeth Drive          East of M7                      D          F         D           C         E         F            E         D

14            Elizabeth Drive          West of M7                      E          D         C           D         D         C            C         C

15            Elizabeth Drive          West of Mamre Road              F          B         B           D         C         B            B         C

16            Elizabeth Drive          East of the Northern Road       C          A         A           B         A         A            A         A

17            Mamre Road               North of Elizabeth Drive        F          C         C           F         F         E            D         F

18            Mamre Road               South of M4                     D          F         E           D         D         F            E         D

                                                                                 Western Sydney Airport – Environmental Impact Statement – Volume 2          239
Id Road Location Without the airport With the airport
AM Peak PM Peak AM Peak PM Peak
Nbd/Ebd Sbd/Wbd Nbd/Ebd Sbd/Wbd Nbd/Ebd Sbd/Wbd Nbd/Ebd Sbd/Wbd
19 Luddenham Drive West of Mamre Road D C C C C C C D
20 Lawson Road South of Elizabeth Drive C A A C D A A C
21 Western Road South of Elizabeth Drive D A B C D B B D
22 Fifteenth Avenue West of Cowpasture Road C A A C C A A C
23 M12 West of M7 - - - - A A A A
24 M12 West of Mamre Road - - - - B A A A
25 M12 East of the Northern Road - - - - B A A B
Note: Improvements are indicated in green bold. Deteriorations are indicated in red bold.
240 Western Sydney Airport – Environmental Impact Statement – Volume 2Note: Volume/capacity ratio bandwidth definitions are outlined in Table 15–1
Figure 15–18 – AM peak Volume/Capacity − Do minimum (left), with proposed airport (right)(2031)
Western Sydney Airport – Environmental Impact Statement – Volume 2 241Note: Volume/capacity ratio bandwidth definitions are outlined in Table 15–1 Figure 15–19 – PM peak volume/capacity − Do minimum (left), with proposed airport (right) (2031) 242 Western Sydney Airport – Environmental Impact Statement – Volume 2
15.6. Mitigation and management measures
Table 15–13 outlines the broad mitigation and management measures that are proposed to
address the expected traffic and transport effects associated with the proposed Stage
1 development.
Table 15–13 – Mitigation and management measures – surface traffic and access

 ID     Issue               Mitigation/management measure                                                                          Timing
15.1 Construction related A community awareness programme would be implemented prior to construction commencing and Pre-Construction
     traffic and transport would continue throughout the entire construction period. The programme would aim to make road
     impacts               users (including local residents) aware of construction traffic and safety issues, such as diversions,
                           temporary road closures, traffic signalling and speed limits.

15.2 Construction related A traffic and access management plan would be developed prior to construction of the proposed            Pre-Construction
     traffic and transport airport as part of the construction environmental management framework. The plan would collate
     impacts               measures to mitigate and manage potential traffic impacts. The plan would consider the following
                           elements:
                            •    management for the temporary and permanent closures of roads within the airport site;
                            •    a community engagement strategy;
                            •    ongoing consultation with Roads and Maritime, local councils as appropriate and emergency
                                 services;
                            •    induction for drivers working on the project to cover safety measures particularly for night
                                 works;
                            •    review of speed environments along transport corridors;
                            •    restriction of construction related traffic within the AM and PM peak periods where required;
                            •    management of the transportation of construction materials to optimise vehicle loads in
                                 order to minimise vehicle movements;
                            •    traffic control measures to manage and regulate traffic movements during construction;
                            •    identification of potential disruption to road users;
                            •    identification of any road closures and/or road upgrades that may be required;
                            •    construction vehicle routes, including the use of arterial roads, haulage routes, access to the
                                 airport site and procedures for oversize and heavy vehicles; and
                            •    parking facilities for construction workers.
                           The plan would be developed in consultation with relevant stakeholders prior to the
                           commencement of construction.
                           The plan would provide the overall plan and staging for managing traffic through and around each
                           work site. This would be in accordance with the Roads and Maritime’s Road Design Guide, the
                           Roads and Maritime Services Traffic Control at Work Sites manual and AS1742.3 Manual of
                           Uniform Traffic Control Devices – Traffic control for works on roads, and any other relevant
                           standard, guide or manual. The draft plan would be reviewed by relevant stakeholders including
                           NSW Police, Transport for NSW, Road and Maritime Services and affected local councils.

                                Western Sydney Airport – Environmental Impact Statement – Volume 2                                             243
ID Issue Mitigation/management measure Timing
15.3 Operational traffic A ground transport plan would be prepared as part of the detailed design of Stage 1 and before the Pre-operations
and transport proposed airport begins operating. The plan would address:
impacts • road design speeds;
• security issues;
• traffic loads from airport and other developments on site;
• connections with off-site/external roads, including matching capacity, speeds and road
geometry;
• forecast traffic flows, including public transport requirements;
• car parking;
• commercial and operational vehicles and storage;
• terminal interface;
• passenger pick-up and drop-off by private and commercial vehicles;
• pedestrian linkages between terminals and all transport drop-off/pick-up areas;
• pedestrian, cycle or road networks for movement around the Airport Site;
• use of dedicated busways;
• ability to continue to provide access to and from the Airport when key intersections are
unavailable; and
• the ability to expand, with minimal disruption, to meet future airport and business
development requirements.
244 Western Sydney Airport – Environmental Impact Statement – Volume 2You can also read