FS Italiane Group Investor Presentation - October 2019
←
→
Page content transcription
If your browser does not render page correctly, please read the page content below
FS Italiane Group
                  Investor Presentation

October 2019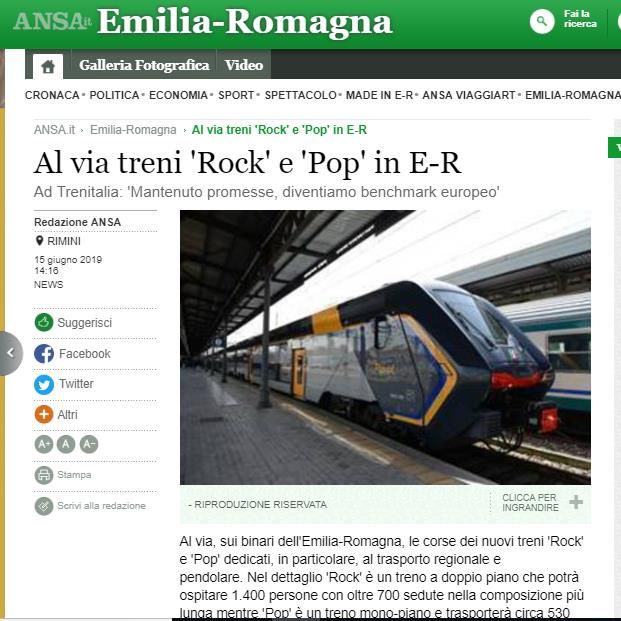
INDICE
                                                   CONTENTS
1   Ferrovie dello Stato Italiane Group Overview
2   Operations and Industry Overview
3   Corporate Sustainability
4   Sustainable Finance – Green Bond Programme
5   Financial Overview
6   Contacts

                                                               2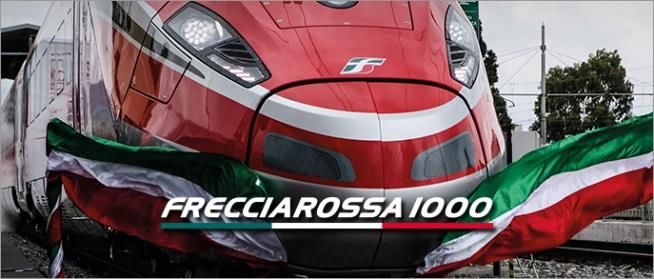
Disclaimer
IMPORTANT NOTICE – STRICTLY CONFIDENTIAL

By accessing this investor presentation, you agree to be bound by the following limitations.

 This presentation has been prepared by Ferrovie dello Stato Italiane S.p.A, is the sole responsibility of Ferrovie dello Stato Italiane S.p.A.. The information set out herein may be subject to updating, revision, verification and
amendment and such information may change materially. Ferrovie dello Stato Italiane S.p.A. is under no obligation to update or keep current the information contained in this presentation or in the presentation to which it relates and
any opinions expressed in them is subject to change without notice. None of Ferrovie dello Stato Italiane S.p.A. or any of its respective affiliates, advisers or representatives shall have any liability whatsoever (in negligence or
otherwise) for any loss whatsoever arising from any use of this presentation or its contents, or otherwise arising in connection with this presentation.

 This presentation is being communicated in the United Kingdom only to persons who have professional experience in matters relating to investments falling within Article 19(5) of the Financial Services and Markets Act 2000 (Financial
Promotion) Order 2005 and to persons to whom it may otherwise be lawful to communicate it to (all such persons being referred to as relevant persons). This presentation is only directed at relevant persons and any investment or
investment activity to which the presentation relates is only available to relevant persons or will be engaged in only with relevant persons. Solicitations resulting from this presentation will only be responded to if the person concerned
is a relevant person. Other persons should not rely or act upon this presentation or any of its contents.

 The information in this presentation is confidential and this presentation is being made available to selected recipients only and solely for the information of such recipients. This presentation may not be reproduced, redistributed or
passed on to any other persons, in whole or in part. This presentation is for information purposes only and does not constitute or form part of, and should not be construed as, any offer for sale or subscription of, or solicitation of any
offer to buy or subscribe for, any securities of Ferrovie dello Stato Italiane S.p.A. nor should it or any part of it form the basis of, or be relied on in connection with, any contract or commitment whatsoever. This presentation does not
constitute a recommendation regarding the securities of Ferrovie dello Stato Italiane S.p.A.

This presentation and the information contained herein are not an offer of securities for sale in the United States and are not for publication or distribution to persons in the United States (within the meaning of Regulation S under the
United States Securities Act of 1933, as amended.

 This presentation is for distribution in Italy only to "qualified investors" (investitori qualificati), as defined pursuant to Article 100 of Legislative Decree no. 58 of 24 February 1998, as amended and restated from time to time (the
Financial Services Act), and as defined in Article 34-ter, paragraph 1(b) of CONSOB Regulation no. 11971 of 14 May 1999, as amended and restated from time to time (the CONSOB Regulation), or in other circumstances provided under
Article 100 of the Financial Services Act and Article 34-ter, CONSOB Regulation, where exemptions from the requirement to publish a prospectus pursuant to Article 94 of the Financial Services Act are provided.

 This presentation may contain projections and forward-looking statements. Any such forward-looking statements involve known and unknown risks, uncertainties and other factors which may cause Ferrovie dello Stato Italiane S.p.A.’s
actual results, performance or achievements to be materially different from any future results, performance or achievements expressed or implied by such forward-looking statements. Any such forward-looking statements will be
based on numerous assumptions regarding Ferrovie dello Stato Italiane S.p.A.’s present and future business strategies and the environment in which Ferrovie dello Stato Italiane S.p.A. will operate in the future. Furthermore, any
forward-looking statements will be based upon assumptions of future events which may not prove to be accurate. Any such forward-looking statements in this presentation will speak only as at the date of this presentation and
Ferrovie dello Stato Italiane S.p.A. assumes no obligation to update or provide any additional information in relation to such forward-looking statements.

                                                                                                                                                                                                                                                 3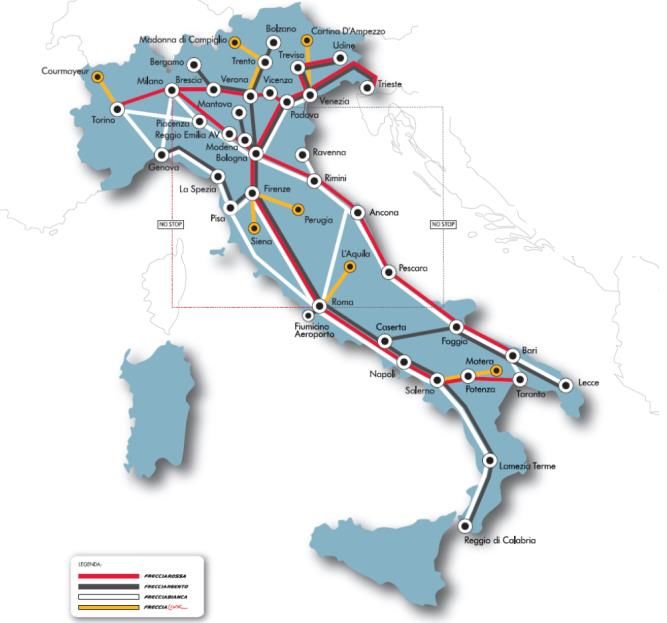
Ferrovie dello Stato Italiane
           Group Overview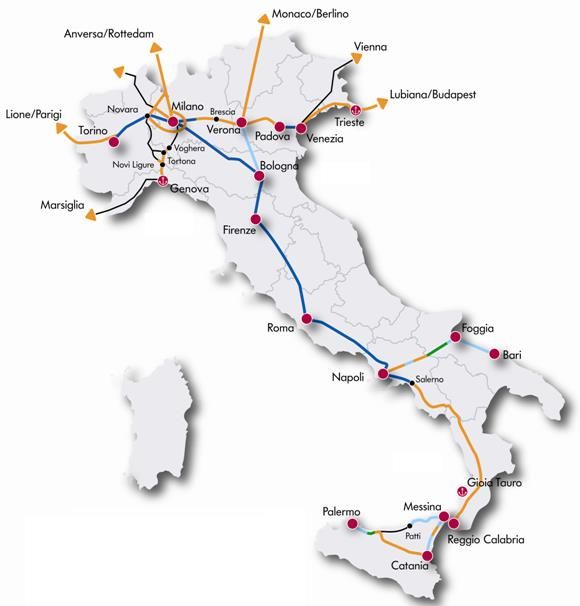
FS Group in a snapshot
Ferrovie dello Stato Italiane SpA (“FS” or the “Issuer”) – 100% Italian State owned – is the holding company of the Italian railway group
(FS Group). As one of the largest industrial groups in the country, it manages rail and road networks and transport services by rail and
bus both passenger and freight, contributing to develop integrated mobility and logistics in Italy and abroad.

                                                                100%

                                                                                Coordination and
                                                                               control of the whole
                                                                                industrial process

                                       INFRASTRUCTURE                         TRANSPORT SERVICES:             STATIONS AND REAL                        BUSINESS SUPPORT
     INFRASTRUCTURE                     OPERATION AND                                     Trenitalia                ESTATE:                                SERVICES:
        DESIGNING:                      MAINTENANCE:                                      Busitalia                  GS Rail                                Italcertifer
          Italferr                  Rete Ferroviaria Italiana                         Mercitalia                Centostazioni Rail                           Fercredit
                                             ANAS                                          others               FS Sistemi Urbani                            Ferservizi

                                        Group Revenue by segment (2018) **
                                                                                                               2018 Consolidated Highlights (€mn)
                                               Real Estate         Other services
                                                Services                                               Revenue                                 12,078**
                                                                        2%
                                                  1%                                                   EBITDA                                      2,476
                                                                                                       EBITDA Margin                              20.5%
                           Infrastructure                                                              EBIT                                          714
                                39%
                                                                              Transport                EBIT Margin                                  5.9%
                                                                                 58%                   Net Income                                    559
                                                                                                       Net Invested Capital                       48,418
                                                                                                       Equity                                     41,763
                                                                                                       Net Financial Debt                          6,655   Source: FS 2018 Annual Report
                                                                                                                                                           **Net of (1,645)m of cons.adj.   5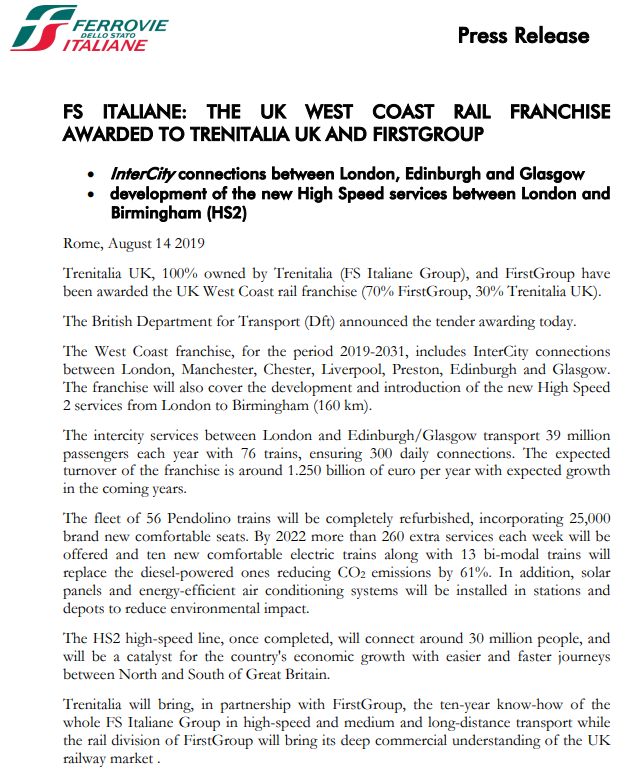
Benchmarking with European rail players

            (€b)                                        2016                     2017             2018               Issuer Rating
            Revenue                                        8.9                      9.3            12.1   Fitch               BBB

            EBITDA margin %                           25.7%                       25%            20.5%    S&P                 BBB

            EBIT margin %                                10%                     7.7%              5.9%

            (€b)                                        2016                     2017           2018                 Issuer Rating
            Revenue                                      43.3               45.6                47.1      Fitch                AA

            EBITDA margin %                           10.3%                9.9%                 9.5%      S&P                 AA-

            EBIT margin %                               3.4%               3.7%                 3.8%      Moody’s             Aa1

            (€b)*                                       2016                     2017           2018                Issuer Rating*
            Revenue                                      32.3               33.5                33.3      Fitch                A+

            EBITDA margin %                           12.8%               13.7%                 12%       S&P                 AA-

            EBIT margin %                               6.6%               7.9%                 6.7%      Moody’s             Aa3

                            * Results of SNCF Group; Rating of SNCF Mobilites
                            Source: FS, DB, SNCF Annual Reports and rating agencies’ websites                                        6
Rating Overview
                                                RATING                                                                                 COMMENTS

                                                                                        FS' rating reflects the:
                                                                                        • “very important” role for the Italian government as holding group of the country’s national railway and
                                Issuer                                                    the “integral” link with its sole owner (Italian Govt)
                                Rating            BBB
                                                                                        • “Strong” business risk profile: «…dominant market position in the Italian transport segment and network
                                                                 Outlook                  concessionaire…the vertical integration combines infrastructure manager and transportation services and
                                Stand                           NEGATIVE                  gives earnings operating stability»
                                Alone                                                   • “Intermediate” financial risk profile: «We expect FS will maintain funds from operations (FFO) to debt at
                                Credit           bbb+                                     22%-23% over the next few years»
                                Profile                                                 • «In our view, consolidation of Italian national road and motorways operator ANAS has not exposed FSI to
                                                                                          higher cash flow volatility risk, and we expect any potential acquisition of an equity stake in Alitalia will
                               SACP upgraded to                                           not materially affect FSI's credit metrics»
                               ‘bbb+’ from ‘bbb’ on                                     On September 30th 2019 S&P revised upward FS's stand-alone credit profile (SACP) to 'bbb+'
                                                                                        from 'bbb', «…reflecting our expectation that the company will continue to maintain solid financial
                               September 30th                                           metrics, supported by resilient business performance, public grants commensurate with the scale of
                                                                                        its investments, and a solid regulatory framework. »

                                                                                        FS' rating reflects the:
                                Issuer                                                  • Full ownership and high integration with the Italian government and its key role for railway
                                Rating             BBB                                    transport and mobility in Italy as well as the national infrastructural development
                                                                  Outlook
                                                                 NEGATIVE               • Revenue Defensibility: «…a dominant market share in passenger transportation services in
                                Stand                                                     Italy and growing operations in UK, Greece and Netherlands»
                                Alone              BBB                                  • Financial profile: «…Fitch expects FS to maintain strong operating cash flow generation
                                Rating
                                                                                          capacity»
                              Rating affirmed on 26th                                   • «The affirmation of the 'BBB' IDR reflects our expectations of net debt/EBITDA ratio hovering
                              September 2019                                              around 5x over the 2019-2023 amid resilient debt tolerance as envisaged by "mid-range"
                                                                                          attributes for both revenue defensibility and operating risk. »

       Source: S&P and Fitch reports. Please refer to the rating agencies’ websites for further information.
                                                                                                                                                                                                          7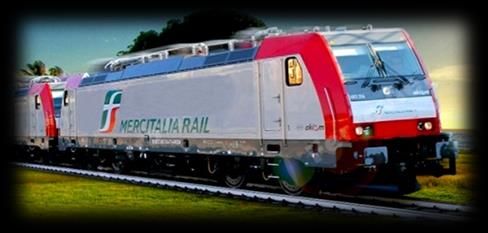
Key Operating Data
Long-haul transport - market Long-haul transport – Public Regional transport
services - “Frecce”
Trasporto Long Haul - Universale contribuito
Service Contract
2017 4.239
2018 4.491
2017 26.769
2018 31.683
Trasporto Long Haul - Mercato Trasporto Long Haul - Universale contribuito Trasporto Short Haul
2017 2017 23.614
16.643 2017 4.239
2018 23.911
2018 17.213 2018 4.491
2017
2017 26.769 2017 206.643
63.645
2018 66.479 2018 31.683 2018 209.221
TrasportoNetwork
Long Haul - Mercato Infrastructure Cargo transport
Road transport* 2017 16.643
2018 44,000 km 17.213
Railway network Road network
2017 63.645
2018 66.479
Trasporto merci*
Trasporto su gomma *
2017 2.333 10.967
2017
22.659
2018 2.429
16,781 km 10.143
26.000 km of roads and 2018
21.335
2017 153.332
2018 192.372
1,467 km HS tracks 1,300 km of highways Tonnellate Km - milioni
Tons Km total - million Tons Km abroad - million
Tonnellate Km di cui territorio estero- milioni
Passengers - km million Trains\Bus - km thousand
(*) passengers-km of road transport do not include Qbuzz traffic volume
Source: FS 2018 Annual Report 8
17.554
Operations and Industry
             Overview
                 Transport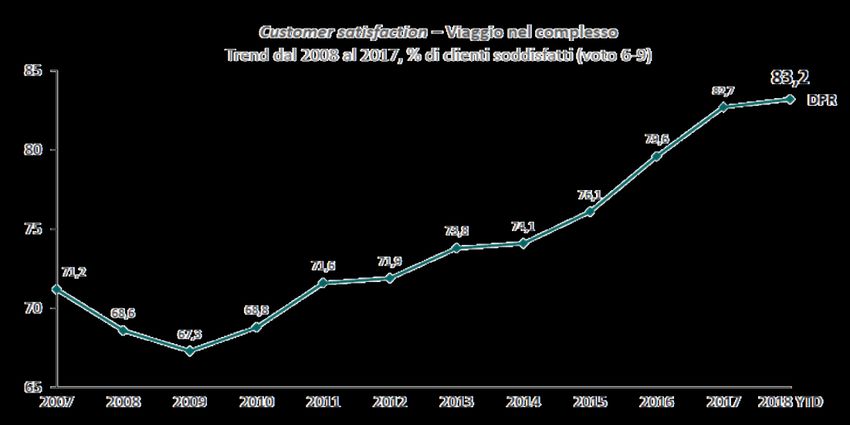
Trenitalia: rail passenger transport in Italy and abroad
Financial highlights
Key highlights
€mn 2017 2018
• Everyday manages about 9,000 trains and each year transports c. 600 million Revenues 5,318 5,368
passengers EBITDA 1,585 1,483
• Trenitalia is also abroad with c2c and the West Coast Partnership in UK, EBIT 399 389
Thello in France, Trainose in Greece and since 1st June 2019 it has the control
of Netinera Group active in Germany (previously directly owned by FS) Net Income 276 257
EBITDA Margin 29% 27.6%
EBIT Margin 7.5% 7.2%
Two business segment
INVESTMENTS 2018 € 798 million
16% revamping rolling stocks
18% new rolling stocks
Medium Long distance revenues (€mn) Regional revenues (€mn)
Commuter passenger 20% IT, technologies and plants
High Speed services 2017 2018 Change services 2017 2018 Change
International and regulated
domestic services
2,506 2,498 -0.3%
Regional/Inter-regional
services 2,769 2,835 +2.4% 46% rolling stocks maintenance
Source: Company information, Trenitalia 2018 Annual Report 10New franchise for Trenitalia UK
• West Coast Partnership
In August 2019 Trenitalia UK has been
awarded the UK West Coast rail franchise
in JV with FirstGroup
The award comes after the first Trenitalia approach to the UK rail
market started in 2017 with the acquisition of the South London-
Essex franchise operated by c2c
Expected turnover around GBP 1.25
billion for the period 2019-2031
Intercity services for 39 million passengers/year
between London and Edinburgh/Glasgow
Development of High Speed services between
London and Birmingham
Source: Company information, Trenitalia 2018 Annual Report 11Focus: High Speed Transport
Frecce network • The Medium\Long Haul Passenger Division ensures the national and international
passenger transportation, including High Speed services
• The Italian High Speed network connects the main metropolitan areas of the country
and it has been the key element for the modal shift from plane to rail in Italy
Milan – Rome route modal share
Highway Air Train
100%
80% 36% 36%
44% 49%
55% 57% 61% 63% 62% 64% 67% 69%
60%
40%
20%
0%
2007 2008 2009 2010 2011 2012 2013 2014 2015 2016 2017 2018
Launch of the ‘Frecce’ network
The ETR 1000, named “Frecciarossa 1000” is the new high-speed train
of Trenitalia, comfortable, safe and environmentally friendly, designed
to meet the most advanced techniques. Eligible Green
Able to travel on all European high-speed networks. Project
The fleet counts 50 ETR 1000 with the last delivered in January 2018
Part of fleet was funded via the first green bond issued by FS in
November 2017
12
Source: Company informationFocus: Regional Transport
Overview Trenitalia regional services portfolio as of today
• Offers urban, regional and interregional mobility 8ys* 2ys(b)
5ys
Longer PSCs
• Business with local administrations is regulated by 5+5ys Trenord 15ys enable more
different Public Service Contracts (‘PSCs’) 15ys** investments
15ys 22ys
• PSCs are subject to specific regulation in terms of
eligible costs and adequate capital investments 15ys(a) 8ys*
returns 15ys
Trenitalia has been renewing
Public Service Contracts with a
8ys*
• In 2018 revenues related to regional passenger much longer duration (15years) 15ys 8ys*
services equal € 2,835mn (+2.4% vs. 2017) with all 20 Italian regions 8ys* 15ys
8ys*
• In Emilia Romagna region, Trenitalia won in joint
venture with TPER (the local public transport 15ys
8ys
company) the tender for the transport operation (a)
for 22 years
9ys
* negotiation ongoing for new 15 years PSCs from 2019
** Turin Metropolitan, the rest of the regional services expected
to be assigned directly
(a) Extension from 8ys to 15ys approved by the Authority,
signing expected in November
(b) negotiation ongoing for a new 10 years PSC
13Focus: Regional Transport
Service Enhancement
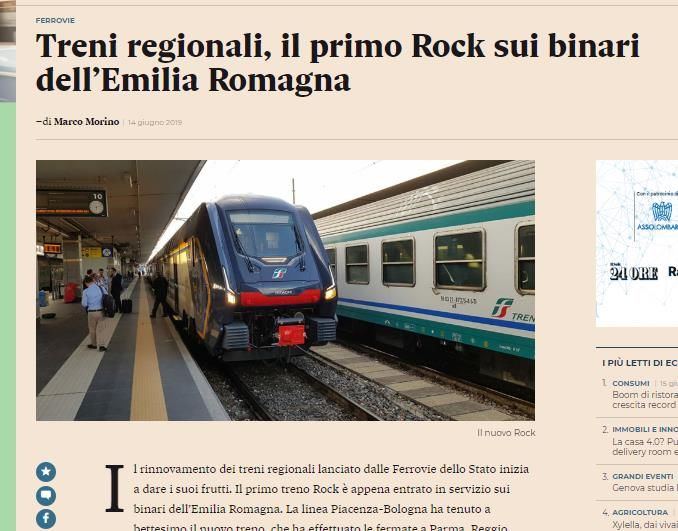
• The regional fleet will be upgraded in 2019-2023 by 216 new medium capacity (“Pop”) and 250 high-capacity (“Rock”) highly energy
efficient trains and 128 other trains
• Part of the first 86 Rock and Pop was funded via the first green bond issued by FS in November 2017
• First deliveries in Emilia Romagna region in 2019
Eligible Green
Project
These regional trains daily let commuters, students, tourists Overall Customer satisfaction
and workers travel throughout the country reached 84% (% satisfied
clients)
We are investing for the
regional transport
turnaround
Regional transport investments 2018 € 330 million
47% new rolling stocks
Source: Company information; Trenitalia 2018 Annual Report
14Regional transport - the turnaround is now
• 14 June 2019: inaugural trip of Rock and Pop trains on Piacenza –
Bologna and Rimini - Bologna routes in Emilia Romagna
• We aim at becoming a European benchmark in the Regional transport
as we already are in the High Speed
• Trenitalia will have the youngest fleet in Europe
Eligible Green
Project
Source: Company information; Trenitalia 2017 Annual Report
15Busitalia: road passenger transport in Italy and abroad
For an integrated mobility
Key highlights
Financial highlights
• Busitalia provides local bus transport, both urban and suburban, in Veneto, Tuscany, €mn 2017 2018
Umbria and Campania Revenues 472 624
• In August 2017 Busitalia acquired Qbuzz, the Dutch company which operates public bus EBITDA 43.1 55.3
transport services in the Netherlands EBITDA Margin 9.1% 8.8%
• In 2018 Qbuzz won public transport 8ys concessions in DNG and Groningen-Drenthe areas
• Busitalia also operates the replacement of rail services by bus including Freccialink
One of the country’s top players FLEET INVESTMENTS 2018 € 152 million
Production 700 624
110 mn Bus-Km 600 Revenues
CAGR +37% 472
500
400 330 354
Passengers 300
293
203
200 mn/year 200
111
100 69
0
€mn
2011 2012 2013 2014 2015 2016 2017 2018
Source: Company information; Busitalia Annual Reports 16Mercitalia: freight and logistic services
Integrated governance for the freight services
The new Mercitalia Hub, with Mercitalia Logistics as sub-holding has been created with the aim of restructuring the cargo business and rationalize the
freight operators active in the Group to improve quality and efficiency of cargo services provided
Increase and strengthen the presence in the intermodal transport segments
MERCITALIA HUB REVENUES
Develop operating synergies to increase competitiveness and market share
2017 2018
€ 1,042 € 1,018
mn mn
Investments 2018: 119 million mainly for fleet upgrading
New electric locomotives and wagons together with technology upgrades will Eligible Green
Project
enhanced the Group cargo fleet
17Operations and Industry
Overview
InfrastructureRFI: Railway Infrastructure Manager
Key figures High Speed Network Traditional network
€mn 2017 2018
Revenues 2,538 2,790
Track access charges 1,103 1,175
CdP-Service 976 1,004
ancillary traffic services 96 222
Real estate services 107 111
Other income 256 278
EBITDA 480 449
EBITDA margin % 18.8% 16%
EBIT 293 312
EBIT margin % 11.5% 11%
Net Income 262 274
TOTAL PRODUCTION 2018 Draft
Work In progress
364 million train-km +3% Operating (HS)
Operating (HS up to 250 km\h)
NETWORK HIGHLIGHTS 2018
INVESTMENTS 2018 € 4,769 million (+8%)
16,781 km network lenght Funded by the Contratto di Programma 2017-2021
23,035 km Traditional tracks 97% Traditional network 51% Maintenance and Safety
1,467 km HS tracks 3% High Speed network ~ +80% in 6 years
49% Network Development
Source: Company information; FS 2018 Annual report; RFI 2018 Annual report and RFI Website
19ANAS: road infrastructure
• ANAS is part of FS Group since January 2018, following the equity transfer from
the MEF.
• With ANAS, alongside RFI, FS group is now Europe’s largest integrated rail and
road hub in terms of both number of people serviced and investments Financial highlights
€mn 2017 2018
Designing, construction and maintenance Revenues 2,176 2,046
of national roads EBITDA 175 157
Concessionaire of 29,000 km of roads
~ 1,300 km of highways Contratto di Programma 2016-2020 signed with the MIT
17%
36% new projects
routes completion
INVESTMENTS 2018 € 1,391 million
Fully funded by the Contratto di 2%
Programma 23.4 bn road access
reactivation
post-
44% earthquake
extraordinay
maintenance and 1%
safety upgrade other investments
20Corporate Sustainability
FS Sustainability approach
   Our sustainability approach permeates the full organizational structure ensuring integration of environmental, social and
                                   economical aspects within strategic business decisions

                                 BE A BUSINESS THAT WILL CREATE AN OFFER OF INTEGRATED AND
                               SUSTAINABLE MOBILITY AND LOGISTICS SERVICES, IN COMPLIANCE WITH
                               SAFETY, USING TRANSPORT INFRASTRUCTURES IN SYNERGY WITH OTHER
                                                   OPERATORS AND CREATING
                                                  VALUE IN ITALY AND ABROAD

                                  ECONOMIC                      SOCIAL                   ENVIRONMENTAL
                                 COMMITMENT                   COMMITMENT                  COMMITMENT

                                                           Be at the forefront of an       Be pioneers in the
                                    Be a leader               integrated mobility          development and
                                in the mobility sector      project that, through a         implementation
                              by promoting the quality     virtuous business model,    of large-scale integrated
                             and efficiency of transport   encourages fair business     mobility solutions that
                             and infrastructure services      practices and active     help regenerate natural
                                                                  engagement                    capital

                                                                                                                               22
Sustainability as driver of the Group’s business model
• Life Cycle Assessment • Renewal of the passengers
• Envision protocol: The first fleet with high energy
rating system for design and For a long term vision on the
useful life of the infrastructure, efficiency trains both high-
construction of sustainable speed and regional and low
infrastructure, reducing assessing its environmental
footprint carbon emissions buses
negative externalities
• The new High Speed line • Renewal of the cargo fleet
Napoli-Bari is the first INFRASTRUCTURE with high energy efficiency
European infra project to TRANSPORT electric locomotives
receive the certification
RESPONSIBLE CUSTOMERS
PROCUREMENT • We pay close attention to
• We integrate delivered and perceived service
environmental and social quality
issues in the procurement • We promote an integrated
of goods, services and works door-to-door system through
• Suppliers CSR assessment: the creation of intermodal
we encourage our suppliers hubs, vehicle sharing
to improve their agreements, bus-rail
environmental performance connections, etc...
23Development of a sustainable mobility
FS GROUP 2023 TARGETS FS GROUP LONG TERM GOALS
1. sustainable mobility
• passenger - 5% modal shift from
private car to public and shared
mobility, within 2030 (baseline
2015)
• freight – 50% freight rail transport
and 50% freight transport services
by road, within 2050
2. safety – best in class in Europe and “zero
fatalities” within 2050
3. energy and emissions - carbon neutrality
within 2050
24Sustainable Finance Green Bond Programme
Green Bond Framework update
Use of Proceeds
•   FS strongly believes that rail and public transport are critical for sustainable development and global efforts to combat
    climate change, by facilitating the modal shift away from cars and trucks into less carbon intensive modes of transport.

•   FS updated its Green Bond Framework which is in accordance with the 2018 ICMA Green Bond Principles and which aims at
    financing projects with a positive impact in terms of environmental and social sustainability.
    The GBF obtained a Second Party Opinion from Sustainalytics and is aligned with EU taxonomy.

                                                                                                       ELIGIBLE GREEN PROJECTS - EGB
                                     To ensure energy efficiency improvements, carbons emission reduction and modal shift to rail both for the local and long distance public
                                      transport and for freight transport, among other improvements related to air quality and comfort for passengers and safety for freight
                                                                                                 forwarding

                       •      Investments in public passengers transport rolling stock renewal

     Use of                       NEW ELECTRIC MULTIPLE UNIT (EMU) TRAINS FOR REGIONAL                                                                                 NEW HIGH SPEED TRAINS “ETR 1000”
                                                 PASSENGER TRANSPORT
    Proceeds

                       •      Investments in freight transport rolling stock renewal*

                                      NEW ELECTRIC LOCOMOTIVES FOR FREIGHT TRANSPORT                                                                                NEW WAGONS FOR FREIGHT TRANSPORT

                                                                                                 New Eligible Green Projects
                                                          FS may decide to include additional Project Categories for future issuances
                                                                                                         Look-back period of 3 years
                 * aligned with criterion 5 of Transport criteria - Low Carbon Land Transport and the Climate Bonds Standard. In 2018 MIR transported 0,0001% of the ONU Codes 1972 (natural gas) as fossil fuel, on the total tons of transported goods   26
Green Bond Framework
Process for Selection - Evaluation & Management of Proceeds - Reporting
FS’s Treasury will allocate, via intercompany loan,
FS’s internal Green Bond Working Committee
the Green Bond proceeds from the Treasury to the
reviews eligible projects and monitors FS’s
approved projects recorded in the Green Bond
Green Bond Framework.
Process for Register.
Committee consists of members of FS‘s Finance, Management
Selection and Whilst any bond proceeds remain unallocated, they
Sustainability teams and FS’s subsidiaries of Proceeds will be invested in accordance with FS’s liquidity
Evaluation involved and is chaired by FS’s Head of Finance.
management policies and guidelines in money
market products.
On an annual basis, at least until full allocation, FS will provide:
o Allocation reporting: detailing the bond proceeds allocation by category of Eligible Green Projects
o Performance reporting: for each category of Eligible Green Projects FS will report on relevant impact metrics
Relevant metrics could include:
PROJECT CATHEGORY INDICATIVE KEY PERFORMANCE INDICATORS
Reporting Investments in public passengers transport rolling Energy savings (GWh saved)
stock renewal Total GHG emissions avoided (tCO2 eq)
Freight Rail Transport Locomotive and wagons Estimated energy savings (GWh saved)
Renewal Estimated Total GHG emissions avoided (gCO2 tr/km)
FS’s annual Green Bond reporting will be made available on its website and in the Sustainability Report.
After full allocation, reporting will only be issued in the event of any material changes.
27External Reviews
Sustainalytics provided a Second Party Opinion on this Green Bond Framework and a Pre-issuance verification on the
Climate Bonds standard
FS obtained the Climate Bonds certification on its second green bond issuance
KPMG provided a Third Party Opinion on the first Green Bond Report
Ferrovie Green Bond
Impact of Use of Proceeds
Framework
Ferrovie ’s
“Ferrovie’s Green Bond Framework
sustainability
“Given the declared (estimated) energy
is credible and impactful, and strategy improvements of the new electric trains
aligns with the four core compared to previous models, as well as
components of the GBP 2018.” recyclability of the trains, Sustainalytics
“Ferrovie has demonstrated a is of the opinion that the eligible
commitment to integrate sustainable category contributes to increased
practices into its business strategy and sustainability and energy efficiency of
operations, as aligned with its strategic Ferrovie’s operations and the transport
vision” system in Italy.”
Sustainalytics believes that the eligible category is aligned with Ferrovie’s overall sustainability strategy and efforts, and will also
contribute to the advancement of UN SDGs, specifically 9, 11, and 12.
Based on the above, Sustainalytics is confident that Ferrovie is well-positioned to issue green bonds, and that Ferrovie Green Bond
Framework is robust, transparent and in alignment with the Green Bond Principles 2018.
28FS Italiane Climate Bonds Initiative Certification
First Italian issuer to obtain the CBI Certification
• FS Italiane obtained the Climate Bonds Initiative Certification for its second green bond issuance
• The Eligible Green Projects selected for the FS green bond align with the Low Carbon Land Transport criteria as
outlined by the Climate Bonds Standard*:
Criterion 3: Emissions threshold for public passenger transport - All infrastructure, infrastructure upgrades, rolling stock and vehicles for
electrified public transport pass this criterion, including electrified rail, trams, trolleybuses and cable cars. Buses with no direct emissions
(electric and hydrogen) also pass
Criterion 4: Emissions threshold for dedicated freight railway lines - All infrastructure, infrastructure upgrades and rolling stock for electrified
freight rail lines pass this criterion
Additionally, as per CBI’s requirements for dedicated freight railway lines, Ferrovie has confirmed that no more than 50% on the share of fossil
fuel freight t-km will be transported by the line
First Italian issuer
to obtain the CBI
Certification
*Climate Bonds Standard Version 2.1 and Low Carbon Land Transport Version 1.0
https://www.climatebonds.net/files/files/Climate%20Bonds%20Standard%20v2_1%20-%20January_2017.pdf 29
https://www.climatebonds.net/files/files/Low%20Carbon%20Transport%20Background%20Paper%20Feb%202017.pdfInaugural Green Bond issued in November 2017
Eur 600 million 0.875% 7-years bond
The first European green bond Demand exceeded 1.3 billion of The lowest coupon ever
of an incumbent railway Euro from 115 investors, of
operator, financing both high which around 50% sustainable obtained by FS in a
speed and regional trains. investors. public bond
REGIONAL TRAINS POP & ROCK HIGH-SPEED TRAIN ETR 1000
Eligible green
projects
financed
€50 million financed €550 million financed
by the bond by the bond 39 new investors
compared to
Eq. 3 Pop and 4 Rock Eq. 17 ETR 1000 previous public
issues, mainly
“green”
-20%* -20.5%*
1,142 tCO2 12,349 tCO2
saved VS Saved VS
previous Comparable
Model ETR500 trains
*See Green Bond Report 2018: https://www.fsitaliane.it/content/dam/fsitaliane/Documents/investor-relations/FS_Italiane_GreenBond_Report_Third%20_Party_Opinion_EMTN_Series_7.pdf
The ETR1000 emissions are estimated in comparison with the ETR500; regio trains data are evaluated in comparison with comparable trains, operating in the market. 30Second Green Bond issued in July 2019
Eur 700 million 1.125% 7-years bond
Geographical breakdown
Iberia Switz Asia Other
Nordics
3% 2% 1% 1%
Benelux 1%
5%
Carry on the Group’s 3.5x oversubscription with Eur First Italian bond to UK+Ire
France
sustainability path for a clean 2.5 billion orders coming from 7%
transport including the freight 156 investors, of which around obtain the CBI 36%
sector 50% from sustainable investors Certification Germ+Aut
8%
Italy
36%
PROJECTS FINANCED
Investor type breakdown
PASSENGER REGIONAL TRAINS POP & ROCK and HIGH- FREIGHT ELECTRIC LOCOMOTIVES and
SPEED TRAIN ETR 1000 WAGONS Banks & PB
Other
0,3%
13,8%
Insurances Funds\AM
& Pension 42,7%
Funds
Euro 120 million 20,9%
Euro 580 million
Official
Istitutions
22,3%
31Financial Overview
Robust financial performance continues to improve
 12.500
                                                                                                                                          12.078         Revenues
 12.000                                                                                                                                                                          Solid increase in revenue
 11.500                                                                                                                                                                               over the period.
 11.000                                                                                                                                                                      In 2018 from both the industrial
                                                                                                                                       2.476
 10.500                                                                                                                                            EBITDA                   performance and new acquisitions
 10.000                                                                                                          9.299
  9.500                                                                                    8.928                                          9.602
                                                                   8.585
  9.000               8.329                  8.390                                                                                                                           …focus on expenses containment
  8.500                                                                                                                                                                     despite employees growth and new
€mn                                                                                                              2.313
  8.000                                                                                                                                                                                acquisitions
                                                                                         2.293
  7.500                                                            1.975
                    2.033                    2.114
  7.000
                                                                                                                                               Operating Costs
                                                                                                                       6.986
  6.500                 6.296                   6.276                    6.610                 6.635
  6.000
                    2013                     2014                  2015                   2016                   2017                  2018

                                                                                           Consistent profitability and margins
            3.000
                                                                                                                                 30%
                                                                                 2.476                                                        25.7%
            2.500       2.293                        2.313                                                                                                          24.9%
                                                                                                                                 25%
                                                                                                                                                                                             20.5%
            2.000
                                                                                                                                 20%
            1.500                                                                                                                15%
      €mn
                                892                                                                                                                   10%
            1.000                      772                   718                         714                                     10%                                         7.7%
                                                                   552                         559                                                                                                   5.9%
             500                                                                                                                 5%

               0                                                                                                                 0%
                                2016                        2017                     2018                                                         2016                  2017                    2018
                                        EBITDA          EBIT    Net Income                                                                                  EBITDA Margin      EBIT Margin
                                                                                                 Source: FS 2018 Annual Report                                                                                  33
Group revenues breakdown
• In 2018 Revenues reached the record amount of €12,078 million (+30% vs 2017), mainly as a result of the consolidation into the
Group of ANAS and the lasting positive performance of the transport segment (+4%) both rail and road services.
DELTA REVENUES CONTRIBUTION GROUP REVENUE BY SEGMENT TRANSPORT REVENUES: MARKET VS. PSCS
12,078 Revenues from
non-recurring 58% Transport 37% 38%
transactions
9,293 + 2,785 ANAS + 2,567 39% Infrastructure
(+30%) Trainose
Qbuzz 2% other services 63% 62%
1% real estate
Revenues from 2017 2018
ordinary business
+ 287 Market revenues Public service contract fees
Mainly
Transport
2017 Euro million 2018
Services Euro million
Source: FS 2018 Annual Report
34Focus on operating costs
• In 2018 operating costs amounted to €9,602 million versus €6,980 million of 2017
The overall increase is almost entirely due to the expansion of the consolidation scope, mainly related to the ANAS figures
Greater capitalisations due to the increase in investments
Costs related to the Infrastructure services increase more than other divisions, given the consolidation of ANAS into the FS Group
Breakdown of operating costs Total operating costs by division
6.000 7.000
6.269
4.853 5.888
5.000 6.000
4.371
4.178
5.000 4.557 Transport
4.000 Personnel expense
4.000 Infrastructure
3.000 2.663
Raw materials
3.000 Real Estate Services
2.000 1.599 2.132
€mn 1.136 Services 2.000 Other services
1.000
1.000
Other costs incl. 275 266 125 285 Cons. Adj.
0 Capitalisation €mn 0
2017 2018 2017 2018
-1.000 -1.000
-991
-1.221 -2.000
-2.000 -1.574 -1.634
-3.000
Source: FS 2018 Annual Report
35FS Group’s CAPEX profile
Leading investor in development of transport, infrastructure and logistics
• For the third consecutive year, FS’s capital expenditure exceeded €5 billion (€ 5,871 million in 2018, excluding ANAS, of which €4,727 million
through government grants mainly earmarked to rail infrastructure).
• The majority of capex is related to the maintenance and development of the rail infrastructure network carried on by RFI, with a focus on
Traditional network (~ €4.6bn). Rail infrastructure capex is almost totally funded by the Government as per the “Contratto di Programma” between
Ministry of Infrastructure and Transport and RFI.
• Trenitalia accounted for 14% - €798million.
FS Capex in 2016 - 2018 2018 capex breakdown
7.000 3%
5.950 5.871 14% 1%
6.000 5.407
RFI - Traditional network
5.000
2% 2% RFI - High Speed network
4.000 Trenitalia
3.000 Busitalia Group
2016 Mercitalia Group
2.000 79%
Other capex
2017
1.000
€mn
0
2016 2017 2018 Capex excludes Anas S.p.A. and FSE S.r.l. investments recognised pursuant to IFRIC 12
ANAS investments in 2018 accounted for € 1,391 million
Source: FS 2018 Annual Report 36FS’ debt profile
Funding diversification
• Total gross financial debt (long term + short term) amounts to € 11,404mn at YE 2018 vs. €11,514mn at YE 2017.
The bulk of FS Group’s debt is held by FS Holding (€ 7,452mn, 65% of total).
• Part of FS' debt is funded directly through guaranteed State transfers (€ 2.12 billion out of the total debt of € 11.4 billion at YE
2018). This debt is earmarked to infrastructure investments.
• Net Financial Debt amounts to € 6,655mn at YE 2018 decreasing by 618 million on YE 2017, mainly due to an increase in cash
following ANAS consolidation and to a decrease in the stock debt as a result of repayments and new debt evolution in the year.
Breakdown Financial sources 2012 - 2018 (a) Strong Liquidity Position
Eur 2 bn Committed RCF Funding strategy
13% with 11 primary banks
Supranational 11% On 16 April 2019, the FS
Entities Board of Directors
13% 12% EMTN
EMTN Bonds bonds in approved new m\l term
88% debt up to 1.75 billion of
Bank Loans
CSPP since Access to Capital Markets Euro – both bonds and
76% July 2016 (b)
2012 42% Eur 7 bn EMTN Programme loans - to finance the
45% 2019 Group’s
2013
EIB investments
2018
CDP
Eurofima
(a) These percentages are calculated on the long term debt held by FS\RFI\TI which amounts to around 9.5 billion as of 31 December 2018
(b) In PSCC from July 2015 to July 2016
Source: FS 2018 Annual Report 37Balanced debt maturity profile
Effective management of financial expense
• The Group has a balanced debt maturity profile extending over the next 12 years, with the majority of maturities falling due over the next 7 years
• Historically low borrowing costs and an effective management of financial costs, including interest rate risk management policies, has resulted in a
containment of interest expense on debt generating value for the Group. In the last 5 years average interest expense decreased from 3% to around 1.5%
Group long term debt maturity profile as of 31 Dec. 2018* Interest expense on financial liabilities **
2.000
1.800 2,8%
2,7%
1.600 Eur 700mln 2,4%
1.400 new green
bond issued
1.200 in July 2019 1,7% 1,7%
1,5%
1.000
800 Eur
100mln
600 new PP
issued in
400
August
200 2019
-
€mn 2013 2014 2015 2016 2017 2018
2019 2020 2021 2022 2023 2024 2025 2026 2027 2028 2029 2030 2031 2032
Uncovered by State Transfers Covered by State Transfers
* Maturity profile calculated on the long term debt, included the current portion of the long term debt, held by FS\RFI\TI which amounts to around 9.5 billion
** The financial expense is net of government grants, therefore the ratio is calculated on the debt not funded through guaranteed government grants
Source: FS 2018 Annual Report
38Eur 7 billion EMTN Programme
Proved access to the bond market 11 bonds for Euro 4.75 billion outstanding
Amount * 5 benchmark size ° 6 private placement
Series Issue date Maturity
(Euro mio) public issuances
Among them, the two first
1* 07/2013 750 07/2020 corporate bond fully
70% underwritten by the EIB,
2* 12/2013 600 12/2021 28% RFI 2% Mercitalia one of them financed
Trenitalia Rail through the Juncker Plan
3° 01/2016 300 12/2025 funds of the EFSI
• For the • For the • For the
4° 07/2016 350 07/2022 purchase of completion of purchase of
5° 07/2016 50 07/2031 HS and the HS freight loco
regional infrastructure and wagons
6* 06/2017 1000 06/2025 trains
7* 12/2017 600 12/2023
8° 12/2017 100 12/2025 FS offers room for new issue at medium-long term tenors
9° 03/2018 200 03/2030 and is eager to develope its «green curve»
10* 07/2019 700 07/2026
11° 08/2019 100 08/2029 Latest FS capital market transaction:
10 year private placement issued with a final
From 2016, FS bond issues spread around 50 basis points below the BTP
within the ECB programme Net proceeds will finance the completion of
CSPP the high-speed network
39Debt service capacity
• Given improvement in profitability and conservative debt management, Net Financial Debt / EBITDA has
decreased to 2.7x in 2018 from 4.2 in 2012.
• Historically low borrowing costs and effective management of financial costs, including interest rate risk
management policies, resulted in EBITDA interest cover improved substantially in the last five years.
• FS Italiane maintains a strong and stable capitalisation.
Leverage evolution Capitalisation
18
35%
16 16,9 31%
15,6
16,0 30%
14 31% 30%
30% 29% 27%
12 25%
23%
10,8
10 10,8 20% 19%
9,9
8 18% 18% 16%
15% 17%
5,6
6 5,6 5,2 5,2 5,0 10%
4,6
4
4,2
2,9 3,1 2,7 5%
2 3,4 2,9
x.x 0%
-
2013 2014 2015 2016 2017 2018 2013 2014 2015 2016 2017 2018
Net Financial Debt\Equity Total Debt\EQUITY
Net Financial Debt\EBITDA Total Debt \ EBITDA EBITDA\Interest expense
Source: FS Annual Reports
40FY 2018 Consolidated Financial Statements
Income Statement Reclassified Statement of Financial Position
€mn 2017 2018 Change % €mn 2017 2018 Change
REVENUE 9,293 12,078 30,0 Net operating Working Capital 402 (324) (726)
Revenue from sales and services 8,993 11,566 28,6 Other Net Assets 1,173 2,378 1,204
Other income 300 512 70,7 Working Capital 1,575 2,054 479
OPERATING COSTS (6,980) (9,602) 37,6
Net non-current assets 47,279 50,986 3,706
EBITDA 2,313 2,476 7 Other provisions (2,902) (4,622) (1,720)
Amortisation, depreciation, provisions and Net assets held for sale 2 (2)
(1,595) (1,762) 10,5
impairment losses
NET INVESTED CAPITAL 45,954 48,418 2,464
EBIT 718 714 (0,6)
Net financial expense (100) (97) (3)
Net current financial debt (65) (555) (490)
Net non-current financial debt 7,338 7,210 (128)
PRE-TAX PROFIT 618 617 (9,4)
Net financial debt 7,273 6,655 (618)
Income taxes (64) (58) (0,9)
PROFIT FROM CONTINUING OPERATIONS 554 559 9,4 Equity 38,681 41,763 3,082
Loss from assets held for sale, net of taxes (2)
PROFIT FOR THE YEAR 552 559 1,3 COVERAGE 45,954 48,418 2,464
41Contacts:
Stefano Pierini – Head of Finance, Investor Relations and Real Estate
Tel.+39 06 44102348
Mail: s.pierini@fsitaliane.it
Vittoria Iezzi – Head of Debt Capital Market
Tel. +39 06 44106655
Mail: v.iezzi@fsitaliane.it
Lorenza Di Cintio – Debt Capital Market
Tel. +39 06 44103772
Mail: l.dicintio@fsitaliane.it
Cuono Altobelli– Debt Capital Market
Mail: c.altobelli@fsitaliane.it
http://www.fsitaliane.it/fsi-en/Investor-Relations
https://www.fsitaliane.it/content/fsitaliane/it/investor-relations/debito-e-credit-rating.html
42You can also read