Wallenius Wilhelmsen ASA - Company presentation "Defining logistics for a world in motion" - Wallenius Wilhelmsen ...
←
→
Page content transcription
If your browser does not render page correctly, please read the page content below

May 2019

Wallenius Wilhelmsen ASA
     Company presentation

“Defining logistics for a world in motion”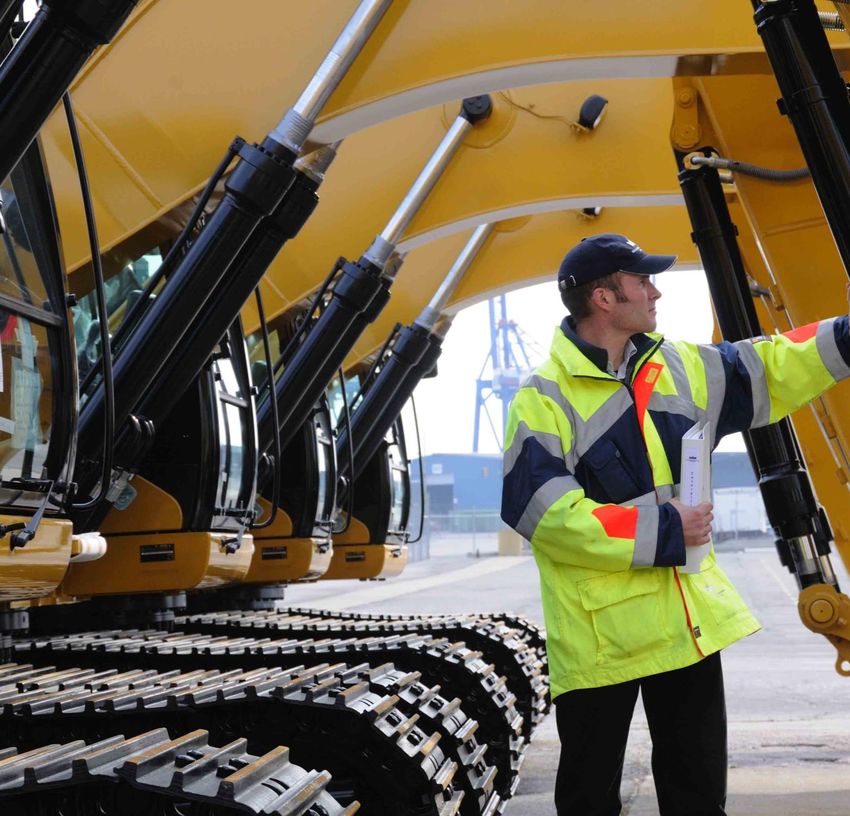
DISCLAIMER

This presentation (the “Presentation”) has been prepared by Wallenius Wilhelmsen ASA (“Wallenius Wilhelmsen ASA” or the “Company” and together with its subsidiaries the "Group"). The Presentation has been
prepared and is delivered for information purposes only. It has not been reviewed or registered with, or approved by, any public authority, stock exchange or regulated market place.
The contents of the Presentation are not to be construed as financial, legal, business, investment, tax or other professional advice. Each recipient should consult with its own professional advisors for any such
matter and advice.
The Company makes no representation or warranty (whether express or implied) as to the correctness or completeness of the information contained herein, and neither the Company nor any of its subsidiaries,
directors, employees or advisors assume any liability connected to the Presentation and/or the statements set out herein. This Presentation is not and does not purport to be complete in any way. By receiving this
Presentation you acknowledge that you will be solely responsible for your own assessment of the Company, its financial position and prospects and that you will conduct your own analysis and be solely responsible for
forming your own view of any refinancing and the potential future performance of the Company’s business.
The information included in this Presentation may contain certain forward-looking statements relating to the business, financial performance and results of the WWL Group and/or the industry in which it operates.
Forward-looking statements concern future circumstances and results and other statements that are not historical facts, sometimes identified by the words “believes”, “expects”, “predicts”, “intends”, “projects”,
“plans”, “estimates”, “aims”, “foresees”, “anticipates”, “targets”, and similar expressions. The forward-looking statements contained in this Presentation, including assumptions, opinions and views of the Company or
cited from third party sources are solely views and forecasts which are subject to risks, uncertainties and other factors that may cause actual events to differ materially from any anticipated development. None of the
Company or any other company in the WWL Group, or any of its advisors or any of their parent or subsidiary undertakings or any such person’s affiliates, officers or employees provides any assurance that the
assumptions underlying such forward-looking statements are free from errors nor does any of them accept any responsibility for the future accuracy of the opinions expressed in this Presentation or the actual
occurrence of the forecasted developments. The Company assumes no obligation to update any forward-looking statements or to conform these forward-looking statements to the WWL Group's actual results.
Investors are advised, however, to inform themselves about any further public disclosures made by the Company, such as filings made with Oslo Børs or press releases.
This Presentation does not constitute any solicitation for any offer to purchase or subscribe any securities and is not an offer or invitation to sell or issue securities for sale in any jurisdiction, including the United States.
Distribution of the Presentation in or into any jurisdiction where such distribution may be unlawful, is prohibited. The Company and its advisors require persons in possession of this Presentation to inform themselves
about, and to observe, any such restrictions.
This Presentation speaks as of the date set out on the front page, and there may have been changes in matters which affect the WWL Group subsequent to the date of this Presentation. Neither the issue nor delivery
of this Presentation shall under any circumstance create any implication that the information contained herein is correct as of any time subsequent to the date hereof or that the affairs of the WWL Group have not
since changed, and the Company does not intend, and does not assume any obligation, to update or correct any information included in this Presentation.
This Presentation is subject to Norwegian law, and any dispute arising in respect of this Presentation is subject to the exclusive jurisdiction of Norwegian courts with Asker and Bærum District Court as exclusive venue.
By receiving this Presentation, you accept to be bound by the terms above.

                                                                                                                                                                                                                                        2
Investment highlights

    1   Global market leader in the vehicle logistics segment

    2   Diversified business model with both Ocean and Landbased logistics

    3   Diversified and solid customer base with long term contracts

    4   Profitable and positive cash flow despite challenging market

    5   Solid platform for future growth and improved earnings

    6   New USD 100 million performance improvement program

    7   Highly experienced management team with strong track record

                                                                             3
Agenda
         Wallenius Wilhelmsen in brief

         Financial performance

         Market outlook

         Summary and Q&A
Wallenius Wilhelmsen in brief     Financial performance            Market outlook                      Summary and Q&A

Wallenius Wilhelmsen – our history

                                                                                                                                                               Merger to create
                                                                                                                                                            Wallenius Wilhelmsen
                                                                                                                                                                ASA as a listed
                                                                                                                                 Wallenius Wilhelmsen
                                                                                                                                                            company incl. EUKOR,
                                                                                                                                changes its name from
                                                                                                                                                            WWL, American Roll-on
                                                                                                                                   Lines to Logistics,
                                                                                                                                                             Roll-off Carrier (ARC),
                                                                                                       EUKOR formed as             signaling the shift
                                                                                                                                                            as well as Wilhelmsen
                                                                                                     Wilhelmsen Group and             towards fully
                                                                                                                                                            and Wallenius vessels
                                                                                                       Wallenius Shipping         integrated logistics
                                                                                                     acquires the car carrier   services from factory to
                                                                             Merger between                                              dealer                      2017
                                                                           Wilhelmsen group and      unit Hyundai Merchant
                                                                           Wallenius Shipping to             Marine
                                               American Roll-on Roll-
                                               off Carrier founded by         form Wallenius                                             2006
                                               Wilhelmsen Group and         Wilhelmsen Lines
                                                Wallenius Shipping                                            2002
                          Wallenius Lines               jointly
                       founded in Stockholm,
                                                                                    1999
 Wilhelmsen Group         Sweden by Olof
founded in Tønsberg,        Wallenius
Norway by Morten W.                                    1990
    Wilhelmsen
                               1934

       1861

                                                                                                                                                                                       5
Wallenius Wilhelmsen in brief      Financial performance            Market outlook         Summary and Q&A

Wallenius Wilhelmsen is the undisputed market leader for vehicle logistics

KEY FACTS & FIGURES                                                                              OUR PRODUCTS & SERVICES

 ~125                                                                             2
                                                                                  MARINE TERMINAL                                                       1       OCEAN1
 vessels servicing >15 trade
                                                                                  SERVICES
  routes to six continents
                                                                                                                                                              Revenues 2018
                                                                                                                       3                                       ~3.2bn USD
                                        PLANT -BASED                                                                    PORT-BASED
                                        TECHNICAL                                                                       TECHNICAL        4                     EBITDA 2018
 >18M                                   SERVICES                                                                        SERVICES         DISTRIBUTION
                                                                                                                                         TO DEALER
                                                                                                                                                               ~530 MUSD
   ~4.5M units for Ocean                  3               DISTRIBUTION
 ~13.5M units in Landbased                                TO PORT
                                                                                                                                                        2     LANDBASED
                                                          4                        OCEAN
                                                                                   TRANSPORTATION                                                       3     Revenues 2018
                                                                                  1                                                                     4      ~900 MUSD
 9,500                                                                                                   MARINE TERMINAL
                                                                                                         SERVICES                                              EBITDA 2018
~2,200 Office workers
~7,300 Production workers
                                                                                                         2                                                      ~90 MUSD

 1) Not including Holding segment of negative about USD 15 million
                                                                                                                                                                              6
Wallenius Wilhelmsen in brief   Financial performance     Market outlook            Summary and Q&A

Wallenius Wilhemsens consists of two main segments

1                                                                                                  2
                 OCEAN TRANSPORTATION                                                                                LANDBASED SERVICES

                                  “Market Leader”                                                                      “Full Life Cycle Logistics”

Note: ARC retains a separate and independent management structure
                                                                                                                                                                   7
Wallenius Wilhelmsen in brief       Financial performance            Market outlook                      Summary and Q&A
1
    The group is the clear market leader and the #1 operator globally

     Fleet by operator group                                                                                            Fleet characteristics
       Capacity                                                                                                             Average max
       (1000 CEU)                                                                                       Order
                                                                                                                            ramp capacity,
                                                                                                        Current             tons
       1 100
                                                                                                        Current             300
       1 000

         900                                                                                                                250                                                   WW Ocean

         800
                                                                                                                                                               GRIMALDI
         700                                                                                                                200

         600
                                                                                                                            150
         500                                                                                                                                                                           HAL
                                                                                                                                                          K LINE         EUKOR
         400                                                                                                                100
                                                                                                                                                 MOL
         300

         200                                                                                                                 50                                           NYK
                                                                                                                                                               GLOVIS

         100
                                                                                                                              0
           0                                                                                                                        1            2                   3                   4         5
                WALWIL        NYK        MOL        K-LINE     HYUNDAI       HOEGH     GRIMALDI     OTHER
                                                                GLOVIS                                                                                  Average # of hoistable decks
    1) Car equivalent units, a standardized capacity measurement unit
                                                                                                                                                                                                       8
Wallenius Wilhelmsen in brief          Financial performance        Market outlook               Summary and Q&A
1
    Wallenius Wilhelmsen has a core fleet of 126 vessels and leverages the
    charter market to balance capacity short term
    Fleet development
                                                                                                                   Comments
    # of vessels
                                                         Owned        Chartered         Short Term T/C In/Out
                                                                                                                  • Wallenius Wilhelmsen has a core fleet of 126 vessels
                                                                                                                    with 78 owned vessels and 48 vessels on long term
                                                137                                                                 charters
                131     131     131     132                                                 131
         127                                     10       124        123          126                  127
                 5       6       6       9                                         0         5          1         • The owned fleet is relatively young with an average of
                                                                                                                    12 years and only 1 vessel above the age of 25 years
         51      49      50      49      46      49        49        48            48        48        48         • The group strives to have fleet flexibility through
                                                                                                                    combination of owned and chartered tonnage
                                                                                                                  • The group actively leverages the charter market to
                                                                                                                    balance capacity both short and medium term (e.g.
                                                                                                                    swaps and spot charterers)

         76      77      75      76      77      78        78        78            78        78        78         • Delivery of vessel number two of four in the Post-
                                                                                                                    Panamax newbuilding program on 11 April 2019
                                                                                                                  • No further CAPEX planned past two newbuildings with
                                                                                                                    expected delivery in late 2019 and 2020 (installments
                                                           -3         -3
        Q1’17   Q2’17   Q3’17   Q4’17   Q1’18   Q2’18    Q3’18      Q4’18    January      February   March          of USD ~80 million remaining)

                                                                                                                                                                             9
Wallenius Wilhelmsen in brief   Financial performance   Market outlook   Summary and Q&A
1
    An unrivalled and agile global RoRo network to meet changing demand

    About 125 vessels with more than 1,300 sailings and 9,000 port calls per year
    Overview of key trade routes

       WW Ocean trade routes
       EUKOR trade routes
       ARC trade routes
       ARMACUP trade routes

                                                                                                                                    10
Wallenius Wilhelmsen in brief Financial performance Market outlook Summary and Q&A
1
Diversified customer portfolio with long term contracts
Size of cargo segments Main customers include all major OEMs globally
• MainAUTO
customers include all main
HIGH OEMs globally
& HEAVY BREAKBULK • Auto
Main customers include all main OEMs globally
~73% of ~27% of
CBM* CBM* High & Heavy
• Majority of volume from auto
Breakbulk
• High & heavy and breakbulk maximize cubic utilization
• Unique handling capabilities for high & heavy and breakbulk
*Average share of total CBM last two years
11Wallenius Wilhelmsen in brief Financial performance Market outlook Summary and Q&A
1
For IMO 2020, Wallenius Wilhelmsen has chosen a balanced approach
which gives the best chance of managing risks and costs
Commercial Technical Financial
Changes in Bunker Adjustment Scrubber installations Derivative products
Factor (BAF) clauses and to allow for use of and hedging to
customer contracts HSFO on selected vessels reduce exposure
12Wallenius Wilhelmsen in brief Financial performance Market outlook Summary and Q&A
2
The landbased services network is global
In-plant vehicle processing centres
In-plant equipment processing centres
Terminals
Vehicle processing centres
Equipment processing centres
Inland distribution networks
13Wallenius Wilhelmsen in brief Financial performance Market outlook Summary and Q&A
2
Our Landbased services portfolio
Landbased services portfolio Main customers
• Auto
Main customers include
Marine Terminals Technical Services Inland Distribution all main OEMs globally
EBITDA share EBITDA share EBITDA share
High & Heavy
Stevedoring Accessory fitting Mix of assets and procured
Custom clearance Pre delivery inspections services with forward strategy Breakbulk
Receive and delivery Repairs and rectifications focused on non asset
Cargo handling Storage management brokerage
14Wallenius Wilhelmsen in brief Financial performance Market outlook Summary and Q&A
2
The last 10+ years has been an exiting journey for landbased
Early 1990s 2005 2009 2010/11 2016 2017
Southampton DAS acquired Castor Green EPC ‘s in VSA and CAT-WWL Acquisition of Keen
and Port from Nissan Terminal – our Panama, 100% takeover Transport, Expansion
Huemne North zero emission Galveston and Landbased business of Zeebrugge terminal
America vision for Dubai reaches USD 0.7 bn initiated and several
(known as terminal and revenues new VPCs in North
VSA) processing America and Europe
services being established
- 2005:
Defensive 2005 – 2013: 2013 – 2016 2017 –
strategy From lines to Logistics The growth engine Full life cycle logistics
“2000” 2006 2009 2014 2018
A strategy shift Pyoengteak MIRRAT
Zeebrugge in
towards fully terminal in Acqusition of
1999 terminal
integrated Korea & Syngin
concession
Baltimore logistics Investments in Technology
won
(2001) services from two Chinese
Kotka (2003) factory to terminals
dealer
15Wallenius Wilhelmsen in brief Financial performance Market outlook Summary and Q&A
2
Keen Transport makes us the clear market leader in US H&H processing;
Syngin Technology the first step into Full Life Cycle Logistics
Keen Transport Inc. Syngin Technologies Inc.
• Acquisition of Keen Transport Inc. December 2017 for a total • Acquisition of 70% of Syngin Technologies June 2018 for an
acquisition price of USD 64 million on a cash- and debt-free expected total purchase price of about USD 30 million on a
basis (EBITDA multiple of about 5-6x) cash- and debt-free basis (EBITDA multiple of about 5-6x)
• Keen operates 14 High & Heavy Equipment Processing • Leading provider of automated logistics solutions for
Centers (EPC's) and a specialty trucking entity in the US disposition of used vehicles through an electronic marketplace
• The acquisition is a strong fit strategically and operationally, • Syngin streamlines the movement of vehicles handled by fleet
yielding some synergies leasing companies & remarketers to auction houses through a
• Opportunity to capitalize on the improving fundamentals of virtual marketplace that matches these stakeholders with
the mining and construction sector, both in the US and abroad transportation providers & repair centers
• Combined strength of companies
represents a significant opportunity
to scale the business, not only
within the current scope, but also
into adjacent customers and
geographies
16Wallenius Wilhelmsen: “Defining logistics for a world in motion”
Finished vehicle
supply chains will be
transformedWallenius Wilhelmsen in brief Financial performance Market outlook Summary and Q&A
Wallenius Wilhelmsen ESG strategy consists of 3 pillars
Environmental Social Governance
Ambition
Reaffirm Wallenius Wilhelmsen as a Resilience, appeal and innovation through Effective management and control of
Main
Lean:Green logistics leader diversity, training, welfare and outreach operations, in combination with
transparency, clarity and proper business
practices
Key Objectives
Lobby for Nurture Lean:Green Diversity across Committed to best-
Training and Compliance “Top of
progressive and innovation to create locations and practice policies and
development Mind”
pragmatic outcomes revenue & savings business units procedures
Reduce GHG thru
Prepare for Sulphur Working conditions Cultivate culture of Participate in global
multi-faceted Social outreach
2020 and welfare integrity networks
approach
18Financial performance update
Wallenius Wilhelmsen in brief   Financial performance   Market outlook   Summary and Q&A

Highlights first quarter 2019

 EBITDA of USD 218 million, a significant improvement y-o-y

 Ocean results positively impacted by performance improvement initiatives, lower net
 bunker cost and project cargo in the Atlantic

 Underlying flat ocean volume development y-o-y

 The landbased segment delivered stable performance

 About USD 60 million of the USD 100 million performance improvement target confirmed

                                                                                                                      20
Wallenius Wilhelmsen in brief Financial performance Market outlook Summary and Q&A
Consolidated results – first quarter 2019
Q1 2019 Q4 2018 Q1 2018 Comments
Total income 1 018 1 022 968 • Total income was USD 1 018 million in the first
Operating expenses (799) (854) (843) quarter, up 5% y-o-y due to increased revenues for
EBITDA* 218 168 125 the ocean segment
EBITDA adjusted 218 168 128 • EBITDA of USD 218 million, up USD 93 million y-o-y
of which USD 42 million was the impact of IFRS 16
Depreciation (123) (88) (85)
new accounting rules
Other gain/losses 0 36 (40)
• Underlying improved performance driven by the
EBIT 95 116 0
ocean segment
Net financial items (70) (82) (5)
• Net financial items of USD 70 million in the quarter
Profit before tax 25 34 (5)
• Interest expense was USD 53 million, up 15% as a
Tax income/(expense) (3) 11 (25) result of implementation of IFRS 16 (USD 10 million)
Profit for the period 22 45 (30) • Net financial expenses negatively impacted by USD
22 million from unrealised interest rate derivates
EPS 0.05 0.10 (0.07)
• Tax expense of USD 3 million in the first quarter
*IFRS 16 effect on EBITDA 42 n/a n/a
21Wallenius Wilhelmsen in brief Financial performance Market outlook Summary and Q&A
IFRS 16 – Impact for Wallenius Wilhelmsen
Impact of Change in Lease Accounting (IFRS 16) – Q1 2019
USD million
Effect on balance sheet Effect on income statement
855 855 Ocean
Landbased
42
31
5
11
3
2
-2
Assets Liabilities -3
-6
EBITDA EBIT Net result
22Wallenius Wilhelmsen in brief Financial performance Market outlook Summary and Q&A
Ocean segment – first quarter 2019
Total income and EBITDA ocean segment1
Comments
USD million
Total income EBITDA • Total income was USD 812, up 8% y-o-y driven by higher
net freight/CBM and fuel cost compensation from
IFRS 16 effect
Extraordinary items
customers
+8% +1%
+71% +25% • EBITDA of USD 190 million, an improvement of USD 81
832 842 190 million y-o-y of which USD 31 million in IFRS 16 effect
822 807 812
798
766
719
750
162
170
160
31 • Performance improvement driven by several factors:
152
• Full realization of synergies and early wins on the performance
136 132
123 improvement program (about USD 25 million in total)
111
• Higher net freight/CBM due to more favourable cargo mix and
145 162 strong project cargo in the Atlantic
157 159
134 132 • Lower net bunker cost (about USD 10 million)
109
• Favourable currency developments (about USD 10 million)
• Biosecurity challenges continued and impacted the
17 8 3 2 2 results with about USD 5 million in the quarter
Q1’17 Q2’17 Q3’17 Q4’17 Q1’18 Q2’18 Q3’18 Q4’18 Q1’19 Q1’17 Q2’17 Q3’17 Q4’17 Q1’18 Q2’18 Q3’18 Q4’18 Q1’19
• EBITDA increased by USD 38 million q-o-q of which USD
31 million is explained by the IFRS 16 implementation
1) Adjusted for extraordinary items
23Wallenius Wilhelmsen in brief Financial performance Market outlook Summary and Q&A
Landbased segment – first quarter 2019
Total income and EBITDA landbased segment1
Comments
USD million
Total income EBITDA • Total income in the first quarter was USD 232
million with all business segments delivering
IFRS effect Extraordinary items
0% -1% revenues in line with first quarter last year
+63% +50%
232
225
235 232 • EBITDA for the first quarter ended at USD 33 million,
221 222 33
203 24 up USD 13 million y-o-y of which USD 11 million in
186 192
27
24
25 11 IFRS 16 effect
22 23 22
20
• The improvement was driven by stronger
26 29 performance of Solutions Americas – H&H which
23 25
22
benefitted from full realization of synergies
combined with strong volumes and favourable
1 1
-5
0 customer and service mix
Q1’17 Q2’17 Q3’17 Q4’17 Q1’18 Q2’18 Q3’18 Q4’18 Q1’19 Q1’17 Q2’17 Q3’17 Q4’17 Q1’18 Q2’18 Q3’18 Q4’18 Q1’19
• Underlying development in other products was flat
both y-o-y and q-o-q
1) Adjusted for extraordinary items
24Wallenius Wilhelmsen in brief Financial performance Market outlook Summary and Q&A
Underlying flat volume development in the quarter
Volume and cargo mix development
Comments
Million CBM and %
Auto High & heavy High & heavy share
Million CBM
19.5
-2% -5% %
• Overall y-o-y Auto volumes pulled down by
20 19.4 32
18.8
18.2 18.0 18.2 18.0
18.5
30 contractual choices in the Atlantic trade (effective
17.0 17.3 17.1 28
16.8
16.2 16.2 16.5 16.2 January 2019)
15.5 26
15.2
15 24
22 • Increased High & Heavy (H&H) partly offset overall
20
14.9
13.7
14.7
13.5 13.3
13.9 13.1
12.2 18
volume drop and improved H&H share to 30%, up
14.5 12.6 12.5
12.5 11.9 11.4
10 11.7 11.3
12.5 12.3 16 from 27%
14
12
10 • Trade mix had a positive impact on net freight
5 8 development in the quarters, supporting underlying
6
4.5 4.6 4.7 4.6 4.7 4.5 4.9 4.6
5.4 5.1 4.6 4.9 4 results
3.7 3.9 4.3 3.9 3.7 3.9
2
0 0
Q4’14 Q1’15 Q2’15 Q3’15 Q4’15 Q1’16 Q2’16 Q3’16 Q4’16 Q1’17 Q2’17 Q3’17 Q4’17 Q1’18 Q2 ’18 Q3’18 Q4’18 Q1’19
1) Prorated volume (WW Ocean, EUKOR, ARC and Armacup)
2) H&H share calculated based on unprorated volumes 25Wallenius Wilhelmsen in brief Financial performance Market outlook Summary and Q&A
Some contractual wins in early 2019, but majority yet to be renewed
Overview of 2019 contract renewals Rate changes and impact for 2019 contract renewals
USD and percent (Circle indicate size of contract in millions)
Rate change Contract renewals 2019
Percent Contractually agreed rate adjustments
50
40
Renewed 23%
30
20
10
0
To be renewed 77%
-10
-20
-30
-40
2019 -6 -5 -4 -3 -2 -1 0 1 2 3 4 5
Rate impact (USD millions)
26Wallenius Wilhelmsen in brief Financial performance Market outlook Summary and Q&A
Performance improvement program off to a good start
- remaining improvements carry a longer lead time
Confirmed and realized improvements
Comments
USD million in annualized effect
100 • USD 60 million of the USD 100 million performance
improvement program confirmed at end of Q1, up
from USD 55 million in previous quarter
61 • The additional USD 5 million come mainly from;
56
• Voyage optimization Asia-Europe & Atlantic
43 • More efficient hull cleaning across the board
• Annualized run rate of realized improvements also
reached USD 60 million, up from about USD 20
million in the previous quarter
Q3 Q4 Q1 Q2 Q3 Q4 Q1 Q2 Q3 • Remaining initiatives require longer lead-time;
2018 2018 2019 2019 2019 2019 2020 2020 2020 • Centralised voyage management
• Further voyage optimisation
Contractual improvements Centralized vessel and voyage management Realized improvements
Voyage Optimization More efficient hull cleaning
1 Not adjusted for USD 10 million in negative rate impact from 2018 contract renewals
27Wallenius Wilhelmsen in brief Financial performance Market outlook Summary and Q&A
Cash flow and liquidity development – first quarter 2019
Cash flow and liquidity development
Comments
USD million
• CAPEX of about USD 9 million includes
218 • Dry docking and newbuildings (USD 2 million)
-9 -11 • Landbased maintenance and equipment (USD 6 million)
-54 -2
555
• Net financing of USD -11 million mainly relates to
-71
484
• Regular instalments of about USD 80 million
• Refinancing of three vessels in EUKOR of about USD 126
million with net proceeds of USD 10 million
• Utilisation of credit facilities of about USD 90 million
• Payments on lease contracts classified as repayment of
debt of about USD 30 million
• Other includes increased accounts receivable of about
Liquidity EBITDA CAPEX Net financing Interest paid Taxes paid Other Liquidity
USD 55 million, reduced accounts payable by about USD
Q4 2018 incl. financial Q1 2019 20 million and reduced inventory of about USD 30
derivatives
million
28Wallenius Wilhelmsen in brief Financial performance Market outlook Summary and Q&A
Balance sheet review – first quarter 2019
Balance Sheet 31.03.2019
Comments
USD billion
Assets Equity & Liabilities
• Total assets of USD 8.3 billion with equity ratio of
35.0%, down from 38.8% in the previous quarter
8.3 8.3 due to implementation of IFRS 16
• Net interest bearing debt of USD 3.8 billion, of
Equity 2.9
which reclassification of operational leases (IFRS 16
effect) represents USD 855 million
Non current assets 6.9
• Continued strong cash and liquidity position with
Non current liabilities 4.3 USD 555 million in cash and about USD 280 million
in undrawn credit facilities
• On 9 April 2019, remaining outstanding amounts
Current assets 1.3 Current liabilities 1.1
under the NOK 800 million bond was repaid
29Wallenius Wilhelmsen in brief Financial performance Market outlook Summary and Q&A
Wallenius Wilhelmsen ASA dividend policy
DIVIDEND POLICY
“Wallenius Wilhelmsen ASA’s objective is to provide shareholders with a competitive
return over time through a combination of rising value for the share and payment of
dividend to the shareholders. The Board targets a dividend which over time shall
constitute between 30 and 50% of the company’s profit after tax. When deciding the size
of the dividend, the Board will consider future capital requirements to ensure the
implementation of its growth strategy as well as the need to ensure that the Group’s
financial standing remains warrantable at all times. Dividends will be declared in USD and
paid out semi-annually”
FINANCIAL TARGETS
Key ratios Target
Equity ratio >35%
Return on capital employed («ROCE») >8%
30Market outlook
31Wallenius Wilhelmsen in brief Financial performance Market outlook Summary and Q&A
Volume outlook increasingly uncertain driven by macro picture, but
supply-demand balance gradually improving
Auto – slowing sales H&H – solid, but softening Market balance – firmer
Growth has come down from
Sales slowing in all major Current orderbook at
double-digit levels seen in
markets historical low
2017 – 2018
32Wallenius Wilhelmsen in brief Financial performance Market outlook Summary and Q&A
Auto sales down 4.3% y-o-y
- driven by slow sales in all major markets
Global light vehicle (LV) sales per quarter1,2) Regional LV sales per month1,2)
Units Growth (y-o-y)
USA -3.0%
-3%
-2% -2%
Sales continued down,
-4.3% -2.7% however market size still
24.9
23.4 23.9 23.9 23.5 solid in absolute terms
22.9 23.0 22.9 Jan Feb Mar
22.4
Western Europe -2.9%
-3%
-4% -2% Sales continued down;
several OEMs continue
WLTP struggles,
Jan Feb Mar uncertainty around Brexit
-16% China -12.8%
-8%
-14% China LV sales off to a
weak start, softened
consumer confidence and
Jan Feb Mar awaiting potential
Q1 2017 Q2 2017 Q3 2017 Q4 2017 Q1 2018 Q2 2018 Q3 2018 Q4 2018 Q1 2019
governmental stimulus
2018 2019
Source: 1) IHS Markit 2) LMCA Automotive
33Wallenius Wilhelmsen in brief Financial performance Market outlook Summary and Q&A
Market uncertainty has increased although auto analysts remain
positive about medium-term growth prospects
Global LV forecasts
Units and growth (y-o-y)
Global LV sales
Several factors fuel uncertainty in short and medium term:
+2.2% +4.5% -2.8% -5.8% -4.3% -3.5% +0.9% +5.9%
• Trade barriers – continued risk with implications for both sales and
sourcing shifts globally
• WLTP introduction Europe – distortions on both supply and demand
23.9 23.9 22.4 23.5 22.9 23.1 22.6 24.9
side (incl. imports), effects in Q2 and possibly longer
• Brexit – continued uncertainty triggering temporary and permanent
Q1 2018 Q2 2018 Q3 2018 Q4 2018 Q1 2019 Q2 2019 Q3 2019 Q4 2019
production shutdowns
Global LV exports • China – continued softening driven by overall economy and high
inventories, but expected stimulus packages to influence positively
+3.5% +5.2% +0.7% +0.3% -1.1% +1.0% +3.8% +6.9%
• US Vehicle prices – rising due increased finance cost, also high
inventories
3.7 3.8 3.7 3.8 3.7 3.9 3.9 4.0
• Emerging markets – continued risk with macro-economic instability in
markets like Turkey and Argentina and geopolitical developments in
Q1 2018 Q2 2018 Q3 2018 Q4 2018 Q1 2019 Q2 2019 Q3 2019 Q4 2019
the Middle East
Source: IHS Markit. Exports are sales based
34Wallenius Wilhelmsen in brief Financial performance Market outlook Summary and Q&A
High & heavy trade remained solid while momentum keeps softening
Construction Machinery Mining Machinery Agriculture Machinery
Exports (YoY) Sales (YoY) Exports (YoY)
40% 60% 40%
EXPORT1 & 20%
30%
20%
SALES DATA2 0%
0% 0%
-30%
-20% -60% -20%
12/12 12/13 12/14 12/15 12/16 12/17 12/18 3/14 3/15 3/16 3/17 3/18 3/19 12/12 12/13 12/14 12/15 12/16 12/17 12/18
Sales (YoY) Sales (YoY) Sales (YoY)
+28%
+23%
+20%
+16%
+10% +10% +12%
OEM SALES +4% +4%
+2% +3%
ESTIMATES3
-3% 2017 2018 2019e 2020e 2017 2018 2019e 2020e
2017 2018 2019e 2020e
Fragile growth backed by recovering
Weakened momentum, as growth is Mixed picture with last years drought in
commodity prices and significant
increasingly unsynchronised globally key markets weighing in on sentiment
underinvestment during previous downturn
Source: 1IHS Markit | World (major exporters) construction/rolling mining equipment and agriculture equipment exports (>20 kUSD ) (Units last 3 months y-o-y) 2Caterpillar | 3 month rolling retail sales (Units last 3
months y-o-y) 3Factset data and Analytics (25.04.19). | OEM Revenue Consensus Estimate (y-o-y). Construction: Volvo, Caterpillar, CNH, Komatsu, Hitachi, Terex. Mining: Sandvik, Caterpillar, Hitachi, Atlas Copco, Epiroc 35
(>2018). Agriculture: AGCO, CNH, Deere. Sales in construction/agriculture/mining equipment divisions only.Wallenius Wilhelmsen in brief Financial performance Market outlook Summary and Q&A
Low order book and minimal net fleet growth expected for several years
Car Carrier Fleet Orderbook Fleet and demand growth
# vessels equal or above 4000 CEU Percent
15 9 Growth y-o-y
4
3
2
5 1
0
2018 2019 2020 2021
1
Demand growth Net fleet growth
Order book 2019 2020 2021
• No new orders were confirmed in the first quarter 2019* • Deep-see shipments forecasted to increase with about 2% per year
• One vessel was delivered, three vessels recycled in the quarter • New regulation (IMO 2020) could create extra demand for tonnage
• Current markets and earnings do not justify new ordering activity • Marginal net fleet growth (if any) expected for several years
Source: Clarksons Platou *for vessels above 4000 CEU
36Summary and Q&A
Outlook

Volume outlook remains uncertain – due to macro picture

Market rates remain at a low level – but tonnage balance gradually improving

Net freight/CBM and project cargo shipments – not expected to remain at first quarter levels

Solutions Americas – Auto (VSA) continued impacts by weaker US auto market, while other
landbased business segments are expected to perform well

Performance improvement program – good progress will support profitability in 2019

                                                                                               38
Thank you!
Appendix
Strong Management Team with +20 years industry experience

                     Wallenius Wilhelmsen Senior Management team

                                        Wallenius Wilhelmsen ASA

                                             Craig Jasienski
                                             CEO

                                                                  Jan Dahm-Simonsen
                     Rebekka Glasser Herlofsen
                                                                  Organizational development &
                     CFO
                                                                  HR

                     Målfrid Lundell                              Simon White
                     Transformation office                        Group IT

           ARC              EUKOR                              Wallenius Wilhelmsen Ocean        Wallenius Wilhelmsen Solutions

   Eric Ebeling      Erik Noeklebye                               Mike Hynekamp                       Ray Fitzgerald
   CEO               CEO                                          COO                                 COO

                                                                                                                                  41
Experienced Board of Directors with broad industry knowledge and
presence – independent Chair and two independent Board Members
Wallenius Wilhelmsen Board of Directors
Chair of the Board
Håkan Larsson
• Chair of the SteerCo for the WW ASA
and Wallenius JVs 2013-2017
• Past CEO for Rederi AB Transatlantic and
of Schenker AG
Member of the Board Member of the Board Member of the Board Member of the Board
Marianne Lie Thomas Wilhelmsen Jonas Kleberg Margareta Alestig
• Board member Noreco ASA, Cecon • Group CEO Wilh. Wilhelmsen • Chairman and CEO Rederi AB Soya • Deputy Managing Director for the
ASA, Nordic American Tankers Ltd, Holding ASA Sixth Swedish National Pension
Nordic American Offshore Ltd Fund
• Past CEO Norwegian Shipowners’ • Past CFO for Broström AB, JCE
Association Group AB and Swisslog AB
42You can also read