Reach the people you need to know.

 
CONTINUE READING
Reach the people you need to know.
SOUTH AFRICAN CITIZENS SURVEY
CORE REPORT – QUARTER ONE ( January-March) 2019
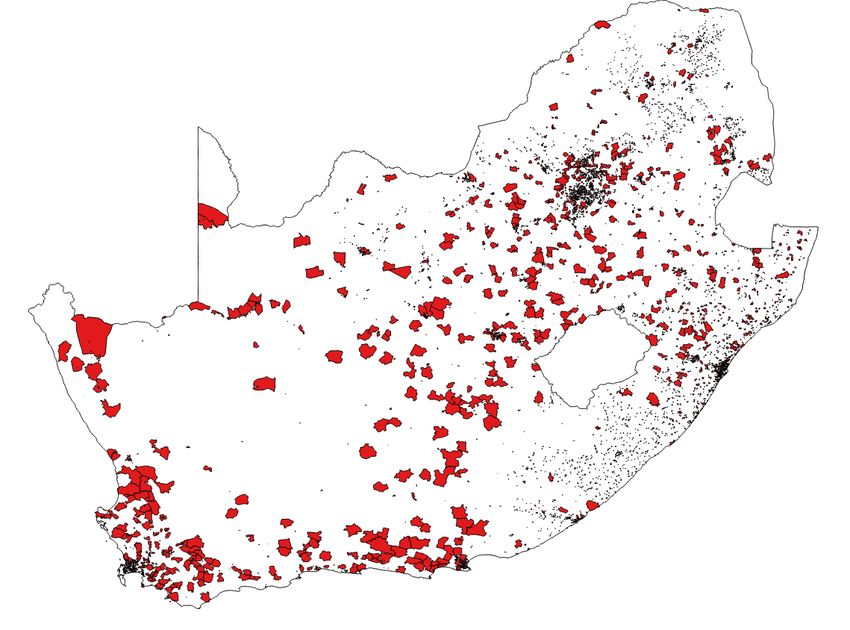
Reach the people you need to know.
TABLE OF CONTENTS

 SECTION                                                                           PAGE

 ONE: Background and Sample                                                         4

 TWO: Key Findings                                                                  8

 THREE: Direction of the Country, and Economic Perceptions                         13

 FOUR: Political Parties and Key Leaders                                           17

 FIVE: The Electoral Commission, Voter Registration, and Estimated Voter Turnout   30

 SIX: Most Important Problems Facing the Country                                   47

 SEVEN: Trust in Institutions                                                      51

Original data and written content:
© 2019 Citizen Surveys. All rights reserved.
                                                                                          3
Reach the people you need to know.
SECTION ONE
BACKGROUND AND SAMPLE
Reach the people you need to know.
BACKGROUND TO THE STUDY

THE SURVEY                                                                        THE SAMPLE

 Citizen Surveys has been carrying out the South African Citizens Survey          Designed as a complex, multi-stage stratified probability sample, based on
    (SACS) since July 2015. In total, just under 60,000 interviews.                 the Census EA sample frame.

 Face-to-face interviews are conducted on computer tablets with a                 Sampling sites are chosen at random across all provinces and metro,
    nationally-representative sample of 1,300 South African adults (i.e. 18         urban and rural areas, with probability proportionate to population size,
    years of age and older) per month.                                              based on the latest Stats SA estimates of the population aged 18+.

 Interviews are conducted in English, Zulu, Xhosa, Afrikaans, Sotho, Sepedi,      Results are reported quarterly on a total of 3,900 respondents, which
    and Setswana.                                                                   produces results with a margin of error margin of error of ±1.5
                                                                                    percentage points at the 95% confidence level.
 The SACS covers a range of current issues. Citizen Surveys invites
    researchers from universities and non-profit organizations to access the       Weights are applied to ensure the sample represents the most recent
    data free of charge – subject to usage conditions – by visiting our website     national population with respect to province, race, gender, age, and area.
    (https://citizensurveys.net/sa-citizens-survey and clicking on Request Our
    Data), or contacting us on +27 (0)21 447 4484.

                                    1,300      INTERVIEWS PER MONTH                           3,900          INTERVIEWS PER QUARTER

Original data and written content:
© 2019 Citizen Surveys. All rights reserved.
                                                                                                                                                            5
Reach the people you need to know.
BACKGROUND TO THE STUDY
WHERE WERE THE INTERVIEWS CONDUCTED ?

 Over the course of the South African Citizens
    Survey, just over 11,000 Enumerator Areas
    were covered in order to ensure that all
    South Africans – from the cities, towns,
    villages and remotest regions of South Africa
    – had the opportunity to have their voices
    heard.

 Alongside is a map of all the Enumerator
    Areas where, during the course of the past 3
    years, just over 50,000 interviews were
    conducted.

 This coverage, combined with our scientific
    sampling and rigourous quality controls,
    means that the data used for this report
    represents all South Africans, and can be
    relief upon for crucial and strategic decisions.

Original data and written content:
© 2019 Citizen Surveys. All rights reserved.
                                                       6
Reach the people you need to know.
ABOUT CITIZEN SURVEYS

 Citizen Surveys, founded in 1996, operates both
    nationally and internationally and has a broad
    selection of clients including international
    corporates, public institutions, government
    departments, academic institutions, NGOs, and
    development agencies.

 We specialize in research that has a social impact,
    and in large-scale national household surveys,
    continuous tracking studies, customer satisfaction
    surveys and segmentation modelling.

 Our robust, scientific methods and quality
    management systems deliver superior quality
    information and insights that can be trusted.

 Most of our business stems from repeat business
    and client recommendations.

 Some of our clients include:

Original data and written content:
© 2019 Citizen Surveys. All rights reserved.
                                                         7
Reach the people you need to know.
SECTION TWO
 KEY FINDINGS
Reach the people you need to know.
KEY FINDINGS
DIRECTION OF THE COUNTRY

 The first quarter of 2019 follows the downward trend in public opinion          Eskom’s load-shedding has had a major impact on public opinion about
    about the direction in which the country is headed. In March 2019 ( (when      the direction in which the country is headed and that corruption and state
    Eskom implemented Stage 4 load-shedding) the number of South Africans          looting is increasing, all the way through to the potential electoral
    who believed the country is headed in the right direction dropped to 22% .     performance of the ANC.

 The current level of pessimism is similar to that recorded in the last six        Trust in Eskom dropped to 49% in February and declined further to
    months of Zuma’s rule, a period where the country was at its lowest point         39% in March, with the onset of Stage 4 load-shedding. While levels of

    in the past 25 years.                                                             trust in other state institutions have been stable during this quarter,
                                                                                      the overall trend remains one of declining trust.
 Perceptions of a weakening economy and a declining standard of living
                                                                                    Trust in the Electoral Commission grew the most (+12%) to 60%.
    continued during the first quarter of 2019. Only one-quarter (24%) of
    South African adults reported an improvement in personal living               The impact of load-shedding, a stagnant economy, a stubborn
    conditions, while an even smaller group (21%) believed the economy had         unemployment rate and deepening revelations of the extent of state
    improved over the past 12 months.                                              looting continue to undermine the public’s confidence in the political
                                                                                   process.
 While many South Africans remain hopeful about the economy improving
    in the future, there has been a quarter-on-quarter decline over the course    These dynamics, coupled with the decline in the credibility of the organs
    of 2018. When Cyril Ramaphosa became president, optimism about the             of state and pillars of South African society, threaten to overshadow the
    future of the economy rose to 61%. A year later, however, it is down to        achievements of our democracy, and are more than just evidence of a
    47%.                                                                           worrying trend that does not bode well for the future of our country.

Original data and written content:
© 2019 Citizen Surveys. All rights reserved.
                                                                                                                                                            9
Reach the people you need to know.
KEY FINDINGS
POLITICAL PARTY AFFINITY AND SUPPORT

 Despite a decline in job performance ratings, from 68% (in April, May and
    June) to 61% in March 2019, President Ramaphosa remains the most
    popular political party leader polled over the past 12 months.

 Between January and February 2019, there was a drop of 6% in
    Ramaphosa’s job approval rating. In March it returned to 61%, however.
    We can therefore infer that perceptions of Ramaphosa’s job performance
    were unscathed by Eskom’s load-shedding in March 2019.

 The biggest challenge for Ramaphosa is whether he will be able to
    maintain the public’s confidence into the 2019 elections, as much more       INSERT PICTURE(S) HERE
    time may be needed to fix the deep-rooted problems that face him.

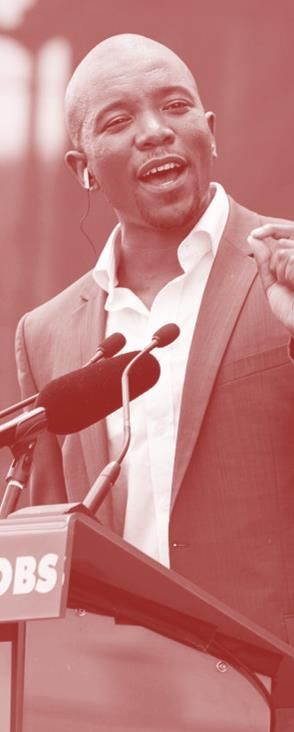
 The popularity of the opposition DA leader, Mmusi Maimane, has been on
    a gradual downward trajectory since mid 2017, and currently stands at
    28%.

 In contrast, the EFF leader, Julius Malema’s popularity continues to grow.
    At 27% in the first quarter of 2019, he is almost neck-on neck with the DA
    leader.

Original data and written content:
© 2019 Citizen Surveys. All rights reserved.
                                                                                                          10
SECTION THREE
DIRECTION OF THE COUNTRY AND ECONOMIC PERCEPTIONS
DIRECTION OF THE COUNTRY

The first quarter of 2019 follows the downward trend in public opinion about the direction in which the country is headed. In the last half of 2018, perceptions of the
country heading in the right direction dropped to around 27%. It picked up to 30 % in January and remained constant in February 2019, when we had the State of the
Nation Address and the Budget Speech. However, a significant drop to 22% occurred in March (when Eskom implemented Stage 4 load-shedding). The current level of
pessimism is similar to that recorded in the last six months of Zuma’s rule, a period where the mood of the country was at its lowest point in the past 25 years.

DIRECTION OF THE COUNTRY
WOULD YOU SAY THE COUNTRY IS GOING IN THE RIGHT DIRECTION OR IN THE WRONG DIRECTION ?
                                                                                                  Cyril Ramaphosa                                      SONA: Ramaphosa
                                             Thuli                                                                              Commissions of
                                                                                                      becomes                                         commits to bringing
                                          Madonsela’s                                                                          enquiry into State
                                                                                                      president                                         perpetrators of
                                         State Capture                                                                         Capture starts; SA
                                                                                                                                economy enters          State Capture to
   39%                                                                                                                                                                         Eskom’s
                                    38% Report released                                                              37%      technical recession            justice
                    36%                                                                                                                                                       nationwide
                                                                    Finance Minister                                                                                            Stage 4
                                                           34%                                         34%
                                                                    Pravin Gordhan                                                                                          load-shedding
   RIGHT                                        29%                    dismissed                                                                       30%        30%
                                                                                                                                 28%
   DIRECTION                                                                                                                                 27%
                                                                                   23%      23%                                                                                 22%
                                                                        19%

                                                                                                                                            2018      2019
                                                                                                                                     QUARTERS         MONTHS

 Q1 2016          Q2 2016         Q3 2016      Q4 2016    Q1 2017     Q2 2017    Q3 2017   Q4 2017    Q1 2018       Q2 2018    Q3 2018      Q4 2018   Jan 2019   Feb 2019      Mar 2019

Original data and written content:
© 2019 Citizen Surveys. All rights reserved.
                                                                                                                                                                               12
TRUST IN ESKOM

 Despite revelations that Eskom had been compromised by state-capture, trust in Eskom remained relatively stable between April 2018 and January 2019 at
    around 55% . However, with the onset of load-shedding in February 2019, the impact of state-capture was directly experienced by all households and businesses
    in South Africa, and the entire economy suffered its consequences. Trust in Eskom dropped to 49% in February and declined further to 39% in March, with the
    implementation of stage-four load-shedding.

 Load-shedding has had a major and negative impact on the public’s perceptions of the direction in which the country is heading and the belief that corruption is
    increasing, all the way through to the potential electoral performance of the ANC.

    TRUST IN: ESKOM
    HOW MUCH TRUST, IF ANY, DO YOU HAVE IN… ?

                                                                     56%                         56%
                      55%
                                                53%
                                                                                                                        49%

                                                                                                                                                 39%
                                                                             2018        2019
                                                                     QUARTERS            MONTHS

                   Q2 2018                     Q3 2018             Q4 2018                      Jan 2019              Feb 2019                  Mar 2019

Original data and written content:
© 2019 Citizen Surveys. All rights reserved.
                                                                                                                                                              13
THE MOST IMPORTANT PROBLEMS FACING SOUTH AFRICA
PERCEPTIONS OF CORRUPTION

 South Africans’ perceptions of corruption have
                                                         PERCEPTIONS OF CORRUPTION
    increased with the continuing revelations of         IN YOUR OPINION, IS THE LEVEL OF CORRUPTION IN SOUTH AFRICA INCREASING,
                                                         STAYING THE SAME, OR DECREASING?
    State Capture and corruption, and their adverse
                                                                                                                                                                    Eskom’s
    impact on the country.                                                                                Zondo                                                    nationwide
                                                                                                      Commission of                                                  Stage 4
                                                                                      Nugent
 The proportion of the adult population who                                       Commission of      Inquiry begins                                             load-shedding
                                                                   President
    believe corruption in South Africa is on the rise,            Ramaphosa        Inquiry begins
                                                                admits SOEs are
    grew significantly from 59% in April 2018 to 79%                                                                           81%      81%
                                                                   ‘sewers of                                          80%                                            79%
    in March 2019.                                                corruption’                               77%
                                                                                                    74%                                           75%
 Eskom’s Stage 4 load-shedding, largely due to the                                     72%
                                                                                                                                                             70%
    looting of Stage coffers, provided a first-hand
                                                                               67%
    experience of the debilitating impact of state
    capture on both the economy and the daily lives                                                                                                  SONA: Ramaphosa
    of the entire population.                                                                                                                       commits to bringing
                                                                 59%                                                                                  perpetrators of
                                                                 INCREASING                                                                           State Capture to
                                                                                                                                                           justice

                                                          Mar 2018 Apr 2018 May 2018 Jun 2018   Jul 2018   Aug 2018 Sep 2018 Nov 2018 Dec 2018   Jan 2019   Feb 2019 Mar 2019

Original data and written content:
© 2019 Citizen Surveys. All rights reserved.
                                                                                                                                                                    14
PERCEPTIONS OF THE ECONOMY

 The overall trend over the past two years         PAST ECONOMIC PERFORMANCE
                                                    THE ECONOMY HAS IMPROVED OVER THE PAST 12 MONTHS
    indicates that the majority of South Africans
    do not believe the economy is improving.

 As of the first quarter of 2019, only one-in-
    five citizens (21%) felt the economy had             25%      19%                                  21%        22%       20%
                                                                              19%        20%                                         17%       21%
    improved over the past 12 months.

 The graphs show that people generally tend         Q1 2017    Q2 2017     Q3 2017     Q4 2017        Q1 2018   Q2 2018   Q3 2018   Q4 2018    Q1 2019
    to be more hopeful about the economy
    improving in the future. However, over the
    course of 2018, there has been a quarter-on-    FUTURE ECONOMIC PERFORMANCE
    quarter decline in hopefulness.                 THE ECONOMY WILL IMPROVE OVER THE NEXT 12 MONTHS

 When Cyril Ramaphosa became president at
                                                                                                                  58%
    the beginning of 2018, optimism about the                                                          61%                  52%      48%
                                                                                          46%                                                  47%
                                                         36%      34%         42%
    future of the economy rose to 61%. A year
    later, however, it stands at 47% (comparable
    to the last quarter of 2017, when Zuma was
    unseated).                                       Q1 2017    Q2 2017     Q3 2017     Q4 2017        Q1 2018   Q2 2018   Q3 2018   Q4 2018    Q1 2019

Original data and written content:
© 2019 Citizen Surveys. All rights reserved.
                                                                                                                                               15
PERCEPTIONS OF PERSONAL LIVING CONDITIONS

 We asked South Africans whether or not           PERSONAL LIVING CONDITIONS OVER PAST 12 MONTHS
                                                   IMPROVED OVER THE PAST 12 MONTHS
    their personal living conditions had
    improved over the past 12 months, and
    whether they believed it would improve
    over the coming year.                               25%      23%         25%       28%       28%       26%       26%      24%       24%

 Just under one-quarter of (24%) of South
    Africans felt that their personal living        Q1 2017     Q2 2017    Q3 2017    Q4 2017   Q1 2018   Q2 2018   Q3 2018   Q4 2018    Q1 2019
    conditions had improved in the past year.

 In line with optimism about the future of
    the economy, the graphs show that people
                                                   PERSONAL LIVING CONDITIONS WILL IMPROVE OVER NEXT 12
                                                   MONTHS
    also tend to be more hopeful about their
    personal living conditions improving in the                                                 67%        62%       60%      58%       63%
                                                                             54%       57%
    future.                                             45%      45%

 In quarter one of 2019, roughly six-in-ten
    citizens (63%) said they believe their
    personal living conditions will improve over    Q1 2017     Q2 2017    Q3 2017    Q4 2017   Q1 2018   Q2 2018   Q3 2018   Q4 2018    Q1 2019

    the coming year.

Original data and written content:
© 2019 Citizen Surveys. All rights reserved.
                                                                                                                                        16
SECTION FOUR
POLITICAL PARTIES AND KEY LEADERS
PERFORMANCE OF PRESIDENT RAMAPHOSA

 Between January and February 2019, we observe a drop of 6% in President Ramaphosa’s job approval rating. In March, however, his rating jumps back to 61%. We
    can therefore infer that Ramaphosa’s job approval rating was unscathed by Eskom’s load-shedding in March 2019.

 Nonetheless, the trend shows that while the President’s job approval rating is currently above the 60% mark, it is well below the high of 68% he achieved at the
    height of Ramaphoria.

PERFORMANCE OF THE PRESIDENT
THE PRESIDENT IS DOING HIS JOB WELL / VERY WELL
                                                                                                                                        68% 68% 68%
                                                                                                                                                      64%                   65%
                                                                                                                                  64%
                                                                                                                                                            61% 62%                     62%         61%
                                                                                                                                                                      59%         60%
                                                                                                                                                                                              56%

40%                 40% 41% 39%
             37%
                                                          35% 36% 36%                               35%
      33%                               33% 32% 33% 33%
                                                                                                          30%
                                                                                        27%
                                                                        24% 25%               23%               23% 22% 24% 22%
                                                                                  22%

Mar Apr May Jun Jul Aug Sep Oct Nov Dec Jan Feb Mar Apr May Jun Jul Aug Sep Oct Nov Dec Jan Feb Mar Apr May Jun Jul Aug Sep Oct Nov Dec Jan Feb Mar
2016 2016 2016 2016 2016 2016 2016 2016 2016 2016 2017 2017 2017 2017 2017 2017 2017 2017 2017 2017 2017 2017 2018 2018 2018 2018 2018 2018 2018 2018 2018 2018 2018 2018 2019 2019 2019

                                                                                                                 JACOB ZUMA | CYRIL RAMAPHOSA

Original data and written content:
© 2019 Citizen Surveys. All rights reserved.
                                                                                                                                                                                              18
DEMOGRAPHIC PROFILE: Q1 2019
SOUTH AFRICAN ADULTS ( 18+ ) WHO BELIEVE THAT THE PRESIDENT IS DOING HIS JOB “WELL / VERY WELL”

POPULATION GROUP                               LIVING STANDARDS MEASURE    TOTAL SOUTH AFRICANS

             BLACK
                                                10      1,344,000 (6%)     22.43-million               GT
                                                                                                                             LM

                                                                           61%
              17,836,000 (80%)                                                                                               2,551,000 (11%)
                                                                                                       7,162,000 (32%)
             COLOURED                           09      2,007,000 (9%)
              1,798,000 (8%)
                                                08      1,716,000 (8%)                                                            MP
             INDIAN                                                                                     NW                        1,891,000 (8%)
              575,000 (3%)                      07      2,892,000 (13%)                                 1,729,000 (8%)

             WHITE                              06      7,476,000 (33%)
              2,222,000 (10%)                                                                                  FS                  KZ
                                                05      3,945,000 (18%)                 NC                     1,184,000 (5%)      2,390,000 (11%)
                                                                                        441,000 (2%)
AGE GROUP                                       04      2,143,000 (10%)

  18-24            4,708,000 (21%)              03      545,000 (2%)
                                                                                                             EC
                                                02      281,000 (1%)
                                                                                                             2,449,000 (11%)
  25-34            6,093,000 (27%)
                                                                                   WC                                                      GEOTYPE
                                                01      82,000 (0%)
                                                                                   2,634,000 (12%)
                                                                                                                         METRO
  35-44            4,639,000 (21%)                                                                                       9,794,000 (44%)
                                               GENDER
                                                        FEMALE                                                           URBAN
  45-54            3,060,000 (14%)                      11,100,000 (49%)                                                 4,198,000 (19%)

                                                        MALE                                                             RURAL
  55+              3,930,000 (18%)                      11,331,000 (51%)                                                 8,438,000 (38%)

Original data and written content:
© 2019 Citizen Surveys. All rights reserved.
AFFINITY TOWARDS POLITICAL LEADERS
FAVOURABILITY RATINGS

 President Ramaphosa’s favourability ratings         AFFINITY TOWARDS POLITICAL LEADERS
                                                      HAVE A FAVOURABLE OPINION OF LEADER
    have remained relatively stable over the past
    three quarters. He also appears to have
    emerged unscathed from the Eskom crisis in                                                                                 64%
    March, with his favourability rating increasing                                                                    60%
                                                                                                                                                        57%
    from 55% in the last quarter of 2018 to 57%                                                                                        56%     55%
    in the first quarter of 2019.
                                                                                                               47%
 Mmusi Maimane and Julius Malema continue
    to battle for the second spot.                     38%                     37%
                                                                                                 37%    44%
                                                                35%   35% 35%            35%
 However, Julius Malema is enjoying                   31%                                              31%    33%     32%     32%     31%
                                                                29%             35%              34%                                           29%
    consistent growth in favourability, while                           34%              34%                                                            28%
                                                                                                               28%      26%
                                                                                                22%     30%                    31%
    Mmusi Maimane’s favourability rating has                                   29%       30%                                           29%     30%
                                                       27%      28%                                                                                     27%
    been declining gradually since mid-2017                                                                    25%     25%
                                                                                                        25%
                                                                                22%              22%
    (where he enjoyed the highest favourability                 21%     20%              19%
    rating of all major political leaders),            16%
                                                      Q1 2016 Q2 2016 Q3 2016 Q4 2016 Q1 2017 Q2 2017 Q3 2017 Q4 2017 Q1 2018 Q2 2018 Q3 2018 Q4 2018 Q1 2019

                                                               JACOB ZUMA             CYRIL RAMAPHOSA          MMUSI MAIMANE            JULIUS MALEMA

Original data and written content:
© 2019 Citizen Surveys. All rights reserved.
                                                                                                                                                        20
KEY FINDINGS
POLITICAL PARTY AFFINITY AND SUPPORT

 Party support and affinity remain relatively flat for the three main political
    parties.

 In the first quarter of 2019, those who feel close to the ANC increased
    slightly to 35%, corresponding with the increase in the favourability rating
    of President Ramaphosa.

 Partisanship levels remain at 7% for the DA and 6% for the EFF.

 The favourability of the ANC has remained stable over the past six months
    around 55%, while preference for the ANC remains at 44%.
                                                                                   INSERT PICTURE(S) HERE
 In quarter one of 2019, the favourability score of the DA remained flat at
    31%. Similarly, preference for the party remained at 14%.

 The EFF shows a similar flat trend, with a favourability score remaining at
    28% and a preference score remaining at 10%.

 The ANC, however, continues to benefit from Ramaphosa being at the
    helm of the party and the country. Over the past 12 months, the ANC’s
    support has grown from 43% to 55%, while preference for the ANC has
    increased from 37% to 44%.

Original data and written content:
© 2019 Citizen Surveys. All rights reserved.
                                                                                                            21
AFFINITY TOWARDS POLITICAL PARTIES

 We use three measures to gauge political party affinity: feeling close to a                                   FEEL CLOSE TO THE PARTY
    party (partisanship), likeability/favourability, and party preference.                             39%              38%              35%                              35%
                                                                                      32%                                                                33%

 Partisanship: This is one of the strongest measures of political party               7%               8%
                                                                                                        5%            5%7%             7%7%             5% 7%        6%    7%
                                                                                       4%
    support. In the first quarter of 2019, the proportion of South Africans who
    feel close to the ANC increased slightly to 35%, corresponding with the          Q4 2017          Q1 2018          Q2 2018          Q3 2018         Q4 2018         Q1 2019
    increase in the favourability rating of President Ramaphosa. The DA’s
    partisanship level remained flat, at 7%, while the EFF’s partisanship                                              LIKE THE PARTY
                                                                                                                                           64%          58%
    remains around 6%.                                                             50%         52%                               53%                              56%      55%
                                                                                                        42%           43%
                                                                                                                                                                  31%      31%
 Favourability: The favourability of the ANC has remained relatively stable        29%        29%        32%         32%        31%        34%         30%
    over the past six months, around 55%. The DA and EFF’s favourability                                                                   31%          29%       29%      28%
                                                                                               19%      20%           23%        23%
                                                                                   15%
    ratings have also remained relatively unchanged.
                                                                                  Q1 2016   Q2 2016    Q3 2017    Q4 2017     Q1 2018    Q2 2018    Q3 2018     Q4 2018   Q1 2019

 Party Preference: Over the past three quarters preference for each of the
                                                                                                         PREFER THE PARTY ABOVE OTHERS
    three major parties have been relatively stable.
                                                                                   44%         45%                               44%       47%          43%       44%      44%
                                                                                                        36%           37%

                                                                                    18%                   19%         19%                                         13%      14%
                                                                                               18%                               16%        12%         12%
                                                                                     8%         12%       9%           11%        9%        9%          11%       10%      10%
                                                                                  Q1 2016   Q2 2016    Q3 2017    Q4 2017     Q1 2018    Q2 2018    Q3 2018     Q4 2018   Q1 2019

Original data and written content:
© 2019 Citizen Surveys. All rights reserved.
                                                                                                                ANC              DA               EFF
                                                                                                                                                                        22
AFFINITY TOWARDS THE ANC

 The proportion of South African adults who feel close to the ANC has been   FEEL CLOSE TO THE PARTY
    stable over the past three quarters, and is currently at 35%.
                                                                                                39%          38%

                                                                              35%
                                                                                                                             35%             33%            35%
 A similar trend emerges when examining both the favourability of the
                                                                                               Q1 2018      Q2 2018         Q3 2018         Q4 2018     Q1 2019
    party and a combined measure of ‘like and prefer the ANC’.

 Moreover, all other political parties also remain flat.                     LIKE THE PARTY
                                                                                           50%        52%                    53%      64%     58%     56%     55%

                                                                              55%
 The infographic overleaf shows the demographic profiles of South African                                  42%       43%

    adults who feel closest to the ANC, highlighting that:
                                                                                          Q1 2016 Q2 2016 Q3 2017 Q4 2017 Q1 2018 Q2 2018 Q3 2018 Q4 2018 Q1 2019
     the ANC has the highest proportion of female supporters in
        comparison to the other political parties.                            PREFER THE PARTY
     While the party has limited support amongst the upper-middle classes,                44%        45%   36%       37%    44%      47%     43%     44%     44%

        it enjoys significant support among the working class and the poor.   44%         Q1 2016 Q2 2016 Q3 2017 Q4 2017 Q1 2018 Q2 2018 Q3 2018 Q4 2018 Q1 2019
     While support comes from metro, urban and rural areas, it is weighted
        towards peri-urban and rural areas.
                                                                              LIKE & PREFER THE PARTY
                                                                                           41%        43%                    40%      44%     40%     41%     40%

                                                                              40%
                                                                                                            32%       33%

                                                                                          Q1 2016 Q2 2016 Q3 2017 Q4 2017 Q1 2018 Q2 2018 Q3 2018 Q4 2018 Q1 2019

Original data and written content:
© 2019 Citizen Surveys. All rights reserved.
                                                                                                                                                             23
DEMOGRAPHIC PROFILE: Q1 2019
SOUTH AFRICAN ADULTS ( 18+ ) WHO FEEL CLOSEST TO ANC

POPULATION GROUP                               LIVING STANDARDS MEASURE   TOTAL SOUTH AFRICANS

             BLACK
                                                10      185,000 (1%)      13.07-million               GT
                                                                                                                            LM

                                                                          35%
              12,437,000 (95%)                                                                                              1,593,000 (12%)
                                                                                                      3,835,000 (29%)
             COLOURED                           09      516,000 (4%)
             338,000 (3%)
                                                08      665,000 (5%)                                                             MP
             INDIAN                                                                                    NW                        1,348,000 (10%)
             196,000 (2%)                       07      1,483,000 (11%)                                964,000 (7%)

             WHITE                              06      4,274,000 (33%)
             99,000 (1%)                                                                                      FS                  KZ
                                                05      3,171,000 (24%)                NC                     718,000 (5%)        1,688,000 (13%)
                                                                                       263,000 (2%)
AGE GROUP                                       04      1,676,000 (13%)

  18-24            1,820,000 (14%)              03      860,000 (7%)
                                                                                                            EC
                                                02      224,000 (2%)
                                                                                                            2,067,000 (16%)
  25-34            3,390,000 (26%)
                                                                                  WC                                                      GEOTYPE
                                                01      18,000 (0%)
                                                                                  594,000 (5%)
                                                                                                                        METRO
  35-44            2,901,000 (22%)                                                                                      5,031,000 (38%)
                                               GENDER
                                                        FEMALE                                                          URBAN
  45-54            2,131,000 (16%)                      7,285,000 (56%)                                                 3,063,000 (23%)

                                                        MALE                                                            RURAL
  55+              2,827,000 (22%)                      5,786,000 (44%)                                                 4,976,000 (38%)

Original data and written content:
© 2019 Citizen Surveys. All rights reserved.
AFFINITY TOWARDS THE DA

 The number of South Africans who feel close to the DA has remained flat       FEEL CLOSE TO THE PARTY
    at 7%. Similarly, those who are favourable towards the party has

                                                                                 7%
                                                                                                  8%           7%             7%              7%             7%
    remained stable at 31%.

 While the proportion of citizens who prefer the DA has been dropping off                       Q1 2018     Q2 2018         Q3 2018         Q4 2018     Q1 2019

    since the period of the #ZumaMustFall campaign, it has remained stable
                                                                                LIKE THE PARTY
    between 12% and 14% for over a year. In conjunction with this, those who
                                                                                             29%       29%   32%       32%    31%      34%     30%     31%    31%

                                                                                31%
    both like and prefer the DA has also remained unchanged.

 The info-graphic overleaf shows the demographic profiles of South African                 Q1 2016 Q2 2016 Q3 2017 Q4 2017 Q1 2018 Q2 2018 Q3 2018 Q4 2018 Q1 2019

    adults who feel closest to the DA, highlighting that:
                                                                                PREFER THE PARTY
     The DA enjoys the highest level of support among the upper middle-
                                                                                             18%       18%   19%       19%

                                                                                14%
        class.                                                                                                                16%      12%     12%     13%    14%

     The largest constituency within the DA is African, followed by an equal               Q1 2016 Q2 2016 Q3 2017 Q4 2017 Q1 2018 Q2 2018 Q3 2018 Q4 2018 Q1 2019

        split between Coloured and White South Africans. This makes the DA
        the most racially diverse of all the political parties.                 LIKE & PREFER THE PARTY

     Their main base of support is Metro areas.                                             17%       16%   17%       18%

                                                                                12%
                                                                                                                              14%      11%     10%     11%    12%

     Unsurprisingly, the two provinces where the majority of their
                                                                                            Q1 2016 Q2 2016 Q3 2017 Q4 2017 Q1 2018 Q2 2018 Q3 2018 Q4 2018 Q1 2019
        supporters reside are Western Cape and Gauteng.

Original data and written content:
© 2019 Citizen Surveys. All rights reserved.
                                                                                                                                                              25
DEMOGRAPHIC PROFILE: Q1 2019
SOUTH AFRICAN ADULTS ( 18+ ) WHO FEEL CLOSEST TO DA

POPULATION GROUP                               LIVING STANDARDS MEASURE   TOTAL SOUTH AFRICANS

             BLACK
                                                10      434,000 (16%)
                                                                          2.77-million                GT
                                                                                                                           LM

                                                                          7%
              1,135,000 (41%)                                                                                              247,000 (9%)
                                                                                                      730,000 (26%)
             COLOURED                           09      330,000 (12%)
              789,000 (28%)
                                                08      233,000 (8%)                                                            MP
             INDIAN                                                                                    NW                       321,000 (12%)
              59,000 (2%)                       07      426,000 (15%)                                  57,000 (2%)

             WHITE                              06      852,000 (31%)
              791,000 (29%)                                                                                   FS                 KZ
                                                05      321,000 (12%)                  NC                     120,000 (4%)       106,000 (4%)
                                                                                       113,000 (4%)
AGE GROUP                                       04      78,000 (3%)

  18-24           338,000 (12%)                 03      76,000 (3%)
                                                                                                            EC
                                                02      22,000 (1%)
                                                                                                            243,000 (9%)
  25-34           671,000 (24%)
                                                                                  WC                                                    GEOTYPE
                                                01                                837,000 (30%)
                                                                                                                      METRO
  35-44           789,000 (28%)                                                                                       1,447,000 (52%)
                                               GENDER
                                                        FEMALE                                                        URBAN
  45-54           418,000 (15%)                         1,328,000 (48%)                                               915,000 (33%)

                                                        MALE                                                          RURAL
  55+             558,000 (20%)                         1,445,000 (52%)                                               412,000 (15%)

Original data and written content:
© 2019 Citizen Surveys. All rights reserved.
PERFORMANCE OF DA LEADER
MMUSI MAIMANE

 Between 2016 and 2017, Mmusi Maimane’s performance score with
    respect to improving the image of the DA soared to 53%.                      LEADER IS IMPROVING THE PARTY'S IMAGE AMONGST VOTERS

 However, since the fall of Zuma, and Ramaphosa taking the helm of the                                                    51% 53%
                                                                                                           46% 46% 47% 47%         46%

                                                                                  39%
                                                                                                                                              41% 43% 44% 39%
    country, Maimane’s ratings have declined significantly and is presently at                   37% 41%

    39%.
                                                                                                  Q1   Q2   Q3   Q4   Q1   Q2   Q3   Q4   Q1   Q2   Q3   Q4   Q1
                                                                                                 2016 2016 2016 2016 2017 2017 2017 2017 2018 2018 2018 2018 2019
 Maimane’s favourability ratings have followed a similar trend. It is
    currently at 28%, the lowest it has been since the beginning of 2016.

                                                                                 LEADER’S FAVOURABILITY RATING

                                                                                                           34% 37% 35% 37% 31% 33% 32% 32% 31%

                                                                                  28%
                                                                                                 27% 28%                                       29% 28%

                                                                                                  Q1   Q2   Q3   Q4   Q1   Q2   Q3   Q4   Q1   Q2   Q3   Q4   Q1
                                                                                                 2016 2016 2016 2016 2017 2017 2017 2017 2018 2018 2018 2018 2019

Original data and written content:
© 2019 Citizen Surveys. All rights reserved.
                                                                                                                                                         27
AFFINITY TOWARDS THE EFF

 The proportion of South African adults who feel close to the EFF has         FEEL CLOSE TO THE PARTY
    remained flat since the beginning of 2018.

                                                                                6%
                                                                                                 5%           5%             7%              5%             6%
 While the EFF has been increasing in popularity over time , its growth has
    remained relatively unchanged over the past 12 months.                                      Q1 2018     Q2 2018         Q3 2018         Q4 2018     Q1 2019

 Preference for the EFF, has also remained relatively unchanged, while        LIKE THE PARTY
    those who both like and prefer the party follows the same trend.                                  19%   20%       23%    23%      31%     29%     29%    28%

                                                                               28%
                                                                                            15%

 The info-graphic overleaf shows the demographic profiles of South African
                                                                                           Q1 2016 Q2 2016 Q3 2017 Q4 2017 Q1 2018 Q2 2018 Q3 2018 Q4 2018 Q1 2019
    adults who feel closest to the EFF:

     Most notably, 97% of EFF supporters are African and two-thirds are       PREFER THE PARTY
        male.                                                                                         12%   9%        11%    9%       9%      11%     10%    10%
                                                                                             8%
     While the majority of their support comes from the working class, they   10%         Q1 2016 Q2 2016 Q3 2017 Q4 2017 Q1 2018 Q2 2018 Q3 2018 Q4 2018 Q1 2019
        also have a significant constituency among the lower-middle class.

     The EFF appeals to younger South Africans - over two-thirds of their
                                                                               LIKE & PREFER THE PARTY
        supporters are under 35 years of age.
                                                                                             7%       11%   8%        10%    8%       9%      10%     10%    10%

                                                                               10%         Q1 2016 Q2 2016 Q3 2017 Q4 2017 Q1 2018 Q2 2018 Q3 2018 Q4 2018 Q1 2019

Original data and written content:
© 2019 Citizen Surveys. All rights reserved.
                                                                                                                                                             28
DEMOGRAPHIC PROFILE: Q1 2019
SOUTH AFRICAN ADULTS ( 18+ ) WHO FEEL CLOSEST TO EFF

POPULATION GROUP                               LIVING STANDARDS MEASURE   TOTAL SOUTH AFRICANS

             BLACK
                                                10      46,000 (2%)
                                                                          2.17-million               GT
                                                                                                                            LM

                                                                          6%
              2,107,000 (97%)                                                                                               206,000 (10%)
                                                                                                     781,000 (36%)
             COLOURED                           09      58,000 (3%)
              42,000 (2%)
                                                08      216,000 (10%)                                                            MP
             INDIAN                                                                                   NW                         150,000 (7%)
              6,000 (0%)                        07      308,000 (14%)                                 225,000 (10%)

             WHITE                              06      701,000 (32%)
              11,000 (1%)                                                                                    FS                   KZ
                                                05      527,000 (24%)                  NC                    139,000 (6%)         342,000 (16%)
                                                                                       37,000 (2%)
AGE GROUP                                       04      206,000 (10%)

  18-24           812,000 (37%)                 03      40,000 (2%)
                                                                                                           EC
                                                02                                                         168,000 (8%)
  25-34           681,000 (31%)
                                                                                  WC                                                    GEOTYPE
                                                01                                118,000 (5%)
                                                                                                                      METRO
  35-44           354,000 (16%)                                                                                       933,000 (43%)
                                               GENDER
                                                        FEMALE                                                        URBAN
  45-54           259,000 (12%)                         746,000 (34%)                                                 528,000 (24%)

                                                        MALE                                                          RURAL
  55+             61,000 (3%)                           1,421,000 (66%)                                               706,000 (33%)

Original data and written content:
© 2019 Citizen Surveys. All rights reserved.
PERFORMANCE OF EFF LEADER
JULIUS MALEMA

 Malema’s growing favourability score is significant, nearly doubling from a
    base of 16% in the first quarter of 2016 to 30% in the final quarter of     LEADER IS IMPROVING THE PARTY'S IMAGE AMONGST VOTERS
    2018.                                                                                                                                    40% 39% 43%
                                                                                                                              35% 36% 37%                   35%

                                                                                 35%
 Julius Malema’s efforts at improving his party’s image have been                                    28% 27% 29% 28% 30%
                                                                                                22%
    successful, especially when viewed over time: from 22% in Q1 of 2016 to
                                                                                                 Q1   Q2   Q3   Q4   Q1   Q2   Q3   Q4   Q1   Q2   Q3   Q4   Q1
    35% in the current quarter.                                                                 2016 2016 2016 2016 2017 2017 2017 2017 2018 2018 2018 2018 2019

                                                                                LEADER’S FAVOURABILITY RATING
                                                                                                                                             31% 29% 30%
                                                                                                                          25% 25% 25%                    27%
                                                                                                      21% 20% 22% 19% 22%

                                                                                 27%
                                                                                                16%

                                                                                                 Q1   Q2   Q3   Q4   Q1   Q2   Q3   Q4   Q1   Q2   Q3   Q4   Q1
                                                                                                2016 2016 2016 2016 2017 2017 2017 2017 2018 2018 2018 2018 2019

Original data and written content:
© 2019 Citizen Surveys. All rights reserved.
                                                                                                                                                        30
MOST IMPORTANT PROBLEMS FACING SOUTH AFRICA
Q1 2019

 According to South Africans the most pressing issues             MOST IMPORTANT PROBLEMS
    requiring proactive attention, amongst a plethora of others,   IN YOUR OPINION, WHAT ARE THE THREE MOST IMPORTANT PROBLEMS FACING SOUTH AFRICA ?

    are unemployment, crime and corruption, poverty and
                                                                                           Unemployment                                                73% 27.5m
    destitution and basic service delivery.
                                                                                                     Crime                    34% 12.8m
 Unemployment, which remains stubbornly high at around                               Poverty / Destitution               25% 9.2m
    27%, was considered to be biggest problem facing the                                        Corruption               23% 8.7m
    country – as expressed by 27.5-million (73%) of South
                                                                                                   Housing          18% 6.8m
    Africans.
                                                                                              Water supply          18% 6.8m
 It is followed by Crime (34%), Poverty / Destitution (25%)                                     Education         14% 5.2m
    and Corruption (23%).                                                                            Roads        11% 4.1m
 The delivery of basic services (Housing, Water Supply,                                  Electricity supply      11% 4.1m
    Roads, Electricity) and Education continue to be burning                  Management of the Economy         7% 2.7m
    issues, as is evident by the increasing footprint of service                      Basic health services     7% 2.6m
    delivery protests around the country.                                         Immigrants / Xenophobia       6% 2.2m
                                                                    Economic inequality / Income inequality     6% 2.1m
                                                                                   Discrimination / Racism     4% 1.4m
                                                                                                 Sanitation    3% 1.1m

Original data and written content:
© 2019 Citizen Surveys. All rights reserved.
                                                                                                                                                         31
POLITICAL PARTY ASSOCIATION
WHICH POLITICAL PARTY IS ASSOCIATED WITH SOLVING THE MOST IMPORTANT PROBLEMS FACING SOUTH AFRICA

 We asked South Africans which political parties they
    believe to be best at solving the most critical problems
                                                                        POLITICAL PARTY ASSOCIATION
                                                                        WHICH POLITICAL PARTY IS BEST AT… ?
    facing the country, in order to determine their relative
    positioning.                                                                                          STRONG
                                                                                                      ASSOCIATION
 The perceptual map shows that the ANC is most closely
    associated with providing basic services (water, housing,                                                 Creating jobs
                                                                                               None
    electricity, maintaining roads). This is unsurprising as the
                                                                                                                     Reducing poverty
    ANC is the governing party.                                                                 Don't Know
                                                                                                                                         Maintaining roads

 In line with their election manifesto and public ranting, the                              Reducing crime     DA                             Providing water

    EFF is strongly associated with reducing corruption.           STRONG                                        WEAK                                            STRONG
                                                                                                                       Providing electricity
                                                                   ASSOCIATION                                ASSOCIATION                                    ASSOCIATION
 The perceptual positioning of the DA, however, reflects a
                                                                                                              Reducing income
    lack of clear policy and direction, with no strong links to                                                                         ANC
                                                                                                                 inequality
                                                                       Reducing corruption
    any of the country’s critical challenges.
                                                                                                                                               Providing housing
 Nonetheless, the most significant insight from this                           EFF                            Improving education
    perceptual map is that none of the political parties are
                                                                                                                       STRONG
    seen to be able to solve the most burning issues, such as                                                          ASSOCIATION
    unemployment, crime and poverty.

Original data and written content:
© 2019 Citizen Surveys. All rights reserved.
                                                                                                                                                                       32
SECTION FIVE
             VOTER READINESS MODEL
               TURNOUT SCENARIOS
POLITICAL PARTY ELECTORAL PERFORMANCE ESTIMATES
VOTER READINESS MODEL
OVERVIEW

VOTER READINESS MODEL                                                           VOTER READINESS MODEL (VRM)

 In the first iteration of the model we examined the impact of voter
                                                                                READY VOTERS
    registration challenges, voting-day challenges and the motivation to vote
                                                                                Citizens who are/believe they are registered to vote, are motivated to vote
    in order to establish the impact these factors may have on voter turnout.
                                                                                and find it very easy to get to the polling station (the main voting day
 After President Ramaphosa declared 8 May 2019 as the election date,           challenge).
    voter registration was closed in March 2019.
                                                                                LIKELY VOTERS
 This second iteration of the VRM model was adjusted accordingly, to
                                                                                Citizens who are/believe they are registered to vote, are motivated to vote
    account for registration closing – which simplified the model parameters
                                                                                and will find it fairly easy to get to the polling station (voting day challenge).
    significantly.

     With registration challenges out of the way, voters either know for       CHALLENGED VOTERS
        certain, or believe they are registered to vote.                        Those who are motivated to vote but likely to encounter difficulty in getting

     Voter motivation was established by asking “how much do you want to       to the polling station.

        vote in the election…?”
                                                                                UNMOTIVATED VOTERS
     The voting day challenges were assessed by determining the ease of
                                                                                Those who are not yet motivated to vote, regardless of whether they will face
        getting to the polling station, as the main voting day challenge.
                                                                                voting day challenges.

Original data and written content:
© 2019 Citizen Surveys. All rights reserved.
                                                                                                                                                           34
VOTER READINESS MODEL
FOUR VOTER SEGMENTS - MARCH 2019

 In order to estimate voter turnout, we took into account all preceding                 The IEC reports that there are just under 26.8-million registered voters,
    preconditions: motivation to vote, registration status, and the voting-day            while the SACS measures 26.5-million voters who claim to be registered.
    challenge (getting to the polling station). Collectively this allowed us to

1
                                                                                                            27-million
    divide Registered Voters into four segments:

                                                                        2
                                                                                                                 REGISTERED VOTERS

             VOTERS WHO ARE MOTIVATED,                   VOTERS WHO ARE MOTIVATED,

                                                                                                                17m (64%)
                                                                                                      1
      REGISTERED, AND FIND IT VERY EASY           REGISTERED, AND FIND IT FAIRLY EASY
         TO GET TO THE POLLING STATION                 TO GET TO THE POLLING STATION

                     READY VOTERS                LIKELY VOTERS                                                  READY VOTERS

4                                                                       3
                                                                                                                3.3m (12%)
   UNMOTIVATED VOTERS                            CHALLENGED VOTERS
                                                                                                      2         LIKELY VOTERS

                                                                                                                1.1-m (4%)
                                                                                                      3
  VOTERS WHO ARE NOT YET MOTIVATED               VOTERS WHO ARE MOTIVATED AND ,
  TO VOTE, REGARDLESS OF CHALLENGES              REGISTERED, BUT LIKELY TO
                                                 FACE CHALLENGES TO GET TO THE                                  CHALLENGED VOTERS
                                                 POLLING STATION

                                                                                                      4         5.1m (19%)
                                                                                                                UNMOTIVATED VOTERS

Original data and written content:
© 2019 Citizen Surveys. All rights reserved.
                                                                                                                                                              35
ESTIMATED VOTER TURNOUT
TOTAL VOTER POPULATION ( MARCH 2019 )

 In a scenario where the entire voter base (i.e. 37-million South Africans       TOTAL VOTER TURNOUT
    aged 18+) were to vote tomorrow:                                              ALL SOUTH AFRICAN ADULTS ( 18+ ) REGISTERED TO VOTE

     The ANC would receive 52% of the vote (19.4-million);
     The DA would receive 17% of the vote (6.4-million);                                                                 51%
                                                                                                                         13.5m
     The EFF would receive 11% of the vote (4.2-million); and
     Roughly 5% (1.7-million) would vote for the smaller parties.
                                                                                                  18%
 The undecided vote is of significance in modelling potential election                           4.8m
    results as undecided citizens constitute 14% (5.3-million people).
                                                                                            11%
 Since it is unlikely that entire voter population will go to the polls, it is             2.9m
    necessary to model potential voter turnout scenarios, using the VRSM
    model.                                                                                6%
                                                                                         1.7m

                                                                                              14%
                                                                                              3.7m                                         26.5m
                                                                                      ANC          DA           EFF          OTHER PARTY    UNDECIDED

Original data and written content:
© 2019 Citizen Surveys. All rights reserved.
                                                                                                                                                  36
ESTIMATED VOTER TURNOUT
SCENARIO ANALYSIS ( MARCH 2019 )

The High Voter Turnout scenario assumes that                   The Medium Voter Turnout scenario assumes                    The Low Voter Turnout scenario assumes only
all motivated voters 80% (21.0-million) go to                  Ready, Likely, and those Challenged voters who               Ready and Likely voters will vote, which results in
polls, irrespective of challenges facing them.                 can overcome voting day challenges, will vote.               a 64% turnout (17-million voters).
                                                               This place voter turnout at 76% (20-million
                                                               voters).

HIGH VOTER TURNOUT                                             MEDIUM VOTER TURNOUT                                         LOW VOTER TURNOUT
REGISTERED + MOTIVATED VOTERS                                  REGISTERED + MOTIVATED VOTERS WHO CAN FAIRLY                 REGISTERED + MOTIVATED VOTERS WHO CAN VERY EASILY
                                                               EASILY GET TO A POLLING STATION                              GET TO A POLLING STATION

                                            56%                                             58%                                                        60%
                                           12.1m                                           11.8m                                                      10.1m

              17%                                                         17%                                                         17%
              3.6m                                                        3.5m                                                        2.9m

          10%                                                        10%                                                          9%
          2.2m                                                       2.1m                                                        1.5m

       5%                                                          4%                                                           4%

                                               21.4m                                            20.3m                                                         17.0m
      1.0m                                                        846k                                                         757k

                                                                     10%
                                                   80%                                               76%                                                            64%
           12%                                                                                                                   10%
           2.5m                                                      2.1m                                                        1.7m

                                                         ANC        DA           EFF        OTHER PARTY         UNDECIDED

Original data and written content:
© 2019 Citizen Surveys. All rights reserved.
                                                                                                                                                                       37
SIDE-BY-SIDE COMPARISON OF SCENARIOS
SCENARIO ANALYSIS ( MARCH 2019 )

   TOTAL VOTER TURNOUT                            HIGH VOTER TURNOUT                  MEDIUM VOTER TURNOUT                      LOW VOTER TURNOUT
                 ALL REGISTERED VOTERS         REGISTERED AND MOTIVATED VOTERS        REGISTERED, MOTIVATED, CAN EASILY /   REGISTERED, MOTIVATED, VERY EASILY
                                                      IRRESPECTIVE OF CHALLENGES     VERY EASILY GET TO A POLLING STATION            GET TO A POLLING STATION

                        51%                                   56%                                     58%                                60%
                       13.5m                                 12.1m                                   11.8m                              10.1m

         18%                                       17%                                      17%                                 17%
         4.8m                                      3.6m                                     3.5m                                2.9m

      11%                                        10%                                      10%                                  9%
      2.9m                                       2.2m                                     2.1m                                1.5m

     6%                                          5%                                      4%                                    4%
    1.7m                                        1.0m                                    846k                                  757k

       14%                  26.5m                 12%             21.4m                   10%              20.3m               10%              17.0m
       3.7m                                       2.5m
                                                                          80%             2.1m
                                                                                                                 76%           1.7m
                                                                                                                                                      64%
                                                       ANC           DA        EFF     OTHER PARTY        UNDECIDED

Original data and written content:
© 2019 Citizen Surveys. All rights reserved.
                                                                                                                                                        38
SCENARIOS: POLITICAL PARTIES AND VOTER SUPPORT
IF THE GENERAL ELECTION WAS HELD TOMORROW WHO WOULD YOU VOTE FOR?

 Respondents were presented with a blind mock ballot on a computer                                     VOTER TURNOUT SCENARIOS AND PARTY SUPPORT
    tablet and asked to select the party they would vote for (simulating the
                                                                                                         Using the Voter-Readiness Model (VRM), we set about analysing various
    voting day experience in terms of the ballot and confidentiality) .
                                                                                                          voter turnout scenarios, based on the outcome of the mock ballot votes.
     The ten biggest political parties were listed, with an option for ‘other
                                                                                                         If voters who are registered and motivated to vote and would find it very
        political party’ .
                                                                                                          or fairly easy to get to the polling station, what would the election results
     Respondents, who after going through the exercise, could not choose a
                                                                                                          look like?
        political party, were recorded as ‘undecided’.
                                                                                                         Since there was no ‘undecided’ category on the ballot we reallocated
                                                                                                          undecided voters, using two factors, i.e. party preference and
                                                                                                          partisanship:

                                                                                                           Party Preference - imputed by comparing the scores of the party
                                                                                                             favourability scales, and allocating undecided voters to the party they rated
                                                                                                             highest in terms of favourability.

                                                                                                           Partisanship – determined from the political party they felt closest to.
                                        The voter turnout scenarios look at the proportion of
                                respondents who believe they are registered (26.5-million).              Undecided voters were allocated to the party they had the highest
                                 The IEC reports that 26.75-million* have registered to vote              preference for and felt closest to.

                                    www.elections.org.za/content/Voters-Roll/Registration-statistics/

Original data and written content:
© 2019 Citizen Surveys. All rights reserved.
                                                                                                                                                                                  39
KEY INSIGHTS
IF THE GENERAL ELECTION WAS HELD TOMORROW WHO WOULD YOU VOTE FOR?

TURNOUT SCENARIOS                                                               UNMOTIVATED VOTERS

 Voter turnout is likely to have the largest effect on the performance of       The proportion of unmotivated voters has increased from February to
    political parties at the polls.                                               March. Unmotivated voters are the least likely to turn out at the polls,
                                                                                  irrespective of challenges they may face.
 We observe that the higher the voter turnout, the lower the proportion of
    votes garnered by the ruling party, the ANC. The beneficiaries from a        If these unmotivated voters (or a portion thereof) were to decide at the
    higher voter turnout is the EFF and, to a less extent, the DA.                last minute to cast their ballot, the electoral performance of the ANC
                                                                                  would suffer.

UNDECIDED VOTERS                                                                 One of the imperatives for the opposition DA and EFF is therefore to

 Undecided voters account for 14% (3.7-million) of all registered voters and     attempt to motivate voters to the polls, as they stand to benefit the most.

    will be key to determining the performance of the three major political
    parties at the polls.

 In the Medium, and Low Turnout scenarios, the proportion of undecided
    voters drops to 10%, whereas in the High Turnout scenario it is 12%.

Original data and written content:
© 2019 Citizen Surveys. All rights reserved.
                                                                                                                                                       40
ALLOCATION OF THE UNDECIDED VOTERS
IMPUTATION METHODOLOGY

ALLOCATING UNDECIDED VOTERS                                                    TURNOUT SCENARIO AND UNDECIDED VOTERS

 In order to reasonably allocate the undecided voters we have used two         Voter turnout scenarios impacts upon the proportion of undecided
    factors:                                                                     voters (3.7-million or 14% of the registered voter base).
     Party Preference - calculated from the question “How much do you            In both the Low and Medium Turnout scenarios, 10% are undecided
        like or dislike…” which is measured on a scale ranging from 0 to 10.        while in the High turnout scenario 12%. It appears that the higher
        Preference is then imputed by comparing the “like / dislike” scores,        the voter, the higher the proportion of undecided voters.
        where the party that achieves the highest rating is deemed to be
                                                                                Therefore the more determined the potential voter is to cast their
        the preferred party.
                                                                                 ballot, the more likely they are to have a specific political party in
     Partisanship is determined by asking the question “Which political         mind.
        party do you feel close to (or closest to)?”
                                                                                Applying the methodologies of imputation of undecided voters as well
 We allocated the undecided voters to a party where they expressed a
                                                                                 as voter turnout scenarios, we trended the estimated political party
    Party Preference and / or Partisanship.
                                                                                 electoral performance over time (from December 2018 until March
     Partisanship is applied as a superordinate allocating factor.              2019).

Original data and written content:
© 2019 Citizen Surveys. All rights reserved.
                                                                                                                                                     41
LOW VOTER TURNOUT SCENARIO
TRENDED ELECTORAL PERFORMANCE ( DEC 2018 – MAR 2019 )

 The Low Voter Turnout (at 64%, or 17-million voters), trended from           LOW VOTER TURNOUT SCENARIO
    December 2018 until March 2019, shows that:
                                                                               64% (17-MILLION)

     The ANC hovers between 65% and 63%.
     The DA, after increasing slightly from 18% in December to 21% in                65%                         66%
                                                                                                   63%                           63%
        January, drops to 19% in February and 18% in March.

     The EFF has a small but steady increase in support, going up to 10% in
        March 2019.

 When comparing the Medium Turnout Scenario (20-million voters) to the
    Low Turnout Scenario (17-million), we can infer that the lower the voter
    turnout, the better it is for the ruling party.
                                                                                                   21%
                                                                                                                  19%            18%
                                                                                      18%

                                                                                                                                 10%
                                                                                      7%            7%            8%

                                                                                                    5%            4%             4%
                                                                                 5%
                                                                                      5%            4%
                                                                                                                  3%             4%
                                                                                 Dec 2018         Jan 2019      Feb 2019       Mar 2019

                                                                                       ANC   DA          EFF   OTHER PARTY   UNDECIDED

Original data and written content:
© 2019 Citizen Surveys. All rights reserved.
                                                                                                                                   42
MEDIUM VOTER TURNOUT SCENARIO
TRENDED ELECTORAL PERFORMANCE ( DEC 2018 – MAR 2019 )

 The Medium Voter Turnout (at 77%, or 20-million voters), trended from          MEDIUM VOTER TURNOUT
    December 2018 until March 2019, shows that:
                                                                                 77% SCENARIO (20-MILLION)

     The ANC drops from 64% in December down to 61% in March.
     The DA, after a slight increase in estimated electoral performance in             64%                         63%
                                                                                                     63%
                                                                                                                                   61%
        January, returns to 19% in February and March respectively .

     The EFF shows a steady increase in support to 9% in February and 11%
        in March 2019.

 Undecided voters, were they to cast their vote, may still have a significant
    impact on the electoral outcome – since they are neither partisan nor
    prefer a particular party, many of them may decide to cast their ballot in
                                                                                                     21%
    favour of other smaller parties.                                                    19%                         19%            19%

                                                                                                                                   11%
                                                                                                                    9%
                                                                                        7%            6%
                                                                                   6%                 5%            5%             4%
                                                                                                      5%
                                                                                        4%                          4%
                                                                                                                                    4%
                                                                                   Dec 2018         Jan 2019      Feb 2019       Mar 2019

                                                                                         ANC   DA          EFF   OTHER PARTY   UNDECIDED

Original data and written content:
© 2019 Citizen Surveys. All rights reserved.
                                                                                                                                     43
HIGH VOTER TURNOUT SCENARIO
TRENDED ELECTORAL PERFORMANCE ( DEC 2018 – MAR 2019 )

 The High Voter Turnout (at 81%, or 21-million voters), trended from          HIGH VOTER TURNOUT
    December 2018 until March 2019, shows that:
                                                                               81% SCENARIO (21-MILLION)

     The ANC drops from 64% in December to 60% in March.
     The DA, after seeing an increase in their estimated electoral                   64%
                                                                                                   63%            63%
                                                                                                                                 60%
        performance in January, drops to 18% in March.

     The EFF shows a steady increase in support to 9% in February and 11%
        in March 2019.

 In this scenario, undecided voters would also have a significant impact on
    the electoral outcome, if they were to cast their vote.

                                                                                                   21%
                                                                                      19%                         19%            18%

                                                                                                                                 11%
                                                                                                                  9%
                                                                                      7%            7%
                                                                                 6%                 5%            5%             4%
                                                                                                    5%
                                                                                      4%                          4%
                                                                                                                                  4%
                                                                                 Dec 2018         Jan 2019      Feb 2019       Mar 2019

                                                                                       ANC   DA          EFF   OTHER PARTY   UNDECIDED

Original data and written content:
© 2019 Citizen Surveys. All rights reserved.
                                                                                                                                   44
TOTAL VOTER TURNOUT SCENARIO
TRENDED ELECTORAL PERFORMANCE ( DEC 2018 – MAR 2019 )

 In some countries voting is compulsory. This analysis applies the ‘Total      TOTAL VOTER TURNOUT
    Voter Turnout scenario’ to see what the electoral performance would be if
                                                                                100% SCENARIO (27-MILLION)

    all registered voters (100% or 27-million registered voters) turned up at
    the polls.
                                                                                       63%
                                                                                                    61%
 The trended analysis from December 2018 until March 2019, shows that:                                            60%
                                                                                                                                  56%
     The ANC drops from 63% in December to 56% in January.
     The DA’s performance increases to 22% in January, but then drops to
        20% in February and remains at that level in March.

     The EFF declines to 7% in January, but grows to 10% in February and
        12% in March.
                                                                                                    22%
                                                                                       19%                         20%            20%
 This turnout scenario results in the lowest electoral performance score for
    the ANC (56%) and supports the hypothesis that a lower voter turnout                                                          12%
                                                                                                                   10%
    favours the ruling party.                                                          8%
                                                                                                     7%
                                                                                                     5%                           6%
                                                                                  6%                               6%
 However, it is also worth noting that the EFF and other minority parties
                                                                                       4%            5%            4%              6%
    are the main beneficiaries in this scenario.
                                                                                  Dec 2018         Jan 2019      Feb 2019       Mar 2019

                                                                                        ANC   DA          EFF   OTHER PARTY   UNDECIDED

Original data and written content:
© 2019 Citizen Surveys. All rights reserved.
                                                                                                                                    45
SECTION SEVEN
TRUST IN INSTITUTIONS

RELIGIOUS LEADERS                                                                   TRADITIONAL LEADERS

 Over the past two years, there has been a slow-but-steady decline in trust         Trust in traditional leadership follows a similar trend to religious
    in religious leadership in general, with this trend continuing in the current      leadership, and is currently at 42%.
    quarter to 54%.

TRUST IN: RELIGIOUS LEADERS                                                         TRUST IN: TRADITIONAL LEADERS
HOW MUCH TRUST, IF ANY, DO YOU HAVE IN… ?                                           HOW MUCH TRUST, IF ANY, DO YOU HAVE IN… ?

                 66%
    64%
                             61%
                                          58%   58%         58%
                                                      56%
                                                                  53%      54%

                                                                                               47%
                                                                                      45%                45%       44%
                                                                                                                             42%                                     42%

                                                                                                                                       35%       35%       36%

  Q1 2017 Q2 2017 Q3 2017 Q4 2017 Q1 2018 Q2 2018 Q3 2018 Q4 2018 Q1 2019           Q1 2017   Q2 2017   Q3 2017   Q4 2017   Q1 2018   Q2 2018   Q3 2018   Q4 2018   Q1 2019

Original data and written content:
© 2019 Citizen Surveys. All rights reserved.
                                                                                                                                                                    47
TRUST IN INSTITUTIONS

ELECTORAL COMMISSION (IEC)                                                         CONSTITUTIONAL COURT

 In Q1 of 2018, trust in the IEC grew noticeably (to 60%), after a steady          Trust in the Constitutional Court has been relatively stable over the past
    decline over time. It maintained this level of trust in the first quarter of      12 months and currently at 59%.
    2019, as the IEC ramped up it’s engagement with the public in the leadup
    to the election.

TRUST IN: ELECTORAL COMMISSION (IEC)                                               TRUST IN: CONSITUTIONAL COURT
HOW MUCH TRUST, IF ANY, DO YOU HAVE IN… ?                                          HOW MUCH TRUST, IF ANY, DO YOU HAVE IN… ?

                                                                                     68%
                                                                                              65%       65%       65%       66%
    62%          62%
                                                                    59%      60%                                                                          59%       59%
                             57%                                                                                                      58%       56%
                                          54%   54%
                                                      49%   48%

  Q1 2017 Q2 2017 Q3 2017 Q4 2017 Q1 2018 Q2 2018 Q3 2018 Q4 2018 Q1 2019          Q1 2017   Q2 2017   Q3 2017   Q4 2017   Q1 2018   Q2 2018   Q3 2018   Q4 2018   Q1 2019

Original data and written content:
© 2019 Citizen Surveys. All rights reserved.
                                                                                                                                                                   48
TRUST IN INSTITUTIONS

PUBLIC PROTECTOR                                                                NATIONAL PROSECUTING AUTHORITY

 Busisiwe Mkhwebane was appointed by President Zuma in October 2016.            Trust in the NPA has been severely undermined under the directorship of
    Since then trust in the Public Protector’s office dropped from a high of       Shaun Abrahams. The growth in trust from it’s low point in Q3 2018 could
    66% in the beginning of 2017 to 47% in Q3 2018. However , it returned to       be linked to Advocate Shamila Batohi, the new head of the NPA appointed
    53% in Q4 of 2018 and has remained stable over the past two quarters.          by President Ramaphosa.

TRUST IN: PUBLIC PROTECTOR                                                      TRUST IN: NATIONAL PROSECUTING AUTHORITY
HOW MUCH TRUST, IF ANY, DO YOU HAVE IN… ?                                       HOW MUCH TRUST, IF ANY, DO YOU HAVE IN… ?

    66%
                 64%
                                                                                 61%
                                                58%                                        59%
                             57%          57%
                                                                  53%     53%                        52%       53%       53%
                                                      51%                                                                          50%                 50%       50%
                                                            47%                                                                              46%

  Q1 2017 Q2 2017 Q3 2017 Q4 2017 Q1 2018 Q2 2018 Q3 2018 Q4 2018 Q1 2019       Q1 2017   Q2 2017   Q3 2017   Q4 2017   Q1 2018   Q2 2018   Q3 2018   Q4 2018   Q1 2019

Original data and written content:
© 2019 Citizen Surveys. All rights reserved.
                                                                                                                                                                49
TRUST IN INSTITUTIONS

SOUTH AFRICAN POLICE SERVICE                                                    SOUTH AFRICAN NATIONAL DEFENCE FORCE

 While trust in SAPS has been declining steadily since Q4 of 2016, the most     The SANDF has in general enjoyed more public trust than the South
    significant drop has during the course of 2018, where it reached a low of      African Police Service has. While trust in the SANDF has declined since Q1
    40%. Subsequently trust in SAPS increased in Q1 2019 to 47%.                   of 2017, trust started to grow in Q4 2018. In Q1 2019, the SANDF held
                                                                                   “Armed Forces Day”, and trust in the SANDF continued to grow in this
                                                                                   quarter to 68%.

TRUST IN: SOUTH AFRICAN POLICE SERVICE                                          TRUST IN: SANDF
HOW MUCH TRUST, IF ANY, DO YOU HAVE IN… ?                                       HOW MUCH TRUST, IF ANY, DO YOU HAVE IN… ?

                                                                                  72%      72%
                                                                                                     69%
                                                                                                               68%
                                                                                                                         66%
                                                                                                                                                                 65%
                                                                                                                                                       59%
                                                                                                                                   57%
                 54%
    52%                                         51%                                                                                          52%
                             50%          50%
                                                                        47%
                                                      44%         42%
                                                            40%

  Q1 2017 Q2 2017 Q3 2017 Q4 2017 Q1 2018 Q2 2018 Q3 2018 Q4 2018 Q1 2019       Q1 2017   Q2 2017   Q3 2017   Q4 2017   Q1 2018   Q2 2018   Q3 2018   Q4 2018   Q1 2019

Original data and written content:
© 2019 Citizen Surveys. All rights reserved.
                                                                                                                                                                50
TRUST IN INSTITUTIONS

SOUTH AFRICAN REVENUE SERVICE                                                 SOUTH AFRICAN BROADCASTING CORPORATION

 While trust in SARS declined throughout 2017 and 2018 it has increased       Despite the spate of financial mismanagement, corruption, and state
    slightly during this quarter, to 59%.                                        capture allegations, roughly two-thirds (67%) of South Africans still trust
                                                                                 the SABC. This level of trust has been consistent over time, possibly
                                                                                 because the public did not experience any disruptions in broadcasting as
                                                                                 a result of the internecine struggles taking place at the SABC.

TRUST IN: SARS                                                                TRUST IN: SABC
HOW MUCH TRUST, IF ANY, DO YOU HAVE IN… ?                                     HOW MUCH TRUST, IF ANY, DO YOU HAVE IN… ?

                                                                                         67%                           68%                                     67%
                                                                                                   66%       65%                 64%                 66%
                 64%                                                            64%                                                        63%
    62%                      62%                62%
                                          60%                           59%
                                                      55%   54%   56%

  Q1 2017 Q2 2017 Q3 2017 Q4 2017 Q1 2018 Q2 2018 Q3 2018 Q4 2018 Q1 2019     Q1 2017   Q2 2017   Q3 2017   Q4 2017   Q1 2018   Q2 2018   Q3 2018   Q4 2018   Q1 2019

Original data and written content:
© 2019 Citizen Surveys. All rights reserved.
                                                                                                                                                              51
SECTION EIGHT
USING SOCIAL MEDIA FOR POLITICAL NEWS
USING SOCIAL MEDIA FOR POLITICAL INFORMATION

 Citizen Surveys has worked directly within the Mobile Telecommunications
                                                                                 USING SOCIAL MEDIA FOR POLITICAL NEWS
    industry. Over a period of 9 years, Citizen Surveys ran one of the largest   APRIL – SEPTEMBER 2018

    national probability surveys, Mobile Tracker, measuring citizen’s
    telecommunications behaviour – including their usage of data and social
    media platforms.

     In Q2 2018, approximately 57% (22.1-million) South African’s used data,
        with the vast majority accessing the internet using their cellphones.
                                                                                     17.2m                              13.5m
     More than Facebook and Twitter, WhatsApp is the most frequently                 40%             14.9m              39%            14.6m     13.4m
        used communications App in South Africa, an unmediated platform.                               36%                               36%       35%

 In terms of using social media platforms for political news, in May 2018 –
    at the height of Ramaphoria –nearly 40% of South African adults (or 14.9-
    million South Africans aged 18 years and older) received news on political
    matters about South Africa from social media platforms such as Facebook
    and Twitter.

 As the months went on, however, the proportion of South African adults
                                                                                    May 2018         Jun 2018           Jul 2018       Aug 2018   Sep 2018
    who received news on political matters from social media declined in
    general, reaching a low of 35% (13.1-million) in September 2018.
                                                                                                          USED SOCIAL MEDIA FOR POLITICAL NEWS

Original data and written content:
© 2019 Citizen Surveys. All rights reserved.
                                                                                                                                                     53
USING SOCIAL MEDIA FOR POLITICAL INFORMATION
FREQUENCY OF USE

 In May 2018, 27% of South African adults
                                                      FREQUENCY OF USING SOCIAL MEDIA FOR POLITICAL NEWS
    (10.2-million people) used social media           APRIL – SEPTEMBER 2018

    platforms for political news frequently (i.e.
    every day or a few times a week).

 While the proportion of those South Africans
    who used social media daily declined to a low
    point in June 2018, it has since steadily grown
                                                               16%                                                                               16%
    back to 16% in September 2018.                                                                                         16%
                                                                                                     15%
                                                                                       14%
 The proportion of South Africans who used
                                                               11%                                   11%
    social media a few times a week remained                                           11%
                                                                                                                            9%
    relatively stable, but declined from July 2018                                                                                               8%
                                                                8%                      8%            8%
    onwards.                                                                                                                6%
                                                                                                                                                       7%

 Those who use social media a few times a                                                            5%
                                                                5%                                                          5%
    month have declined steadily over time, while                                       4%                                                       4%

    those who use it less than once a month have
                                                             May 2018                 Jun 2018      Jul 2018              Aug 2018             Sep 2018
    remained somewhat stable since May 2018.

                                                           DAILY               A FEW TIMES A WEEK   A FEW TIMES A MONTH              LESS THAN ONCE A MONTH

Original data and written content:
© 2019 Citizen Surveys. All rights reserved.
                                                                                                                                                       54
USING SOCIAL MEDIA FOR POLITICAL INFORMATION
IMPACT OF USING SOCIAL MEDIA ON OPINIONS OF THE ANC

 In April 2018, of those who                         EFFECT ON OPINIONS OF THE ANC                                                                EFFECT ON ANC PARTISANS
    engage with Social Media, 53%                     DOES POLITICAL NEWS FROM FACEBOOK / TWITTER HAVE A POSITIVE EFFECT,                          Q3 2018
                                                      NO EFFECT, OR NEGATIVE EFFECT ON YOUR OPINION OF THE ANC ?
    noted that the news had a
    positive effect on their opinion                                                                                                                        POSITIVE EFFECT

                                                                                                                                                            64%
    of the ANC.

     However, as the months                               76%
        passed, this proportion                                                                              70%
                                                                            66%
        dropped.
                                                                                            63%                            63%           61%   *
                                                           53%                                                                                                   NO EFFECT

                                                                                                                                                            12%
 ANC partisans are those South
                                                                            46%             44%
    African adults who "feel closest                                                                         43%           41%
                                                                                                                                         38%
    to the ANC".

 For ANC partisans, news about
    the ANC is more likely to have                                                                                                                         NEGATIVE EFFECT
    a positive effect on their option
    of the ANC.*
                                                         Apr 2018        May 2018         Jun 2018          Jul 2018     Aug 2018       Sep 2018
                                                                                                                                                                4%
                                                                    POSITIVE EFFECT – OVERALL               POSITIVE EFFECT – ANC PARTISANS

                                                                                                                                                                    55
* The base sizes reflected in the partisan measure are small, and indicative at a monthly level, however.

Original data and written content:
© 2019 Citizen Surveys. All rights reserved.
USING SOCIAL MEDIA FOR POLITICAL INFORMATION
IMPACT OF USING SOCIAL MEDIA ON OPINIONS OF THE DA

 For DA partisans, news about                        EFFECT ON OPINIONS OF THE DA                                                                     EFFECT ON DA PARTISANS
    the DA is more likely to have a                   DOES POLITICAL NEWS FROM FACEBOOK / TWITTER HAVE A POSITIVE EFFECT,                              Q3 2018
                                                      NO EFFECT, OR NEGATIVE EFFECT ON YOUR OPINION OF THE DA ?
    positive effect on their option
    of the party.*                                                                                                                                              POSITIVE EFFECT
 What is interesting to note is
    that the proportion of DA
    partisans who said “No effect”
                                                           75%
                                                                            71%             69%
                                                                                                                                             65%   *
                                                                                                                                                                56%
    is the highest of all three of the
                                                                                                                           52%                                       NO EFFECT

                                                                                                                                                                36%
    major political parties.                                                                                 50%

     On the other hand, those
        partisans who said that it                         34%
                                                                            29%             30%                                              28%
        would have a “Positive                                                                               26%           25%

        effect” is also the lowest                                                                                                                             NEGATIVE EFFECT

                                                                                                                                                                    8%
        proportion.

                                                         Apr 2018        May 2018         Jun 2018          Jul 2018     Aug 2018       Sep 2018

                                                                    POSITIVE EFFECT – OVERALL               POSITIVE EFFECT – DA PARTISANS

                                                                                                                                                                         56
* The base sizes reflected in the partisan measure are small, and indicative at a monthly level, however.

Original data and written content:
© 2019 Citizen Surveys. All rights reserved.
USING SOCIAL MEDIA FOR POLITICAL INFORMATION
IMPACT OF USING SOCIAL MEDIA ON OPINIONS OF THE EFF

 For EFF partisans, news about                       EFFECT ON OPINIONS OF THE EFF                                                                 EFFECT ON EFF PARTISANS
    the EFF is more likely to have a                  DOES POLITICAL NEWS FROM FACEBOOK / TWITTER HAVE A POSITIVE EFFECT,                           Q3 2018
                                                      NO EFFECT, OR NEGATIVE EFFECT ON YOUR OPINION OF THE EFF ?
    positive effect on their option
    of the EFF.*                                                                                                                                              POSITIVE EFFECT

                                                                                                                                                              72%
                                                           90%
 Interestingly, the proportion of                                                                                          84%

    EFF partisans who said                                                  74%
    “Negative effect” is the highest
                                                                                            62%
                                                                                                             66%
                                                                                                                                          62%
                                                                                                                                                *
    amongst all three major
                                                                                                                                                                   NO EFFECT

                                                                                                                                                              14%
    parties.

 While these results are
    presented at a monthly level,                                                           31%
                                                           27%              26%                              25%            26%           25%
    they are indicative rather than
    definitive.                                                                                                                                              NEGATIVE EFFECT
 Applying quarterly weights
    allows for a higher resolution,
    but the pattern remains                              Apr 2018        May 2018         Jun 2018          Jul 2018      Aug 2018      Sep 2018
                                                                                                                                                              14%
    relatively consistent.
                                                                    POSITIVE EFFECT – OVERALL               POSITIVE EFFECT – EFF PARTISANS

                                                                                                                                                                      57
* The base sizes reflected in the partisan measure are small, and indicative at a monthly level, however.

Original data and written content:
© 2019 Citizen Surveys. All rights reserved.
SECTION NINE
EXPROPRIATION OF LAND WITHOUT COMPENSATION
            POLARISING THE NATION
LAND EXPROPRIATION
AGREEMENT AND DISAGREEMENT

 The question of land expropriation without         LAND EXPROPRIATION
                                                     TO WHAT EXTENT DO AGREE OR DISAGREE THAT GOVERNMENT HAS THE RIGHT TO TAKE LAND WITHOUT
    compensation is extremely polarising,            PAYMENT AND TO REDISTRIBUTE IT TO PEOPLE WHO WERE DISADVANTAGED UNDER APARTHEID?
    splitting South Africa down the middle with
    the majority of South Africans holding           Q2 2018                                                                                    Q3 2018
    extremely strong views, both in favour and       STRONGLY AGREE                                                                             STRONGLY AGREE
    against.
                                                     10.4m               28%                                                       33%               12.2m
 In Q2 of 2018, 10.4-million (28%) of South
                                                     AGREE                                                                                               AGREE
    African adults strongly agreed; in Q3 of 2018,
    this grew to 12.2-million (33%).                 4.5m       12%                                                                              9% 3.4m
 Even more people strongly disagreed with           NEITHER AGREE NOR DISAGREE                                                      NEITHER AGREE NOR DISAGREE
    expropriation of land without compensation
    in Q2 of 2018, however, at 11.5-million (31%),
                                                     6.8m          18%                                                                        13%      4.7m
    and this grew to 13-million (35%) in Q3 of       DISAGREE                                                                                          DISAGREE
    2018.
                                                     3.9m 10%                                                                                 10% 3.8m
 Overall, there are more people who strongly
                                                     STRONGLY DISAGREE                                                                        STRONGLY DISAGREE
    disagree than strongly agree, by a margin of
    nearly 800,000.                                  11.5m                31%                                                     35%                13.0m

Original data and written content:
© 2019 Citizen Surveys. All rights reserved.
                                                                                                                                                      59
You can also read