UNITED STATES SECURITIES AND EXCHANGE COMMISSION
←
→
Page content transcription
If your browser does not render page correctly, please read the page content below
UNITED STATES
                             SECURITIES AND EXCHANGE COMMISSION
                                                              WASHINGTON, D.C. 20549

                                                                  FORM 6-K
                                              REPORT OF FOREIGN PRIVATE ISSUER
                                            PURSUANT TO RULE 13a-16 OR 15d-16 OF THE
                                               SECURITIES EXCHANGE ACT OF 1934

                                                             For the month of August 2020

                                                          Commission File Number 001-36906

                             INTERNATIONAL GAME TECHNOLOGY PLC
                                                      (Translation of registrant’s name into English)

                                                            66 Seymour Street, Second Floor
                                                                   London, W1H 5BT
                                                                    United Kingdom
                                                          (Address of principal executive offices)

Indicate by check mark whether the registrant files or will file annual reports under cover of Form 20-F or Form 40-F:
Form 20-F      ☒        Form 40-F      o

Indicate by check mark if the registrant is submitting the Form 6-K in paper as permitted by Regulation S-T Rule 101(b)(1): o

Indicate by check mark if the registrant is submitting the Form 6-K in paper as permitted by Regulation S-T Rule 101(b)(7): o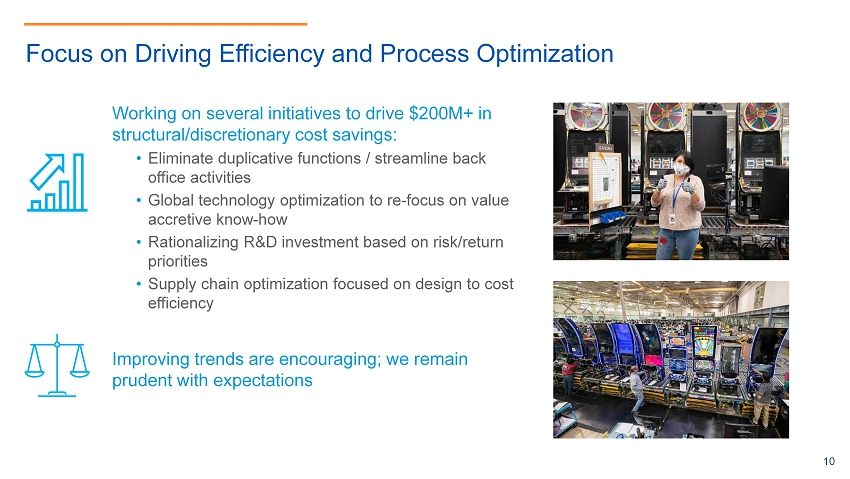
Second Quarter 2020 Results of International Game Technology PLC

       On August 4, 2020, International Game Technology PLC reported results for the quarter ended June 30, 2020.

       A copy of the press release relating to the above matters is set forth in Exhibit 99.1, which is being furnished herewith. In addition, a slide
presentation relating to the results is set forth in Exhibit 99.2, which is being furnished herewith.

Exhibit
Number                                                                             Description

99.1            Press Release “International Game Technology PLC Reports Second Quarter 2020 Results,” dated August 4, 2020

99.2            Presentation “2020 Second Quarter Results ended June 30, 2020,” dated August 4, 2020

                                                                               2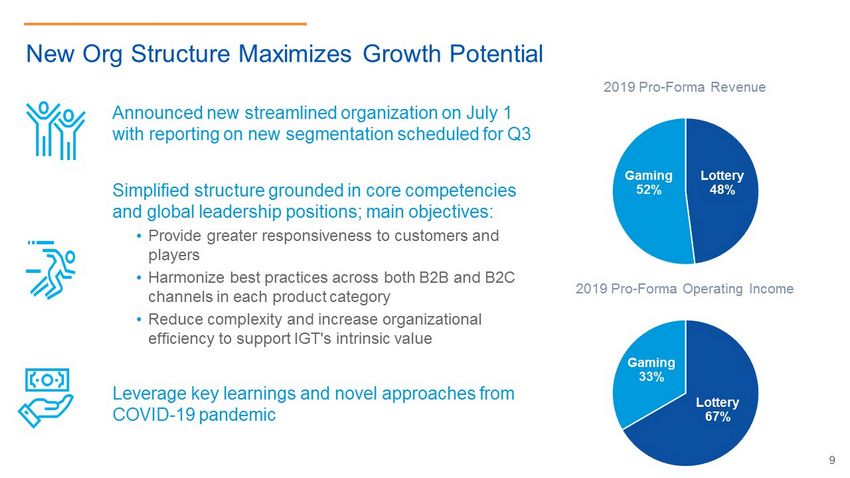
EXHIBIT INDEX

Exhibit
Number                                                                  Description

99.1      Press Release “International Game Technology PLC Reports Second Quarter 2020 Results,” dated August 4, 2020

99.2      Presentation “2020 Second Quarter Results ended June 30, 2020,” dated August 4, 2020

                                                                    3
SIGNATURES

      Pursuant to the requirements of the Securities Exchange Act of 1934, the registrant has duly caused this report to be signed on its behalf by the
undersigned, thereunto duly authorized.

Date: August 4, 2020                                                       INTERNATIONAL GAME TECHNOLOGY PLC

                                                                           By:          /s/ Pierfrancesco Boccia
                                                                                        Pierfrancesco Boccia
                                                                                        Corporate Secretary

                                                                              4
Exhibit 99.1

                                                  NEWS RELEASE

                       INTERNATIONAL GAME TECHNOLOGY PLC REPORTS
                              SECOND QUARTER 2020 RESULTS

   ·   Results highlight value of diverse business portfolio, global reach, resilience of lottery, and swift response to
       unprecedented conditions

   ·   Liquidity and net debt improved on positive cash flow performance; generated $168 million in cash from
       operating activities and $107 million in free cash flow during the second quarter

   ·   Net loss of $280 million; adjusted net loss of $121 million

   ·   Delivered $168 million in adjusted EBITDA with important contribution from strict cost discipline

   ·   On track to achieve $500 million in 2020 cost reduction/avoidance; identified over $200 million in longer-term,
       structural and discretionary cost savings

LONDON – August 4, 2020 – International Game Technology PLC (“IGT”) (NYSE:IGT) today reported financial results for the
second quarter ended June 30, 2020. Today, at 8:00 a.m. EDT, management will host a conference call and webcast to present
the results; access details are provided below.

“Our second quarter results reflect the intense impact of global lockdowns caused by the pandemic,” said Marco Sala, CEO of
IGT. “That said, thanks to strong North America Lottery performance and our swift adoption of cost-saving and avoidance
measures, we delivered better cash flow than we expected back in May. Our resilience is a direct consequence of the diversity
of our global portfolio of products and solutions. The improving trends we are currently seeing are encouraging, but we remain
prudent with our planning. Our new organizational structure enhances our readiness to adapt to changes in market conditions.”

“Cash generation and liquidity remain our top financial priority,” said Max Chiara, CFO of IGT. “The proactive efficiency
initiatives and focused capital markets activity we executed in the quarter have us tracking ahead of plan on all key measures
and we expect to deliver positive free cash flow this fiscal year. We have the resources we need to navigate the impact COVID-
19 is having on our business and we are making important, strategic decisions to enhance our operational flexibility. This
includes over $200 million in structural and discretionary cost savings compared to pre-pandemic levels.”

                                                               1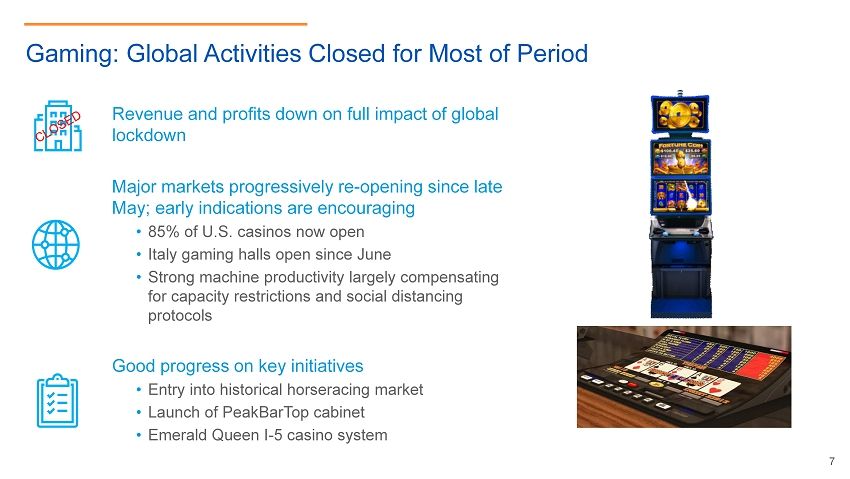
Overview of Consolidated Second Quarter 2020 Results

                                                                                                                              Constant
                                                                             Quarter Ended                      Y/Y           Currency
                                                                               June 30,                        Change         Change
                                                                            2020       2019                     (%)             (%)

 (In $ millions, unless otherwise noted)
 Revenue                                                                        637          1,234              -48%             -48%
 Operating (loss)/income                                                        (94)           224               NM
 Net (loss)/income per diluted share                                         ($1.37)         $0.02               NM
 Adjusted EBITDA                                                                168            454              -63%             -63%
 Adjusted net (loss)/income per diluted share                                ($0.59)         $0.44               NM
 Net debt                                                                     7,289          7,637               -5%

Note: Adjusted EBITDA and adjusted net (loss)/income per diluted share are non-GAAP financial measures. Reconciliations of non-GAAP financial
measures to the most directly comparable GAAP financial measures are provided at the end of this news release.

Second quarter 2020 results reflect the impact of global COVID-19 restrictions. Revenue was down across all business
segments and all primary revenue streams except for digital activities, where revenue increased 35%. Progressive easing of
restrictions during the quarter and cost-saving initiatives helped mitigate impact.

Financial highlights:

Consolidated revenue of $637 million, down 48% from the prior year
   · Global gaming revenue declined 72%, driven by the closure of casinos and gaming halls, fewer unit shipments, and
       lower systems and software sales compared to the prior year
   · Global lottery revenue down 26% on reduced traffic to points of sale and temporary game shutdowns in Italy
   · Gaming and lottery trends improved each month as venues re-opened and restrictions eased

Operating loss of $94 million, down from income of $224 million in the prior year
   · Lower profit contribution from reduced business volumes
   · Includes $43 million in restructuring expense
   · Oklahoma strategic transaction and high-margin poker and systems sales embedded in the prior year
   · Accelerating benefit from actions taken to reduce costs

Net interest expense of $96 million compared to $104 million in the prior year
   · Capital market transactions drive lower cost of debt

Benefit from income taxes of $11 million, compared to a provision of $63 million, driven by lower pre-tax income

Net loss attributable to IGT was $280 million; adjusted net loss attributable to IGT of $121 million versus adjusted net income of
$91 million in the prior year

                                                                     2
·   Reflects operating loss and higher foreign exchange and debt extinguishment losses in the current year

Net loss per diluted share of $1.37; adjusted net loss per diluted share of $0.59 compared to adjusted net income of $0.44 in the
prior year

Adjusted EBITDA of $168 million compared to $454 million in the prior-year period

Net debt of $7.29 billion improved $93 million from $7.38 billion at December 31, 2019; Net debt to LTM adjusted EBITDA of
5.52x, up from 4.31x at December 31, 2019, primarily due to lower EBITDA in the first half of 2020

Cash and Liquidity Update
   · Preserving cash and liquidity is the top financial priority
   · At June 30, 2020, liquidity totalled $2.3 billion, comprised of $1.3 billion in unrestricted cash and $1.0 billion available
      under revolving credit facilities

Other Developments
   · In an effort to accelerate the Company’s response to market conditions, over $200 million has been identified in
      structural cost savings compared to pre-pandemic levels. These savings are mostly expected in 2021 and to come from:
          o Eliminating duplicative functions and streamlining back-office activities
          o Optimizing the global investment in technology to focus on value-accretive know-how
          o Rationalizing R&D based on disciplined risk/return priorities
          o Optimizing our supply chain for maximum cost efficiency

   ·   Issuance of $750 million 5.25% Notes due 2029, as previously announced
           o $500 million of net proceeds used to fund a partial tender of 6.25% Notes due 2022
           o Lowest USD-denominated coupon ever issued by the Company
           o Longest duration issuance since 2015

Conference Call and Webcast

August 4, 2020, at 8:00 a.m. EDT

Live webcast available under “News, Events & Presentations” on IGT’s Investor Relations website at www.IGT.com; replay
available on the website following the live event

Dial-In Numbers
    · US/Canada toll-free dial-in number: +1 844 842 7999
    · Outside the US/Canada toll-free number: +1 612 979 9887
    · Conference ID/confirmation code: 4889985
    · A telephone replay of the call will be available for one week
           o US/Canada replay number: +1 855 859 2056
           o Outside the US/Canada replay number: +1 404 537 3406
           o ID/Confirmation code: 4889985

                                                               3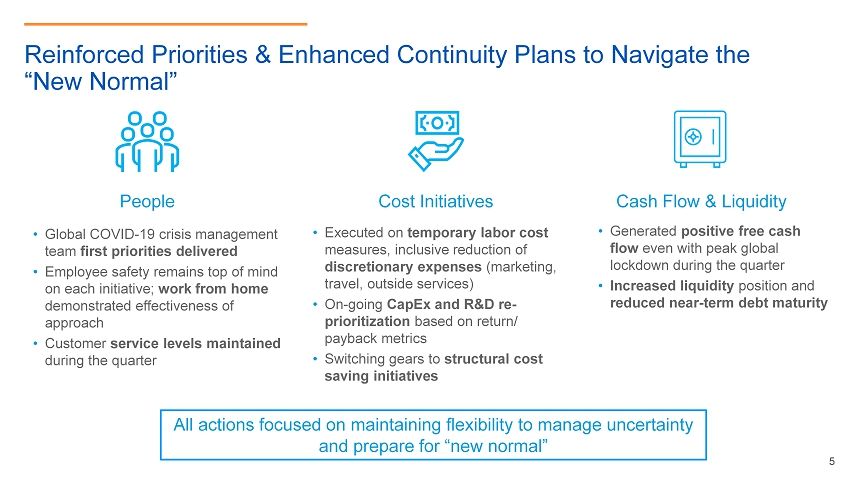
Comparability of Results

All figures presented in this news release are prepared under U.S. GAAP, unless noted otherwise. Adjusted figures exclude the
impact of items such as purchase accounting, impairment charges, restructuring expense, foreign exchange, and certain one-
time, primarily transaction-related items. Reconciliations to the most directly comparable U.S. GAAP measures are included in
the tables in this news release. Constant currency changes for 2020 are calculated using the same foreign exchange rates as
the corresponding 2019 period. Management uses non-GAAP financial measures to understand and compare operating results
across accounting periods, for internal budgeting and forecasting purposes, and to evaluate the Company’s financial
performance. Management believes these non-GAAP financial measures reflect the Company’s ongoing business in a manner
that allows for meaningful period-to-period comparisons and analysis of business trends. These constant currency changes and
non-GAAP financial measures should however be viewed in addition to, and not as an alternative for, the Company’s reported
results prepared in accordance with U.S. GAAP.

About IGT
IGT (NYSE:IGT) is the global leader in gaming. We deliver entertaining and responsible gaming experiences for players across
all channels and regulated segments, from Gaming Machines and Lotteries to Sports Betting and Digital. Leveraging a wealth of
compelling content, substantial investment in innovation, player insights, operational expertise, and leading-edge technology,
our solutions deliver unrivalled gaming experiences that engage players and drive growth. We have a well-established local
presence and relationships with governments and regulators in more than 100 countries around the world, and create value by
adhering to the highest standards of service, integrity, and responsibility. IGT has approximately 12,000 employees. For more
information, please visit www.IGT.com.

Cautionary Statement Regarding Forward-Looking Statements
This news release may contain forward-looking statements (including within the meaning of the Private Securities Litigation
Reform Act of 1995) concerning International Game Technology PLC and its consolidated subsidiaries (the “Company”) and
other matters. These statements may discuss goals, intentions, and expectations as to future plans, trends, events, dividends,
results of operations, or financial condition, or otherwise, based on current beliefs of the management of the Company as well
as assumptions made by, and information currently available to, such management. Forward-looking statements may be
accompanied by words such as “aim,” “anticipate,” “believe,” “plan,” “could,” “would,” “should,” “shall”, “continue,” “estimate,”
“expect,” “forecast,” “future,” “guidance,” “intend,” “may,” “will,” “possible,” “potential,” “predict,” “project” or the negative or other
variations of them. These forward-looking statements speak only as of the date on which such statements are made and are
subject to various risks and uncertainties, many of which are outside the Company’s control. Should one or more of these risks
or uncertainties materialize, or should any of the underlying assumptions prove incorrect, actual results may differ materially
from those predicted in the forward-looking statements and from past results, performance, or achievements. Therefore, you
should not place undue reliance on such statements. Factors that could cause actual results to differ materially from those in the
forward-looking statements include (but are not limited to) the uncertainty of the duration, extent, and

                                                                    4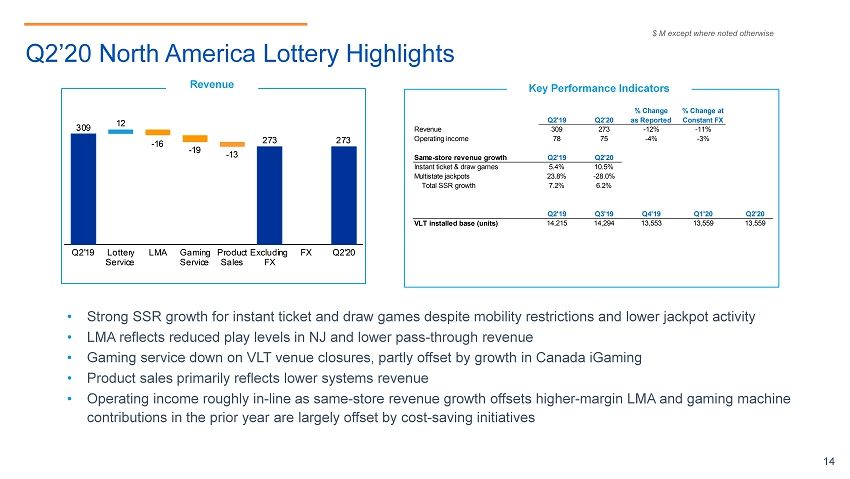
effects of the COVID-19 pandemic and the response of governments, including government-mandated property closures and
travel restrictions, and other third parties on the Company’s business, results of operations, cash flows, liquidity and
development prospects and the factors and risks described in the Company’s annual report on Form 20-F for the financial year
ended December 31, 2019 and other documents filed from time to time with the SEC, which are available on the SEC’s website
at www.sec.gov and on the investor relations section of the Company’s website at www.IGT.com. Except as required under
applicable law, the Company does not assume any obligation to update these forward-looking statements. You should carefully
consider these factors and other risks and uncertainties that affect the Company’s business. Nothing in this news release is
intended, or is to be construed, as a profit forecast or to be interpreted to mean that the financial performance of International
Game Technology PLC for the current or any future financial years will necessarily match or exceed the historical published
financial performance or International Game Technology PLC, as applicable. All forward-looking statements contained in this
news release are qualified in their entirety by this cautionary statement. All subsequent written or oral forward-looking
statements attributable to International Game Technology PLC, or persons acting on its behalf, are expressly qualified in their
entirety by this cautionary statement.

Contact:
Phil O’Shaughnessy, Global Communications, toll free in U.S./Canada +1 (844) IGT-7452;
outside U.S./Canada +1 (401) 392-7452
Francesco Luti, +39 3485475493; for Italian media inquiries
James Hurley, Investor Relations, +1 (401) 392-7190

                                                                5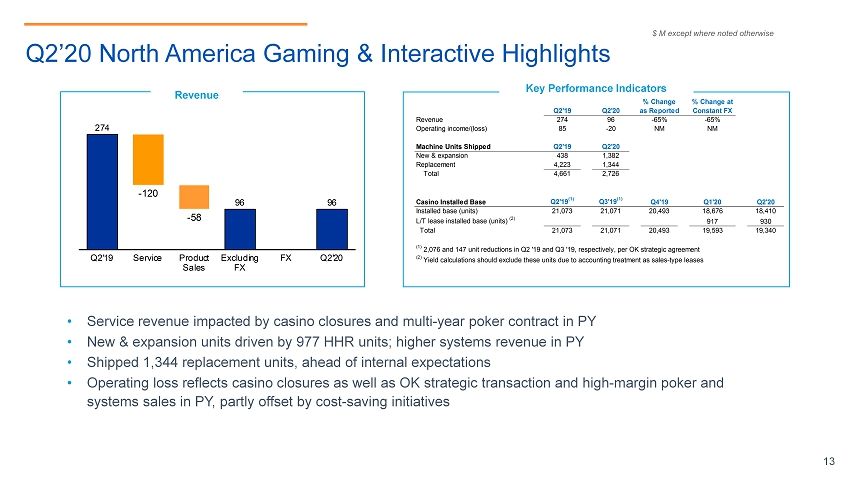
Second Quarter Operating Segment Review

North America Gaming & Interactive

Select Financial Data                                 As    Constant   Key Performance Indicators                                                      %
3 Month Period Ended June 30th     Q2 '20   Q2 '19 Reported   FX       3 Month Period Ended June 30th                             Q2 '20    Q2 '19   Change
          Total revenue             92       268     -66%    -66%      Installed base units (end of period)
          Gaming services           47       165     -72%    -72%         Casino                                                   18,410    21,073 -12.6%
           Terminal                 22       106     -79%    -79%         Casino - L/T lease (1)                                      930        -
Gaming     Other                    25        59     -58%    -58%        Total Installed base units                                19,340    21,073 -8.2%
          Product sales             45       104     -56%    -56%      (1) Yield calculations should exclude these units due to
           Terminal                 40        73     -45%    -45%          accounting treatment as sales-type leases
           Other                     5        30     -84%    -84%
                                                                       Machine units shipped
         Total revenue               4        6      -30%    -30%       New/expansion                                               1,382       438 215.5%
 Other   Service revenue             4        6      -35%    -35%       Replacement                                                 1,344     4,223 -68.2%
         Product revenue             0        0       0%      0%        Total machines shipped                                      2,726     4,661 -41.5%

         Revenue                     96      274     -65%    -65%
 Total
         Operating (Loss)/Income    (20)      85      NM      NM

Revenue of $96 million, down from $274 million in the prior-year period
   · Gaming service revenue of $47 million
         o Casino closures impact terminal revenue
         o Drop in other revenue reflects multi-year poker license in the prior year
   · Gaming product sales revenue of $45 million
         o New/expansion shipments driven by 977 historical horse racing units
         o Shipped 1,344 replacement units
         o Systems revenue down from high level in the prior year

Operating loss of $20 million compared to operating income of $85 million in the prior year
   · Impact of casino closures
   · Oklahoma strategic transaction and high-margin poker and systems sales in the prior year
   · Partly offset by benefit from cost-saving initiatives

                                                                       6
North America Lottery
Select Financial Data As Constant Key Performance Indicators %
3 Month Period Ended June 30th Q2 '20 Q2 '19 Reported FX 3 Month Period Ended June 30th Q2 '20 Q2 '19 Change
Total revenue 20 37 -47% -46% Installed base units (end of period)
Gaming services 19 37 -48% -47% VLT - Government sponsored 13,559 14,215 -4.6%
Gaming Terminal 1 25 -94% -94%
Other 18 12 45% 48% Lottery same-store revenue growth
Product sales 1 1 17% 17% Instant ticket & draw games 10.5%
Multistate jackpots -28.0%
Total revenue 254 270 -6% -6% Total lottery same-store revenue growth 6.2%
Lottery services 234 238 -2% -2%
FMC 214 202 6% 6%
Lottery Instant ticket & draw games 184 168 9% 9%
Other services 29 34 -13% -13%
LMA 20 36 -43% -43%
Product sales 19 32 -40% -40%
Total revenue 0 1 -87% -87%
Other Service revenue 0 1 -87% -87%
Revenue 273 309 -12% -11%
Total
Operating income 75 78 -4% -3%
Revenue of $273 million, down from $309 million in the prior-year period
· Lottery service revenue of $234 million, down 2%
o Strong double-digit same-store revenue growth for instant ticket & draw games nearly offsets impact of mobility
restrictions and lower jackpot activity
o LMA revenue reflects reduced play levels in NJ and lower pass-through revenue
· Gaming service revenue impacted by closure of VLT venues, partly offset by growth in Canada iGaming
· Product sales revenue reflects lower systems revenue
Operating income of $75 million compared to $78 million in the prior year
· Same-store revenue growth and cost-saving initiatives mostly offset lower gaming and LMA contributions
7International
Select Financial Data As Constant Key Performance Indicators %
3 Month Period Ended June 30th Q2 '20 Q2 '19 Reported FX 3 Month Period Ended June 30th Q2 '20 Q2 '19 Change
Total revenue 21 142 -85% -85% Installed base units (end of period)
Gaming services 12 28 -57% -56% Casino 9,724 10,039 -3.1%
Terminal 1 12 -95% -94% VLT - Government sponsored 5,110 4,436 15.2%
Gaming Other 11 16 -28% -25% Total installed base units 14,834 14,475 2.5%
Product sales 9 114 -92% -92%
Terminal 4 82 -95% -95% Machine units shipped
Other 6 33 -83% -83% New/expansion 61 700 -91.3%
Replacement 208 5,863 -96.5%
Total revenue 55 70 -22% -19% Total machines shipped 269 6,563 -95.9%
Lottery services 52 67 -22% -19%
FMC 52 67 -22% -19% Lottery same-store revenue growth
Lottery
Instant ticket & draw games 34 53 -35% -33% Instant ticket & draw games -28.2%
Other services 18 14 27% 34% Multistate jackpots -7.8%
Product sales 2 3 -22% -21% Total lottery same-store revenue growth -27.1%
Total revenue 7 17 -55% -48%
Other Service revenue 7 16 -55% -48%
Product sales 0 0 -65% -64%
Revenue 84 229 -64% -62%
Total
Operating (Loss)/Income (20) 30 NM NM
Revenue of $84 million, down from $229 million in the prior-year period
· Lottery service revenue of $52 million
o Same-store revenue growth impacted by mobility restrictions and shutdown of games in certain markets; trends
progressively improving as restrictions ease
· Gaming product sales of $9 million
o Fewer unit shipments, primarily in Latin America, impact terminal revenue; VLT shipments to Sweden in prior year
o Other product sales reflect Italy AWP upgrades in the prior year
· Gaming service revenue lower on casino closures; installed base stable
Operating loss of $20 million compared to operating income of $30 million in the prior year
· Impact of lower unit volume and revenue mix
· Partly offset by benefit from cost-saving initiatives
8Italy
Select Financial Data As Constant Key Performance Indicators %
3 Month Period Ended June 30th Q2 '20 Q2 '19 Reported FX 3 Month Period Ended June 30th Q2 '20 Q2 '19 Change
Total revenue 33 153 -78% -78% (In € millions, except machines)
Gaming services 33 153 -78% -78% Lottery
Gaming Terminal 12 136 -91% -91% Lotto wagers 914 2,064 -55.7%
Other 21 17 25% 27% 10eLotto 610 1,507 -59.5%
Product sales 0 0 -98% -98% Core 256 479 -46.5%
Late numbers 21 31 -32.4%
Total revenue 86 190 -55% -55% MillionDAY 26 47 -43.6%
Lottery services 86 190 -55% -55%
FMC 86 190 -55% -55% Scratch & Win wagers 1,649 2,257 -27.0%
Lottery
Instant ticket & draw games 133 238 -44% -44%
Other services (47) (48) -1% 0% Italy lottery revenue growth -54.8%
Product sales 0 0 0% 0%
Gaming
Total revenue 66 79 -17% -15% Installed base (end of period)
Other Service revenue 66 79 -17% -15% VLT - Operator (B2C) 10,844 10,929 -0.8%
Product sales 0 0 0% 0% VLT - Supplier (B2B) 7,253 7,524 -3.6%
AWP 37,138 40,268 -7.8%
Revenue 184 422 -56% -56% Total installed base 55,235 58,721 -5.9%
Total
Operating (Loss)/Income (7) 133 NM NM
Wagers
VLT - Operator (B2C) 150 1,427 -89.5%
AWP 83 916 -90.9%
Interactive wagers (gaming) 729 508 43.7%
Other
Sports betting wagers (1) 79 252 -68.5%
Sports betting payout (%) (1) 88.1% 82.2% 5.9 pp
(1) Includes virtual wagers and pools & horses
Revenue of $184 million, down from $422 million in the prior-year period
· Lottery service revenue reflects timing of game reopening and points of sale restrictions; trends improve each month in
the quarter
· Gaming service revenue reflects closure of gaming halls
· Interactive wagers rise 44%
· Commercial services revenue higher, more than offset by lower sports betting activity
Operating loss of $7 million compared to operating income of $133 million in the prior year
· Impact of COVID-19 restrictions
· Partly offset by benefit from cost-saving initiatives
9International Game Technology PLC
Consolidated Statements of Operations
($ and shares in thousands, except per share amounts)
Unaudited
For the three months ended
June 30,
2020 2019
Service revenue 560,338 980,031
Product sales 77,146 254,222
Total revenue 637,484 1,234,253
Cost of services 416,660 594,598
Cost of product sales 67,207 160,786
Selling, general and administrative 171,950 213,263
Research and development 31,335 65,383
Restructuring expense 43,429 2,412
Other operating expense (income), net 1,009 (25,904)
Total operating expenses 731,590 1,010,538
Operating (loss) income (94,106) 223,715
Interest expense, net (95,599) (103,860)
Foreign exchange loss, net (74,384) (41,061)
Other (expense) income, net (29,374) 23,493
Total non-operating expenses (199,357) (121,428)
(Loss) income before (benefit from) provision for income taxes (293,463) 102,287
(Benefit from) provision for income taxes (11,321) 63,300
Net (loss) income (282,142) 38,987
Less: Net (loss) income attributable to non-controlling interests (2,526) 34,131
Net (loss) income attributable to IGT PLC (279,616) 4,856
Net (loss) income attributable to IGT PLC per common share - basic (1.37) 0.02
Net (loss) income attributable to IGT PLC per common share - diluted (1.37) 0.02
Weighted-average shares - basic 204,748 204,407
Weighted-average shares - diluted 204,748 204,412
10International Game Technology PLC
Consolidated Statements of Operations
($ and shares in thousands, except per share amounts)
Unaudited
For the six months ended
June 30,
2020 2019
Service revenue 1,343,639 1,971,062
Product sales 234,040 408,107
Total revenue 1,577,679 2,379,169
Cost of services 938,487 1,189,925
Cost of product sales 158,306 260,971
Selling, general and administrative 335,543 415,100
Research and development 92,072 131,501
Restructuring expense 47,053 5,701
Goodwill impairment (1) 296,000 -
Other operating expense (income), net 1,603 (25,896)
Total operating expenses 1,869,064 1,977,302
Operating (loss) income (291,385) 401,867
Interest expense, net (196,261) (206,929)
Foreign exchange (loss) gain, net (4,024) 17,541
Other (expense) income, net (32,760) 22,995
Total non-operating expenses (233,045) (166,393)
(Loss) income before (benefit from) provision for income taxes (524,430) 235,474
(Benefit from) provision for income taxes (8,189) 115,992
Net (loss) income (516,241) 119,482
Less: Net income attributable to non-controlling interests 11,663 74,372
Net (loss) income attributable to IGT PLC (527,904) 45,110
Net (loss) income attributable to IGT PLC per common share - basic (2.58) 0.22
Net (loss) income attributable to IGT PLC per common share - diluted (2.58) 0.22
Weighted-average shares - basic 204,591 204,309
Weighted-average shares - diluted 204,591 204,532
(1) Reduces the carrying value of the International and North America Gaming & Interactive segments by $193 million and $103 million, respectively
11International Game Technology PLC
Consolidated Balance Sheets
($ thousands)
Unaudited
June 30, December 31,
2020 2019
Assets
Current assets:
Cash and cash equivalents 1,346,741 662,934
Restricted cash and cash equivalents 183,021 231,317
Trade and other receivables, net 860,351 1,006,127
Inventories 173,022 161,790
Other current assets 574,549 571,869
Total current assets 3,137,684 2,634,037
Systems, equipment and other assets related to contracts, net 1,214,903 1,307,940
Property, plant and equipment, net 139,634 146,055
Operating lease right-of-use-assets 336,561 341,538
Goodwill 5,150,931 5,451,494
Intangible assets, net 1,722,325 1,836,002
Other non-current assets 1,791,246 1,927,524
Total non-current assets 10,355,600 11,010,553
Total assets 13,493,284 13,644,590
Liabilities and shareholders' equity
Current liabilities:
Accounts payable 1,103,975 1,120,922
Current portion of long-term debt 358,336 462,155
Short-term borrowings 79,291 3,193
Other current liabilities 939,440 882,081
Total current liabilities 2,481,042 2,468,351
Long-term debt, less current portion 8,198,124 7,600,169
Deferred income taxes 331,919 366,822
Operating lease liabilities 309,556 310,721
Other non-current liabilities 378,515 413,549
Total non-current liabilities 9,218,114 8,691,261
Total liabilities 11,699,156 11,159,612
Commitments and contingencies
Shareholders' equity 1,794,128 2,484,978
Total liabilities and shareholders' equity 13,493,284 13,644,590
12International Game Technology PLC
Consolidated Statements of Cash Flows
($ thousands)
Unaudited
For the six months ended
June 30,
2020 2019
Cash flows from operating activities
Net (loss) income (516,241) 119,482
Adjustments to reconcile net (loss) income to net cash provided by operating activities:
Goodwill impairment 296,000 -
Depreciation 198,248 209,271
Amortization 135,957 137,201
Amortization of upfront license fees 101,347 103,935
Loss on extinguishment of debt 28,277 9,628
Debt issuance cost amortization 10,297 11,523
Foreign exchange loss (gain), net 4,024 (17,541)
Loss (gain) on sale of assets 66 (63,239)
Stock-based compensation (11,806) 12,502
Deferred income taxes (36,705) 6,515
Other non-cash items, net 2,504 31,392
Changes in operating assets and liabilities, excluding the effects of acquisitions:
Trade and other receivables 139,578 49,059
Inventories (5,978) 802
Accounts payable (5,662) (57,317)
Other assets and liabilities (14,807) 38,508
Net cash provided by operating activities 325,099 591,721
Cash flows from investing activities
Capital expenditures (160,179) (231,003)
Proceeds from sale of assets 5,185 65,429
Other 10,897 2,545
Net cash used in investing activities (144,097) (163,029)
Cash flows from financing activities
Proceeds from long-term debt 1,475,071 846,975
Net proceeds from short-term borrowings 74,927 19,573
Net receipts from (payments of) financial liabilities 36,468 (11,395)
Debt issuance costs paid (19,616) (5,934)
Payments in connection with extinguishment of debt (25,000) (8,598)
Dividends paid (40,887) (81,729)
Principal payments on long-term debt (959,275) (833,129)
Capital increase - non-controlling interests 2,030 1,075
Return of capital - non-controlling interests - (70,399)
Dividends paid - non-controlling interests (91,376) (129,394)
Other (6,058) (6,733)
Net cash provided by (used in) financing activities 446,284 (279,688)
Net increase in cash and cash equivalents and restricted cash and cash equivalents 627,286 149,004
Effect of exchange rate changes on cash and cash equivalents and restricted cash and cash equivalents 8,225 (3,748)
Cash and cash equivalents and restricted cash and cash equivalents at the beginning of the period 894,251 511,777
Cash and cash equivalents and restricted cash and cash equivalents at the end of the period 1,529,762 657,033
Supplemental Cash Flow Information:
Interest paid (230,864) (211,591)
Income taxes paid (17,795) (49,777)
13International Game Technology PLC
Net Debt
($ thousands)
Unaudited
June 30, December 31,
2020 2019
6.250% Senior Secured Notes due February 2022 (1) 1,005,593 1,491,328
4.750% Senior Secured Notes due February 2023 (2) 946,301 948,382
5.350% Senior Secured Notes due October 2023 (1) 60,836 60,885
3.500% Senior Secured Notes due July 2024 (2) 555,981 557,331
6.500% Senior Secured Notes due February 2025 (1) 1,090,786 1,089,959
3.500% Senior Secured Notes due June 2026 (2) 832,943 835,105
6.250% Senior Secured Notes due January 2027 (1) 743,765 743,387
2.375% Senior Secured Notes due April 2028 (2) 554,908 556,403
5.250% Senior Secured Notes due January 2029 (1) 742,827 -
Senior Secured Notes, long-term 6,533,940 6,282,780
Term Loan Facilities due January 2023 (2) 950,265 1,317,389
Revolving Credit Facilities due July 2024 (1) (2) 713,919 -
Long-term debt, less current portion 8,198,124 7,600,169
4.750% Senior Secured Notes due March 2020 (2) - 434,789
5.500% Senior Secured Notes due June 2020 (1) - 27,366
Term Loan Facilities due January 2023 (2) 358,336 -
Current portion of long-term debt 358,336 462,155
Short-term borrowings 79,291 3,193
Total debt 8,635,751 8,065,517
Less: Cash and cash equivalents 1,346,741 662,934
Less: Debt issuance costs, net - Revolving Credit Facilities due July 2024 - 20,464
Net debt 7,289,010 7,382,119
(1) U.S. dollar-denominated debt
(2) Euro-denominated debt
Note: Net debt is a non-GAAP financial measure
14International Game Technology PLC
Reconciliations of Non-GAAP Financial Measures
($ and shares in thousands, except per share amounts)
Unaudited
For the three months ended
June 30,
2020 2019
Net (loss) income (282,142) 38,987
(Benefit from) provision for income taxes (11,321) 63,300
Interest expense, net 95,599 103,860
Foreign exchange loss, net 74,384 41,061
Other non-operating expense (income), net 29,374 (23,493)
Operating (loss) income (94,106) 223,715
Depreciation 100,228 103,940
Amortization - purchase accounting 42,080 47,514
Amortization - non-purchase accounting (1) 74,602 73,249
Restructuring expense 43,429 2,412
Stock-based compensation 1,162 2,912
Other (2) 1,011 (33)
Adjusted EBITDA 168,406 453,709
Cash flows from operating activities 167,831 445,107
Capital expenditures (60,481) (111,818)
Free Cash Flow 107,350 333,289
Net (loss) income attributable to IGT PLC (279,616) 4,856
Foreign exchange loss, net 74,384 41,061
Depreciation and amortization - purchase accounting 42,391 48,146
Restructuring expense 43,429 2,412
Loss on extinguishment of debt 23,260 9,628
Other (2) 1,011 (33)
Income tax impact on adjustments (3) (26,339) (15,374)
Adjusted net (loss) income attributable to IGT PLC (121,480) 90,696
Weighted-average shares - diluted 204,748 204,412
Adjusted weighted-average shares - diluted (4) 204,748 204,412
Net (loss) income attributable to IGT PLC per common share - diluted (1.37) 0.02
Adjusted net (loss) income attributable to IGT PLC per common share - diluted (0.59) 0.44
(1) Includes amortization of upfront license fees
(2) Primarily includes transaction-related costs
(3) Adjustments for income taxes are determined based on the statutory tax rate in effect in the respective jurisdiction where the adjustment originated
(4) Adjusted weighted-average shares – diluted includes shares that were excluded from the GAAP computation, due to the net loss as reported
15International Game Technology PLC
Reconciliations of Non-GAAP Financial Measures
($ and shares in thousands, except per share amounts)
Unaudited
For the six months ended
June 30,
2020 2019
Net (loss) income (516,241) 119,482
(Benefit from) provision for income taxes (8,189) 115,992
Interest expense, net 196,261 206,929
Foreign exchange loss (gain), net 4,024 (17,541)
Other non-operating expense (income), net 32,760 (22,995)
Operating (loss) income (291,385) 401,867
Goodwill impairment 296,000 -
Depreciation 198,248 209,271
Amortization - purchase accounting 88,750 95,718
Amortization - non-purchase accounting (1) 148,554 145,418
Restructuring expense 47,053 5,701
Stock-based compensation (11,806) 12,502
Other (2) 1,505 (95)
Adjusted EBITDA 476,919 870,382
Cash flows from operating activities 325,099 591,721
Capital expenditures (160,179) (231,003)
Free Cash Flow 164,920 360,718
Net (loss) income attributable to IGT PLC (527,904) 45,110
Foreign exchange loss (gain), net 4,024 (17,541)
Goodwill impairment 296,000 -
Depreciation and amortization - purchase accounting 89,373 96,982
Restructuring expense 47,053 5,701
Loss on extinguishment of debt 23,260 9,628
Other (2) 1,505 (95)
Income tax impact on adjustments (3) (38,263) (24,778)
Adjusted net (loss) income attributable to IGT PLC (104,952) 115,007
Weighted-average shares - diluted 204,591 204,532
Adjusted weighted-average shares - diluted (4) 204,591 204,532
Net (loss) income attributable to IGT PLC per common share - diluted (2.58) 0.22
Adjusted net (loss) income attributable to IGT PLC per common share - diluted (0.51) 0.56
(1) Includes amortization of upfront license fees
(2) Primarily includes transaction-related costs
(3) Adjustments for income taxes are determined based on the statutory tax rate in effect in the respective jurisdiction where the adjustment originated
(4) Adjusted weighted-average shares – diluted includes shares that were excluded from the GAAP computation, due to the net loss as reported
16INTERNATIONAL GAME TECHNOLOGY PLC
Select Financial Data As Constant Key Performance Indicators %
3 Month Period Ended June 30th Q2 '20 Q2 '19 Reported FX 3 Month Period Ended June 30th Q2 '20 Q2 '19 Change
Total revenue 166 601 -72% -72% Installed base units (end of period)
Gaming services 111 382 -71% -71% Casino 28,134 31,112 -9.6%
Terminal 37 279 -87% -87% Casino - L/T lease (1) 930 - NM
Gaming Other 75 103 -28% -27% VLT - Government sponsored (ex-Italy) 18,669 18,651 0.1%
Product sales 55 219 -75% -75% VLT - Italy supplier (B2B) 7,253 7,524 -3.6%
Terminal 44 155 -72% -72% Total installed base units 54,986 57,287 -4.0%
Other 11 64 -82% -82% Yield (average gross revenue per unit per day) $ 5.41 $ 27.96 -80.7%
(1) Yield calculations should exclude these units due to
Total revenue 394 531 -26% -25% accounting treatment as sales-type leases
Lottery services 372 495 -25% -24%
FMC 352 460 -23% -23% Additional Italian network details:
Lottery Instant ticket & draw games 352 460 -24% -23% VLT - Operator (B2C) 10,844 10,929 -0.8%
Other services 0 0 0% 0% AWP 37,138 40,268 -7.8%
LMA 20 36 -43% -43%
Product sales 22 35 -39% -38% Machine units shipped
New/expansion 1,443 1,138 26.8%
Total revenue 77 102 -25% -22% Replacement 1,552 10,086 -84.6%
Other Service revenue 77 102 -25% -23% Total machines shipped 2,995 11,224 -73.3%
Product sales 0 0 186% 186%
Global lottery same-store revenue growth
Revenue 637 1,234 -48% -48% Instant ticket & draw games 0.9%
Operating (Loss)/Income: Multistate jackpots -25.5%
Segment total 29 327 -91% -91% Total lottery same-store revenue growth (ex-Italy) -1.7%
Consolidated
Purchase accounting (42) (48) -12% -12% Italy lottery revenue growth -54.8%
Corporate support (80) (55) -46% -47%
Total (94) 224 NM NM
17Exhibit 99.2 August 4, 2020 2020 Second Quarter Results Ended June 30, 2020 1
Cautionary Statement Regarding Forward - Looking Statements This presentation may contain forward - looking statements (including within the meaning of the Private Securities Litigation Reform Act of 1995 ) concerning International Game Technology PLC and its consolidated subsidiaries (the “Company”) and other matters . These statements may discuss goals, intentions, and expectations as to future plans, trends, events, dividends, results of operations, or financial condition, or otherwise, based on current beliefs of the management of the Company as well as assumptions made by, and information currently available to, such management . Forward - looking statements may be accompanied by words such as “aim,” “anticipate,” “believe,” “plan,” “could,” “would,” “should,” “shall”, “continue,” “estimate,” “expect,” “forecast,” “future,” “guidance,” “intend,” “may,” “will,” “possible,” “potential,” “predict,” “project” or the negative or other variations of them . These forward - looking statements speak only as of the date on which such statements are made and are subject to various risks and uncertainties, many of which are outside the Company’s control . Should one or more of these risks or uncertainties materialize, or should any of the underlying assumptions prove incorrect, actual results may differ materially from those predicted in the forward - looking statements and from past results, performance, or achievements . Therefore, you should not place undue reliance on such statements . Factors that could cause actual results to differ materially from those in the forward - looking statements include (but are not limited to) the uncertainty of the duration, extent and effects of the COVID - 19 pandemic and the response of governments, including government - mandated property closures and travel restrictions, and other third parties on the Company’s business, results of operations, cash flows, liquidity and development prospects and the factors and risks described in the Company’s annual report on Form 20 - F for the financial year ended
December 31 , 2019 and other documents filed from time to time with the SEC, which are available on the SEC’s website at www . sec . gov and on the investor relations section of the Company’s website at www . IGT . com . Except as required under applicable law, the Company does not assume any obligation to update these forward - looking statements . You should carefully consider these factors and other risks and uncertainties that affect the Company’s business . All forward - looking statements contained in this presentation are qualified in their entirety by this cautionary statement . All subsequent written or oral forward - looking statements attributable to International Game Technology PLC, or persons acting on its behalf, are expressly qualified in their entirety by this cautionary statement . Non - GAAP Financial Measures This presentation contains non - GAAP financial measures, including adjusted EBITDA, adjusted diluted EPS, and free cash flow . Reconciliations of non - GAAP measures to the most directly comparable GAAP measures are included in the appendix to this presentation . Comparability of Results All figures presented in this presentation are prepared under U . S . GAAP, unless noted otherwise . Adjusted figures exclude the impact of items such as purchase accounting, impairment charges, restructuring expense, foreign exchange, and certain one - time, primarily transaction - related items . Reconciliations to the most directly comparable U . S . GAAP measures are included in the tables in this presentation . Constant currency changes for 2020 are calculated using the same foreign exchange rates as the corresponding 2019 period . Management uses non - GAAP financial measures to understand and compare operating results across accounting periods, for internal budgeting and forecasting purposes, and to evaluate the Company’s financial performance . Management believes these non - GAAP financial measures reflect the Company’s ongoing business in a manner that allows for meaningful period - to - period
comparisons and analysis of business trends . These constant currency changes and non - GAAP financial measures should however be viewed in addition to, and not as an alternative for, the Company’s reported results prepared in accordance with U . S . GAAP . Trademark Language The trademarks and/or service marks used herein are either trademarks or registered trademarks of IGT, its affiliates or its licensors . 2
Agenda 3 Marco Sala, CEO Business Update 1 Max Chiara, CFO Financial Results 2 Q&A 3
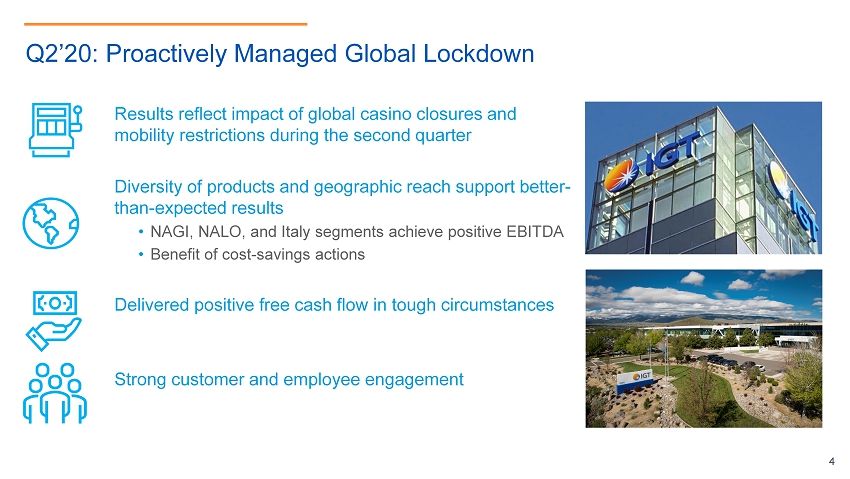
Q2’20: Proactively Managed Global Lockdown 4 Results reflect impact of global casino closures and mobility restrictions during the second quarter Diversity of products and geographic reach support better - than - expected results • NAGI, NALO, and Italy segments achieve positive EBITDA • Benefit of cost - savings actions Delivered positive free cash flow in tough circumstances Strong customer and employee engagement
5 Reinforced Priorities & Enhanced Continuity Plans to Navigate the “New Normal” • Global COVID - 19 crisis management team first priorities delivered • Employee safety remains top of mind on each initiative; work from home demonstrated effectiveness of approach • Customer service levels maintained during the quarter • Executed on temporary labor cost measures, inclusive reduction of discretionary expenses (marketing, travel, outside services) • On - going CapEx and R&D re - prioritization based on return/ payback metrics • Switching gears to structural cost saving initiatives • Generated positive free cash flow even with peak global lockdown during the quarter • Increased liquidity position and reduced near - term debt maturity People Cost Initiatives Cash Flow & Liquidity All actions focused on maintaining flexibility to manage uncertainty and prepare for “new normal”
Global SSR ex - Italy down 2% • 6% growth in North America SSR • 27% decrease in International SSR; several markets closed during period Italy wagers down ~40% on shutdown of Lotto games in April, POS closures, and severe mobility restrictions • Swift, progressive recovery since May Important YTD contract wins/extensions • Multi - year extensions in New York, Tennessee, Czech Republic • Virginia instant ticket printing Lottery: Remarkable Resilience Confirmed 6
Revenue and profits down on full impact of global lockdown Major markets progressively re - opening since late May; early indications are encouraging • 85% of U.S. casinos now open • Italy gaming halls open since June • Strong machine productivity largely compensating for capacity restrictions and social distancing protocols Good progress on key initiatives • Entry into historical horseracing market • Launch of PeakBarTop cabinet • Emerald Queen I - 5 casino system Gaming: Global Activities Closed for Most of Period 7
All digital activities continue to post strong growth rates • Italy digital wagers up 33% • Global B2B digital wagers up 75%; 100%+ in NA Significant commitment from Svenska Spel across multiple solutions • Remote game server, digital content; cashless play Bolstering status as leading U.S. sports betting technology provider • IGT present in 14 states; 30%+ share of 2019 wagers FanDuel multi - year sports betting and iGaming agreement Gaming: Growing Interest and Progress in Digital & Betting Activities 8
Announced new streamlined organization on July 1 with reporting on new segmentation scheduled for Q3 Simplified structure grounded in core competencies and global leadership positions; main objectives: • Provide greater responsiveness to customers and players • Harmonize best practices across both B2B and B2C channels in each product category • Reduce complexity and increase organizational efficiency to support IGT's intrinsic value Leverage key learnings and novel approaches from COVID - 19 pandemic New Org Structure Maximizes Growth Potential 9 Lottery Lottery 48% Gaming 52% 2019 Pro - Forma Revenue Lottery 67% Gaming 33% 2019 Pro - Forma Operating Income Split
Working on several initiatives to drive $200M+ in structural/discretionary cost savings: • Eliminate duplicative functions / streamline back office activities • Global technology optimization to re - focus on value accretive know - how • Rationalizing R&D investment based on risk/return priorities • Supply chain optimization focused on design to cost efficiency Improving trends are encouraging; we remain prudent with expectations Focus on Driving Efficiency and Process Optimization 10 Lottery
Financial Results 11
Q2'19 1,234 Q2'20 637 - 48% 224 Q2'19 EPS $0.02 Q2'20 EPS Q2'19 Adj. EPS $0.44 Q2'20 Adj. EPS -$0.59 -$1.37 Operating Income (Loss) Diluted EPS/ Adj. Diluted EPS Note: Adjusted results remove impact of purchase price amortization, impairment charges, restructuring expense and transactio n e xpense (see appendix for details) EUR/USD FX daily average: 1.12 in Q2’19; 1.10 in Q2’20 Revenue 12 Adjusted EBITDA Q2'19 454 Q2'20 168 Q2’20 Financial Highlights - 63% Q2’19 Q2’20 - 94 Includes $43M in restructuring
Revenue Key Performance Indicators • Service revenue impacted by casino closures and multi - year poker contract in PY • New & expansion units driven by 977 HHR units; higher systems revenue in PY • Shipped 1,344 replacement units, ahead of internal expectations • Operating loss reflects casino closures as well as OK strategic transaction and high - margin poker and systems sales in PY, partly offset by cost - saving initiatives Q2'19 274 Service -120 Product Sales -58 Excluding FX 96 FX Q2'20 96 13 Q2’20 North America Gaming & Interactive Highlights % Change % Change at Q2'19 Q2'20 as Reported Constant FX Revenue 274 96 -65% -65% Operating income/(loss) 85 -20 NM NM Machine Units Shipped Q2'19 Q2'20 New & expansion 438 1,382 Replacement 4,223 1,344 Total 4,661 2,726 Casino Installed Base Q2'19 (1) Q3'19 (1) Q4'19 Q1'20 Q2'20 Installed base (units) 21,073 21,071 20,493 18,676 18,410 L/T lease installed base (units) (2) 917 930 Total 21,073 21,071 20,493 19,593 19,340 (1) 2,076 and 147 unit reductions in Q2 '19 and Q3 '19, respectively, per OK strategic agreement (2) Yield calculations should exclude these units due to accounting treatment as sales-type leases
Revenue Key Performance Indicators Q2'19 309 Lottery Service 12 LMA -16 Gaming Service -19 Product Sales -13 Excluding FX 273 FX Q2'20 273 14 • Strong SSR growth for instant ticket and draw games despite mobility restrictions and lower jackpot activity • LMA reflects reduced play levels in NJ and lower pass - through revenue • Gaming service down on VLT venue closures, partly offset by growth in Canada iGaming • Product sales primarily reflects lower systems revenue • Operating income roughly in - line as same - store revenue growth offsets higher - margin LMA and gaming machine contributions in the prior year are largely offset by cost - saving initiatives Q2’20 North America Lottery Highlights % Change % Change at Q2'19 Q2'20 as Reported Constant FX Revenue 309 273 -12% -11% Operating income 78 75 -4% -3% Same-store revenue growth Q2'19 Q2'20 Instant ticket & draw games 5.4% 10.5% Multistate jackpots 23.8% -28.0% Total SSR growth 7.2% 6.2% Q2'19 Q3'19 Q4'19 Q1'20 Q2'20 VLT installed base (units) 14,215 14,294 13,553 13,559 13,559
Q2'19 229 Lottery Service -13 Gaming Service -15 Product Sales -106 Other -8 Excluding FX 87 FX -3 Q2'20 84 Revenue Key Performance Indicators 15 • Product sales lower on fewer unit shipments, primarily in LAC, as well as higher Sweden VLT shipments and software sales in PY • Lottery SSR trends improving month after month • Service revenue down on casino closures; Installed base stable • Operating loss reflects margin impact of lower unit volume and revenue mix, partly offset by cost - saving initiatives Q2’20 International Highlights % Change % Change at Q2'19 Q2'20 as Reported Constant FX Revenue 229 84 -64% -62% Operating income/(loss) 30 -20 NM NM Machine Units Shipped Q2'19 Q2'20 New & expansion 700 61 Replacement 5,863 208 Total 6,563 269 Same-store revenue growth Q2'19 Q2'20 Instant ticket & draw games 2.4% -28.2% Multistate jackpots 11.0% -7.8% Total SSR growth 2.8% -27.1% Q2'19 Q3'19 Q4'19 Q1'20 Q2'20 Installed base (units) 14,475 14,332 14,857 14,763 14,834
Q2'19 422 Lottery -104 Machine Gaming -125 Sports Betting & Other -6 Excluding FX 187 FX -3 Q2'20 184 Revenue Key Performance Indicators 16 • Lottery wagers reflect timing of game reopening and POS restrictions; trends improved each month in period • Machine gaming affected by closure of gaming halls through the middle of June • Interactive wagers up a sound 44% • Increase in commercial services revenue more than offset by lower sports betting due to lack of sporting events • Operating loss primarily reflects COVID - 19 restrictions, partly offset by cost - saving initiatives Q2’20 Italy Highlights % Change % Change at Q2'19 Q2'20 as Reported Constant FX Revenue 422 184 -56% -56% Operating income/(loss) 133 -7 NM NM €M Q2'19 Q2'20 % Growth Lotto wagers 2,064 914 -55.7% 10eLotto 1,507 610 -59.5% Core 479 256 -46.5% Late numbers 31 21 -32.4% MillionDAY 47 26 -43.6% S&W wagers 2,257 1,649 -27.0% Gaming wagers VLT - operator (B2C) 1,427 150 -89.5% AWP 916 83 -90.9% Interactive 508 729 43.7% Sports betting wagers 252 79 -68.5% Sports betting payout 82.2% 88.1% 5.9 pp
2019 Average Q2 Run Rate Fixed Operating Expenses¹ Maintenance CapEx On Track to Deliver $500M in 2020 Cost Savings/Avoidance 17 ~$235M ~$155M 1/3 reduction from original maintenance CapEx plan Similar reduction expected H2’20 Cuts deepest for Gaming activities Lottery CapEx mostly contractual Primarily related to: • Temporary, company - wide salary reductions and furloughs • Reduction of marketing, travel, outside services expenses Average Monthly Fixed/Discretionary Costs (1) Excludes variable costs and restructuring expense; operating expenses include fixed costs, discretionary costs, incentive com pe nsation, and interest payments on debt Achieved Q2 run rate in - line with expectations Expect normalization of certain expenses in H2’20 (up from $155M run rate) as recovery continues • March – December 2020 average monthly run rate of $185M
18 • Delivered $325 million in operating cash flow; $165 million in free cash flow • $93 million in net debt reduction since 12/31/19 as reported; $80 million at constant currency • Leverage (net debt/LTM EBITDA) of 5.52x compared to 4.31x at 12/31/19 and 4.42x at 6/30/19 Cash Flow, Net Debt and Leverage Profile Net Debt/LTM EBITDA 4.42x 4.31x 5.52x $325 net cash provided by operating activities Net Debt Net Debt Net Debt
358 358 605 740 1,000 1,012 560 1,100 840 750 560 750 1,010 2020 2021 2022 2023 2024 2025 2026 2027 2028 2029 Debt Maturity Profile at June 30, 2020 Undrawn RCF Notes Bank Debt Ample Liquidity, No Significant Near - Term Maturities 19 Total liquidity of $2.3 billion as of 6/30/20 • $1.3 billion in unrestricted cash; $1.0 billion in additional borrowing capacity Issued $750 million 5.25% Notes due 2029 in the quarter • $500 million of net proceeds used to fund partial tender of 6.25% Notes due 2022 • Lowest USD - denominated coupon ever issued by company • Longest duration issuance since 2015 Bank Debt 24% USD Notes 41% Euro Notes 35% 79
Key Messages 20 Resilient, diversified business model • Large, geo - diversified revenue base • Resilience in lottery evident in improving wager trends Strong liquidity position • $2.3 billion in total liquidity provides buffer against an economic downturn • Ample resources to cover maturities through 2022 Delivered positive EBITDA and FCF • Despite extremely challenging market conditions • Allows for execution of deleveraging strategy Disciplined cost management • On track to meet $500 million cost savings target for 2020 • Focused on structural changes to drive permanent savings
Q & A 21
Appendix 22
23 Q2’20 Income Statement (As Reported) Income Statement Q2'20 Q2'19 % Change Service revenue 560 980 -43% Product sales 77 254 -70% Total Revenue 637 1,234 -48% Adjusted EBITDA 168 454 -63% Operating (Loss) Income (1) (94) 224 NM Interest expense, net (96) (104) Foreign exchange (74) (41) Other (29) 24 Financial Charges, Net (199) (121) (Loss) Income Before Tax (293) 102 Net (Loss) Income (282) 39 Net (Loss) Income attributable to IGT PLC (280) 5 Diluted EPS (1.37) 0.02 (1) Includes $43 million and $2 million in restructuring charges, respectively
24 Q2’20 Reconciliation of Non - GAAP Measures As Reported $ in thousands Q2'20 Q2'19 Net (loss) income (282) 39 (Benefit from) provision for income taxes (11) 63 Interest expense, net 96 104 Foreign exchange loss, net 74 41 Other non-operating expense (income), net 29 (23) Operating (loss) income (94) 224 Depreciation 100 104 Amortization - purchase accounting 42 48 Amortization - non-purchase accounting (1) 75 73 Restructuring expense 43 2 Stock-based compensation 1 3 Other (2) 1 - Adjusted EBITDA 168 454 Cash flows from operating activities 168 445 Capital expenditures (61) (112) Free Cash Flow 107 333 (1) Includes amortization of upfront license fees (2) Primarily includes transaction-related costs
25 Q2’20 Reconciliation of Non - GAAP Measures As Reported $ and shares in thousands, except per share amounts Q2'20 Q2'19 Net (loss) income attributable to IGT PLC (280) 5 Foreign exchange loss, net 74 41 Depreciation and amortization - purchase accounting 43 48 Restructuring expense 44 2 Loss on extinguishment of debt 23 10 Other (2) 1 - Income tax impact on adjustments (3) (26) (15) Adjusted net (loss) income attributable to IGT PLC (121) 91 Weighted-average shares - diluted 204,748 204,412 Adjusted weighted-average shares - diluted (4) 204,748 204,412 Net (loss) income attributable to IGT PLC per common share - diluted (1.37) 0.02 Adjusted net (loss) income attributable to IGT PLC per common share - diluted (0.59) 0.44 (2) Primarily includes transaction-related costs (3) Adjustments for income taxes are determined based on the statutory tax rate in effect in the respective jurisdiction where the adjustment originated (4) Adjusted weighted-average shares - diluted includes shares that were excluded from the GAAP computation, due to the net loss as reported
YTD 2019 2,379 YTD 2020 1,578 - 34% 402 YTD 2109 EPS $0.22 YTD 2020 EPS YTD 2019 Adj. EPS $0.56 YTD 2020 Adj. EPS -$0.51 -$2.58 Operating Income (Loss) Diluted EPS/ Adj. Diluted EPS Note: Adjusted results remove impact of purchase price amortization, impairment charges, restructuring expense and transactio n e xpense (see appendix for details) EUR/USD FX daily average: 1.13 YTD in 2019; 1.10 YTD in 2020 Revenue 26 Adjusted EBITDA YTD 2019 870 YTD 2020 477 YTD ‘20 Financial Highlights - 45% YTD 2019 YTD 2020 - 291 Includes $47M in restructuring Includes $296M in goodwill impairment
27 YTD ‘20 Cash Flow Statement Cash Flow YTD '20 YTD '19 Net Cash Flows from Operating Activities 325 592 CapEx (160) (231) Free Cash Flow 165 361 Debt Proceeds/(Repayment), Net 591 33 Other - Net (129) (245) Other Investing/Financing Activities 462 (212) Net Cash Flow 627 149 Effect of Exchange Rates/Other 8 (4) Net Change in Cash and Restricted Cash 635 145 Cash and Restricted Cash at End of the Period 1,530 657
You can also read