GAME CHANGING GAME DIGITAL PLC | 2018/19 INTERIM RESULTS - 21ST MARCH 2019
←
→
Page content transcription
If your browser does not render page correctly, please read the page content below
GAME DIGITAL PLC – 2018/19 INTERIM RESULTS

       GAME CHANGING
       GAME DIGITAL PLC | 2018/19 INTERIM RESULTS
       21ST MARCH 2019
GAME DIGITAL PLC – 2018/19 INTERIM RESULTS

FORWARD LOOKING STATEMENTS

 This presentation includes statements that are, or may be deemed to be, “forward-looking
 statements”. These forward-looking statements can be identified by the use of forward-looking
 terminology, including the terms “believe”, “estimates”, “plans”, “projects”, “anticipates”, “expects”,
 “intends”, “may”, “will”, or “should” or, in each case, their negative or other variations or comparable
 terminology. These forward-looking statements include matters that are not historical facts and
 include statements regarding the Company’s intentions, beliefs or current expectations.

 Any forward-looking statements in this presentation reflect the Company’s current expectations
 and projections about future events. By their nature, forward-looking statements involve a
 number of risks, uncertainties and assumptions that could cause actual results or events to
 differ materially from those expressed or implied by the forward-looking statements. These risks,
 uncertainties and assumptions could adversely affect the outcome and financial effects of the plans
 and events described herein. Forward-looking statements contained in this presentation regarding
 past trends or activities should not be taken as a representation that such trends or activities will
 continue in the future. You should not place undue reliance on forward- looking statements,
 which speak only as of the date of this presentation. No representations or warranties are made
 as to the accuracy of such statements, estimates or projections.

 Please note that the Directors of the Company are, in making this presentation, not
 seeking to encourage shareholders to either buy or sell shares in the Company. Shareholders in
 any doubt about what action to take are recommended to seek financial advice from an
 independent financial advisor authorised by the Financial Services and Markets Act 2000.

                                                                                                            2
MARTYN GIBBS
CHIEF EXECUTIVE OFFICER

                          3
GAME DIGITAL PLC – 2018/19 INTERIM RESULTS

H1 GROUP HEADLINES
SOLID GTV AND GROSS PROFIT RATE PERFORMANCE ACHIEVED IN A CHALLENGING RETAIL
ENVIRONMENT
    •    Group GTV broadly flat on a like-for-like basis
            •   GTV improvement of 5.8% in Content (physical and digital)
            •   GTV increased by 9.2% in Accessories & Other
            •   GTV in Hardware down (9.3)% and Preowned down (20.9)%
    •    Group gross profit rate maintained at 21.0%
    •    Group Adjusted EBITDA up 21.7% to £25.8 million (2018: £21.2 million)

DRIVING OPERATIONAL EFFICIENCIES
    •    Strong Core UK Retail performance with Adjusted EBITDA growth of 49.5% to £14.8 million from
         improved gross profit rate and the delivery of £4.9 million of operational efficiencies and cost
         savings
    •    Average length to break on leases in the UK and Spain under 1 year and average savings on rents
         renegotiated in the period of 59%
    •    Further strategic progress achieved towards repositioning and right sizing the retail business in
         the UK with savings in distribution, head office, store payroll and store rent
    •    Continued strong liquidity with Group cash of £95.5 million as at 26 January 2019 (2018: £84.9
         million) and access to aggregated facilities as at today’s date of up to £110 million across the UK
         and Spain

STRATEGY PROGRESSION TOWARDS REPOSITIONING THE BUSINESS
    •    20% increase in station count this period, and 44% increase in stations YoY
    •    2 new arenas opened, Stratford and West Thurrock Lakeside
    •    52% Increase in pay-to-play revenue in H1 FY19 vs H1 FY18, driven by new arenas and
         enlargement of existing arenas

                                                                                                               4
GAME DIGITAL PLC – 2018/19 INTERIM RESULTS

                                             5
GAME DIGITAL PLC – 2018/19 INTERIM RESULTS

BELONG IS A SOCIAL GAMING NETWORK

               1                              2                             3                              4
              Our arenas provide a physical   Each arena can support more   The community talks to each    Arena Clash and CRM retain
              home for the community          community members than        other generating content for   and continuously engage
                                              the number of stations. A     BELONG that reaches new        BELONG gamers in the
                                              network of gamers forms       potential community            network, further building
                                              around the arena              members                        customer value

                                                                                                                                        6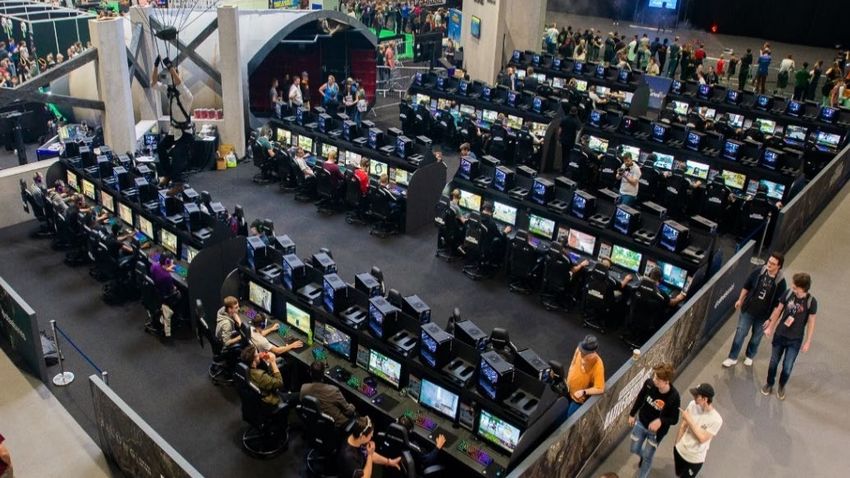
GAME DIGITAL PLC – 2018/19 INTERIM RESULTS

BELONG GAMER SEGMENTATION
 •     Five BELONG gamer segments established and profiled:
         1.   Competitive & community – Strong interest in esports
         2. Fun with friends – Enjoy playing together in one location
         3. Private player – Solo gamers playing to unwind in their downtime
         4. Time together – Parents & children who like to game together
         5. Grateful guardians – Parents not interested in gaming, but children are

 •    Establishing programmes to target different segments that increases
      utilisation
 •    Segmentations inform decision making when planning new arena locations
 •    Primary focus is segment one, competitive gamers, with a tailored programme
      of activities such as Arena Clash and Arena Cups (multi-arena), as well as
      community cups and leader board competitions (individual arenas)
 •    Subscription trials target segment one gamers, offering them better value
      pricing per hour and incentivising them to visit BELONG more frequently
 •    Other four segments continue to be important, with tailored experiences such
      as parties and casual play which drives utilisation within these segments

                                                                                      7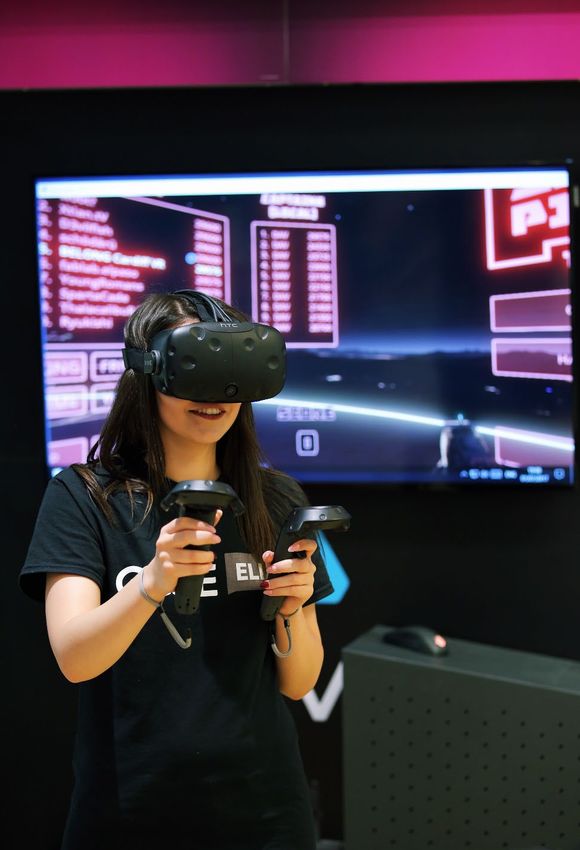
GAME DIGITAL PLC – 2018/19 INTERIM RESULTS

BELONG’S ESPORTS PROGRAMME IN 2019
       APRIL                 MAY             JUNE            JULY           AUGUST        SEPTEMBER    OCTOBER        NOVEMBER        DECEMBER

           ARENA
                                             ARENA CLASH SUMMER                                                   ARENA CLASH WINTER
           CLASH
                                             MINIMUM OF FIVE TITLES                                              MINIMUM OF FIVE TITLES
           SPRING

              ARENA RIVALS                                                           ARENA RIVALS

                                                                JUNIOR ARENA CLASH

                                                                      ACADEMY BOOT CAMPS

                    ESPORTS TEAMS                                                                                                         ACADEMY
                                                            ACADEMY CLASSES                     ESPORTS TEAMS MEET & GREETS
               RELATIONSHIPS FORMALISED                                                                                                   CLASSES

  TOURNAMENT                                                              TOURNAMENT
   ZONE AT I64                                                             ZONE AT I65

  ARENA CLASH                                                             ARENA CLASH
  FINALS AT I64                                                           FINALS AT I65

                                                                                                                                                 8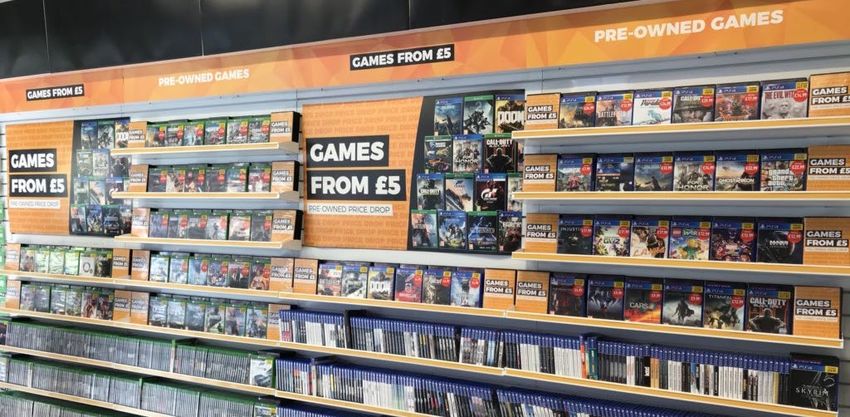
GAME DIGITAL PLC – 2018/19 INTERIM RESULTS

CREATING VALUE THROUGH BELONG

                   52%                            20%                        44%                       72%                         £4.71

              Increase in pay-to-play               Increase in                Increase in         Increase in pay-to-play        H1 FY19 Average
                revenue in H1 FY19                stations this FY       stations YoY at Jan 19    revenue in arenas with         Price Per Hour vs
                                                                                                    an increased station           H1 FY 18 £4.43
                                                                                                      count for H1 FY19

                   28%                             740                       47%                       224k                        54%

             Utilisation rate for the H1           Parties hosted         Increase in average        Total gaming hours             More spent by
              FY19 vs 28.5% H1 FY18              in H1 FY19, a 64%           customer value           in H1 FY19, a 25%         subscription customer
                                             increase vs H1 FY18 (450)       Jan 19 vs Jan 18     increase vs H1 FY18 (179k)   on arena play time than
                                                                           (Rolling 12 months)                                    segment 1 gamer

                                                                                                                                                         9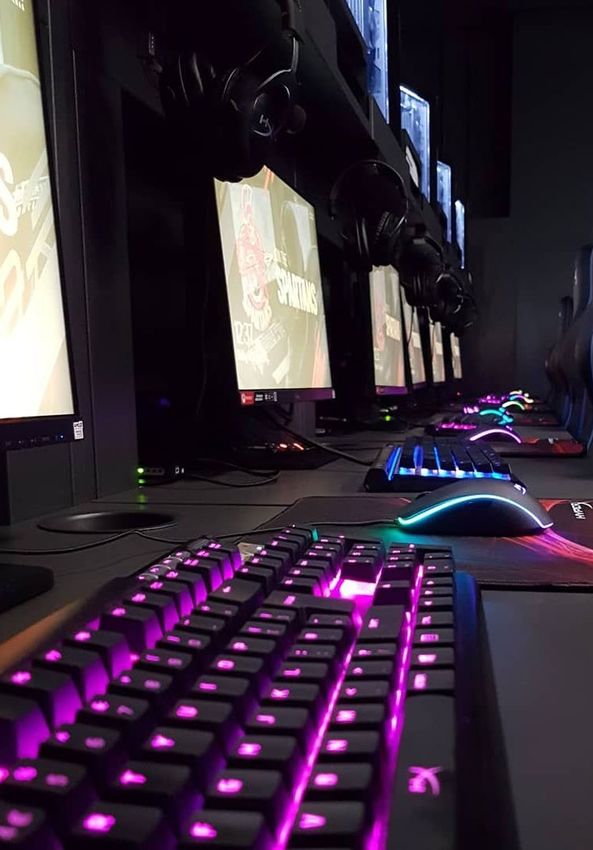
GAME DIGITAL PLC – 2018/19 INTERIM RESULTS

BELONG LOCATIONS
  •       Total number of stations increased by 44% to 4401 by          CURRENT BELONG GAMING
                                                                                                      Station Count
                                                                                                      unchanged

          January 2019 vs 3051 in January 2018                          ARENA LOCATIONS               Station Count Increased

                                                                                                      New Arena Location

          Two new arenas opened in the half – Stratford and West
                                                                                                      FY18/19
  •
          Thurrock (Lakeside Sports Direct Concession), catering to
                                                                        •   Bradford
          two different gaming communities                              •   Bristol Cribbs Causeway
                                                                        •   Bristol City Centre
  •       Ongoing focus to drive hours played in existing arenas by     •   Cardiff
          increasing station count, with seven arenas increased         •   Colchester
                                                                        •   Craigavon
  •       Arenas with an increased station count have seen a slight     •   Gateshead
                                                                        •   Glasgow
          decline in utilisation that is more than compensated for by   •   Hull
                                                                        •   Kingston
          the total increased revenue
                                                                        •   London Wardour Street
  •       Top 50 locations identified across the UK, with the key       •   London Stratford
                                                                        •   Manchester
          requirement being larger locations to accommodate             •   Milton Keynes
                                                                        •   Norwich
          higher station counts                                         •   Portsmouth
  •       Establishing larger premises for higher station count         •   Preston
                                                                        •   Plymouth
  •       Defining the best possible rent deals based on current        •   Teesside
                                                                        •   West Thurrock
          property landscape                                            •   York

1 EXCLUDING   ALT GAMING LOUNGE

                                                                                                                           10
GAME DIGITAL PLC – 2018/19 INTERIM RESULTS
VENUE IMPROVEMENTS FOR THE COMPETITIVE GAMER
HIGH-SPEC KIT DESIGNED FOR COMPETITIVE PLAY LARGER 100-SEATER LOCATIONS
ESPORTS TRIBE
JERSEYS
LOCAL COMMUNITY AREAS &
COMPETITIVE LEADER BOARDS
11GAME DIGITAL PLC – 2018/19 INTERIM RESULTS
THE VALUE WE DELIVER FOR OUR SUPPLIER PARTNERS
BELONG Gaming Arenas social
Supplier partners and publishers Partners and/or BELONG utilise
channels and programmes Lapsed, existing and new gamers
seek ways to promote their this content to sell/promote
provide authentic engagement generate content by engaging
products or brand brands and products
mechanics to reach gamers
OUR PARTNERS & BRANDS WE WORK WITH
12RAY KAVANAGH
CHIEF FINANCIAL OFFICER
13GAME DIGITAL PLC – 2018/19 INTERIM RESULTS
H1 GROUP FINANCIAL SUMMARY
All figures in £m (unless stated) H1 2019 H1 2018 VAR, %
• Group GTV down 1.4% reflecting:
Gross Transaction Value (GTV)1 578.4 586.8 (1.4) • LFL sales broadly flat
• Content improvement of 5.8%
Gross profit rate² 21.0% 21.0% - • Accessories & Other up 9.2%
• Hardware and Preowned down 9.3% and
20.9% respectively
Underlying operating costs³ (95.8) (101.9) 6.0
• Gross profit rate maintained at 21.0%
• Strong cost discipline across the Group with £4.9
Adjusted EBITDA 25.8 21.2 21.7
million of savings realised in UK Retail
• Adjusted EBITDA increased by £4.6 million as a result
Adjusted profit before tax 19.9 14.2 40.1
of UK Retail improvement
• Positive cash generation continued in the period
Net cash from operating activities 41.6 32.2 29.2
• Group remains well funded with net cash of £95.5
million at 26 January 2019 and current facilities of up
Net cash 95.5 84.9 12.5
to £110 million
22% GROWTH IN ADJUSTED EBITDA WITH SIGNIFICANT IMPROVEMENT IN UK RETAIL
GROUP REMAINS WELL FUNDED AND HAS £110M OF FACILITIES AVAILABLE
¹ GROSS TRANSACTION VALUE IS A NON-IFRS MEASURE DEFINED AS TOTAL RETAIL RECEIPTS AND ALL OTHER GROUP REVENUE EXCLUDING VAT AND BEFORE THE DEDUCTION OF LOYALTY POINTS AND OTHER ACCOUNTING ADJUSTMENTS. GTV REFLECTS THE FULL SALES VALUE OF
DIGITAL SALES, AGENCY SALES, WARRANTIES AND OTHER SIMILAR ARRANGEMENTS AND THEREBY INCLUDES THE PUBLISHERS' AND SELLERS' SHARES OF THOSE TRANSACTIONS
² GROSS PROFIT EXPRESSED AS A PERCENTAGE OF GTV
³ OTHER OPERATING EXPENSES EXCLUDING DEPRECIATION AND AMORTISATION CHARGES, AND BEFORE EXCEPTIONAL AND ADJUSTING ITEMS
14GAME DIGITAL PLC – 2018/19 INTERIM RESULTS
GROUP GTV BY CATEGORY
All figures in £m (unless stated) H1 2019 H1 2018 VAR, %
Total Content 280.8 265.3 5.8 • Physical software in line with previous year with UK
growing 3% and improving market share
Physical software 190.1 190.8 (0.4)
• Digital growth driven by continued popularity of
Digital content 90.7 74.5 21.7 Fortnite and enhancing gaming experience
Total Hardware 133.1 146.7 (9.3) • Hardware sales growth in Nintendo Switch and
PlayStation 4, but older formats and Xbox sales down
Total Accessories & other 95.3 87.3 9.2
Core Accessories & other 89.8 78.4 14.5 • Growth in PC & console accessories, licensed
merchandise and figurines offset the decline in VR
Events & Esports 5.5 7.1 (22.5) categories
Multiplay Digital¹ - 1.8 - • Sales in Events declined from removal of Runefest,
Bricklive and Minecon events
Total Preowned 69.2 87.5 (20.9)
Preowned core 51.1 63.2 (19.1) • Decline in core driven by both hardware and software
where the market continues structural decline
Preowned tech 18.1 24.3 (25.5) • Tech has also seen a decline, partly due to the general
slowdown in the mobile replacement cycle
Total 578.4 586.8 (1.4)
STRONG GTV GROWTH IN DIGITAL, ACCESSORIES AND LICENSED MERCHANDISE
TO PARTLY MITIGATE PREOWNED AND HARDWARE DECLINE
¹MULTIPLAY DIGITAL SOLD 28 NOVEMBER 2017
15GAME DIGITAL PLC – 2018/19 INTERIM RESULTS
GROUP GROSS PROFIT RATE (AS % OF GTV) BY CATEGORY
H1 2019 H1 2018 % PT CHANGE
Total Content 21.7 21.6 0.1 • Benefiting from improved mix of new releases where
the Group secured higher margin exclusives for the
majority of these releases
Physical software 25.6 24.5 1.1
• Digital margins down from mix of console and non-
console sales
Digital content 13.5 14.2 (0.7)
• Lower promotional activities together with improved
PlayStation bundling on new software releases
Hardware 7.7 7.1 0.6
• Mix effect of products and services in this category, with
improvements on accessories & licensed merchandise
Accessories & Other 30.1 32.9 (2.8) offsetting decline on VR & toys
• Driven by hardware & tech trading and tighter stock
Preowned 31.5 30.5 1.0 management
• Overall Group gross profit rate maintained despite
Total 21.0 21.0 - higher mix of lower margin digital and declining sales
of preowned
HIGHER MARGIN RATES ACHIEVED ACROSS SOFTWARE, HARDWARE AND PREOWNED
16GAME DIGITAL PLC – 2018/19 INTERIM RESULTS
GROUP OPERATING COSTS
Group operating expenses1
H1 2019 H1 2018 VAR, £m
All figures in £m (unless stated)
Selling & distribution costs 76.7 80.5 (3.8) • Significant cost savings and operational
efficiencies realised in the UK as detailed
Administrative costs 24.4 27.8 (3.4)
on the next page
Total operating expenses 101.1 108.3 (7.2)
• Spain Retail costs up €0.4 million in local
Less: Underlying depreciation & amortisation (5.3) (6.4) (1.1) currency, largely volume-related, and in
Total operating expenses before D&A 95.8 101.9 (6.1) sterling this equated to an increase of £0.3
million
As % of revenue 19.4% 19.7%
• Events & Esports costs down £1.5 million
Group continuing costs by division1,2 • Higher costs from the continued
H1 2019 H1 2018 VAR, £m
All figures in £m (unless stated) expansion of BELONG were offset by
Core Retail 93.3 97.9 (4.6) savings in Game Esports & Events and
UK Retail 62.4 67.3 (4.9)
from the sale of Multiplay Digital part way
through last year
Spain Retail 30.9 30.6 0.3
Spain Retail, €m 34.7 34.3 0.4
Events, Esports & Digital 2.5 4.0 (1.5)
CONTINUED STRONG COST REDUCTION PROGRAMME IN THE UK BUSINESS
¹EXCLUDES EXCEPTIONAL AND ADJUSTING ITEMS
² BEFORE DEPRECIATION AND AMORTISATION
17GAME DIGITAL PLC – 2018/19 INTERIM RESULTS
UK OPERATIONAL EFFICIENCIES & COST SAVINGS CONTINUED
Total UK Retail savings £m H1 2019 TOTAL
• H1 savings of £4.9 million delivered across all
aspects of the UK operation
Property (rent & rates) 1.7
• Significant savings delivered on property
estate through annualisation of prior year
reductions and new in-year negotiations
Payroll 1.6 • Store payroll hours reduced over peak trading
while maintaining customer service levels
• Head office reorganisation fully embedded
during the period
Procurement, distribution, efficiency savings and other 1.6
• Annualisation of changes made during FY18
delivered ongoing benefits in distribution and
controllable costs
Total 4.9 • Further property savings already secured in H2
to date
CONTINUED DELIVERY OF EFFICIENCY INITIATIVES & OTHER COST SAVING ACTIONS
18GAME DIGITAL PLC – 2018/19 INTERIM RESULTS
UK PROPERTY OPTIMISATION PROGRAMME UPDATE
• Average length to first break 0.8 years UK Store Lease Expiries at H1 2019
• Successfully realising opportunities to further reduce 160
UK estate costs
140
• Annualised rent reductions of c.£0.5 million
138
realised in H1 representing a 59% reduction
120
• Since the end of the period this has increased to
£2.2 million 100
• Further potential opportunities continue to be
80
negotiated and large, multi-site landlord
negotiations have commenced 60
• Flexibility is being retained in the estate which allows 52 54
for BELONG growth strategy and to respond to UK 40
retail market conditions
20
• 26 leases on zero rent at the end of H1 2019 19
11
• A total 138 lease events on rolling breaks, plus 0
Rolling Break To December 2019 December 2020 December 2021 2022+
52 potential events before December 2019
19GAME DIGITAL PLC – 2018/19 INTERIM RESULTS
CASH FLOW & NET CASH
All figures in £m (unless stated) H1 2019 H1 2018 VAR, £m
Cash generated by operations 42.8 36.3 6.5 • Strong closing cash position of £95.5 million
• All facilities undrawn at end of the period and UK facilities
Finance costs and tax (1.2) (4.1) (2.9)
yet to be drawn
Net cash from operating activities 41.6 32.2 9.4 • Total available facilities c.£110 million as at today’s date
Capital expenditure (4.0) (6.2) 2.2 • UK ABL facility of up to £50 million, rising to £75
million in peak
Disposal of Multiplay Digital - 14.9 (14.9)
• SPD capex facility of £35 million
Dividends - (1.7) 1.7
• Working capital and guarantee facilities in Spain of
Finance leases (0.3) (1.3) 1.0 €28 million, rising to €44 million in peak
• Total maximum facilities over peak season of c.£149 million
Other (0.5) (0.2) (0.3)
Movement in cash 36.8 37.7 (0.9)
Opening net cash 58.7 47.2 11.5
Closing net cash 95.5 84.9 10.6
STRONG CASH GENERATION AND UK FACILITIES YET TO BE DRAWN
20BUSINESS & STRATEGY
GAME DIGITAL PLC | 2018/19 INTERIM RESULTS
21GAME DIGITAL PLC – 2018/19 INTERIM RESULTS
BUILDING THE MOST VALUABLE COMMUNITY FOR GAMERS
CORE SPECIALIST RETAIL MAJOR GAMING EVENTS
BUILDING THE
MOST VALUABLE
COMMUNITY FOR
GAMERS
ESPORTS, BELONG & COMPETITIVE GAMING
22GAME DIGITAL PLC – 2018/19 INTERIM RESULTS
GAME CHANGING STRATEGY PROGRESS & PRIORITIES
Continue to improve our core Expand the group’s live and
multichannel retail business, online gaming services for
Optimise the organisation’s
based around the needs and consumers and publishers in
efficiency while investing for the
behaviours of customers, in order to build customer &
future
order to maximise market gamer engagement and
IMPROVE potential and profitability OPTIMISE EXPAND generate incremental revenues
23GAME DIGITAL PLC – 2018/19 INTERIM RESULTS
GAME CHANGING STRATEGY PROGRESS & PRIORITIES
Continue to improve our core multichannel retail business, based around the needs and behaviours of
customers, in order to maximise market potential and profitability
IMPROVE
1. Expansion of the Group’s exclusive proposition across new game releases and licensed merchandise
2. Ongoing development of new product categories including PC gaming accessories and licensed merchandise
for gamers
3. Continued growth of market share in online through proposition improvements:
• Enhanced customer journey across desktop, mobile and social channels
• New ‘paid for’ delivery services offered increasing choice and convenience. Further service enhancements
planned in H2
• Access to extended ranges online including through Marketplace
• Increased range and availability of preowned stock online using store fulfilment
24GAME DIGITAL PLC – 2018/19 INTERIM RESULTS
GAME CHANGING STRATEGY PROGRESS & PRIORITIES
Optimise the organisation’s efficiency while investing for the future
OPTIMISE
1. Leveraging our specialist retailer credentials to improve supplier terms
2. Focus on better service across our channels resulted in a 30% reduction in inbound customer service contacts,
with wait times reduced by more than 80% vs. last year
3. Significant operating cost savings delivered through efficiencies and better procurement in distribution and
across the store estate
4. Further material savings in property costs
5. More selective investment in marketing across our channels, spending only where the ROI justifies it
6. Maintained robust stock and cash disciplines across all areas of the business ensuring our available cash
resources provide adequate headroom
25GAME DIGITAL PLC – 2018/19 INTERIM RESULTS
GAME CHANGING STRATEGY PROGRESS & PRIORITIES
Expand the group’s live and online gaming services for consumers and publishers in order to build
customer & gamer engagement and generate incremental revenues
EXPAND
1. Delivering growth of revenue and margin through our existing arena network:
2. Ongoing focus on identifying suitable arena locations to support expansion
3. Expansion of Arena Clash to feature 5 major titles across 21 participating arenas
4. Growth of the BELONG online community and unique visitors to Belong.gg
5. Evaluating potential strategic international opportunities for BELONG
6. Continued growth of Insomnia in the UK with I64 (April) to feature more esports tournament zones
7. International expansion of Insomnia franchise events. First overseas event held in Egypt in Oct 2018, with Dubai
and Dublin scheduled later this year
26MARKET UPDATE
GAME DIGITAL PLC | 2018/19 INTERIM RESULTS
27GAME DIGITAL PLC – 2018/19 INTERIM RESULTS
UK & SPAIN MARKET UPDATE
• The UK and Spanish mint console markets have UK MINT VIDEO GAME MARKET SPAIN MINT VIDEO GAME MARKET
both shown growth in the period
• Driven by consumer demand for the
15.4%
PlayStation 4 and Nintendo Switch 14.1%
13.5%
consoles
• Digital currency, PC and console
8.8%
accessories growth driven by Fortnite and
other Battle Royale games 5.8%
• For the 6 weeks ended 9 March 2019, the mint 3.6% 3.5%
2.7%
1.9% 1.9% 1.5%
market in the UK market was down 5.9% and in
Spain it was down 2.3% on a constant currency
basis
-2.3%
• UK market has seen a decline in hardware
and digital -5.9%
• The Spanish market has seen similar
declines in hardware and digital
• Accessories is up in both markets -12.5%
H1 16/17 H2 16/17 H1 17/18 H2 17/18 H1 18/19 WEEKS WEEKS H1 16/17 H2 16/17 H1 17/18 H2 17/18 H1 18/19 WEEKS WEEKS
27-32 1-32 27-32 1-32
SOURCE: GFK CHART-TRACK
28GAME DIGITAL PLC – 2018/19 INTERIM RESULTS
MARKET OUTLOOK
• Challenging retail climate in the UK likely to continue in the short term due to
weakening consumer confidence and economic uncertainty
• Our retail performance is impacted by the console cycle timings and we are
managing the low point of the current cycle through our cost savings
programme and investment and growth in BELONG
• Current console cycle has entered its sixth year with projected decline in low
margin console sales
• Physical software has held up well in the year to date, with Kingdom Hearts
and Division 2 anticipated to perform well in H2
• Preowned revenues will continue to decline
• The current IHS market expectations is for a new PlayStation and Xbox console to
launch in 2020
• Apex Legends launched in February 2019 and has disrupted the market
considerably with the opportunity to monetise through digital currency, high-end
accessories and licensed merchandise
• Our focus remains on our transformational strategy to move from a seller of
physical products to a provider of gaming experiences and services
SOURCE: IHS
29CLOSING REMARKS
GAME DIGITAL PLC | 2018/19 INTERIM RESULTS
30GAME DIGITAL PLC – 2018/19 INTERIM RESULTS
SUMMARY & H2 PRIORITIES
SUMMARY
• Delivered a 22% growth in adjusted EBITDA in the first half
• Material improvement in cash and liquidity during the period
• Ongoing economic uncertainty and market headwinds expected to affect performance in the
near term
CONTINUE TO IMPROVE OUR CORE MULTICHANNEL RETAIL BUSINESS
• Continuous improvement of our customer proposition through exclusive offers, range
development, market leading customer service and expertise
• Further enhancements and development of our online channel and mobile app, encouraging
increased customer engagement and spend
OPTIMISE THE ORGANISATION’S EFFICIENCY WHILE INVESTING FOR THE FUTURE
• Realise further opportunities to reduce UK estate costs whilst retaining flexibility to allow for
BELONG growth and evolving UK retail market conditions
• Continued focus on cost management across all areas of the Group
• Disciplined approach to cash management and use of capital
EXPAND THE GROUP’S LIVE AND ONLINE GAMING SERVICES
• Ongoing transformation of our business to a provider of gaming experiences and services
• Focus on identifying suitable arena locations with the right cost infrastructure to support
profitable expansion of BELONG
• Development of content at Insomnia and international Insomnia franchises
31QUESTIONS
GAME DIGITAL PLC | 2018/19 INTERIM RESULTS
32APPENDIX
GAME DIGITAL PLC | 2018/19 INTERIM RESULTS
33GAME DIGITAL PLC – 2018/19 INTERIM RESULTS
BELONG ILLUSTRATIVE FINANCIALS & CORE ELEMENTS
NUMBER OF STATIONS HOUR UTILISATION PRICE PER HOUR ANNUAL PAY TO PLAY CAPEX
MARGIN
Collaboration Agreement The annual pay to play hours Assumed average price paid Average capex per large
allows for larger arenas going per station per arena are for every hour of gameplay is Average pay to play revenue BELONG/GAME £350k
forward with c.40 stations or 1,156 £4.50 per arena is c.£200k
more Average arena capex £230k
78 hours per week, per arena x Including activities such as: and average retail capex of
Our most recent openings 52 weeks x average large Station hire £120k
have been of large arenas with arena utilisation c.28.5% Party hire
24-36 stations Arena Clash Average payback per large
BELONG/GAME c.2 - 2.5 years
CORE ELEMENTS OF BELONG PROPOSITION
1. VENUES 2. INFRASTRUCTURE 3. TOURNAMENTS 4. PLAYER SUPPORT 5. RETAIL 6. TEAM
BELONG Gaming Belong.gg Website BELONG Arena Clash BELONG Tribes PC Hardware, GAME & BELONG
Arenas Booking Platform BELONG Arena Cups Academy Accessories & Digital Specialist Resource
Insomnia Gaming Tournament Platform Team Partnerships VR & Merchandise
Festival Studio & Production Industry & Charity Food & Drink
Collaborations
34GAME DIGITAL PLC – 2018/19 INTERIM RESULTS
A WEALTH OF INSIGHT INTO OUR BELONG CUSTOMERS
1. COMPETITIVE & COMMUNITY 2. FUN WITH FRIENDS 3. PRIVATE PLAYER 4. TIME TOGETHER 5. GRATEFUL GUARDIANS
These players are motivated by These gamers use BELONG for Kids / teens who are passionate This segment is made up of
Strong interest in esports and are
having all their friends in one some private down time and to about gaming and also parents parents who do not have an
likely have experience in Amateur
place, the environment and using unwind playing video games, who go along to play alongside interest in gaming themselves
tournaments
the best quality equipment. often filling a gap in the day. their children but whose children do.
% OF TOTAL % OF TOTAL % OF TOTAL % OF TOTAL % OF TOTAL
7% 19% 42% 35% 24% 19% 19% 14% 8% 13%
% of users % of bookings % of users % of bookings % of users % of bookings % of users % of bookings % of users % of bookings
WHEN WHEN WHEN WHEN WHEN
Evenings & Afternoons during Weekdays & early Early afternoons & Early afternoons &
weekday afternoons weekends & weekdays afternoon weekends weekends
HOW LONG HOW LONG HOW LONG HOW LONG HOW LONG
Average usage: Average usage: Average usage: Average usage: Average usage:
3 hours at a time 2 hours at a time 2 hours at a time 1.5 hours at a time 1.5 hours at a time
TOP AGE RANGE ESPORTS TOP AGE RANGE ESPORTS TOP AGE RANGE ESPORTS TOP AGE RANGE ESPORTS TOP AGE RANGE ESPORTS
69% View 50% View 50% View 15% View 27% View
38% 17% 21% 47% 66%
esports esports esports esports esports
20-21 yrs. 12-15 yrs. 12-15 yrs. 30+ yrs. 30+ yrs.
competitions competitions competitions competitions competitions
35GAME DIGITAL PLC – 2018/19 INTERIM RESULTS
GLOBAL ESPORTS MARKET
IN 2019, 1.8 BILLION PEOPLE WILL BE AWARE OF ESPORTS WORLDWIDE
ESPORTS AUDIENCE GROWTH (M) ESPORTS REVENUE GROWTH ($M) 2019 ESPORTS REVENUE STREAMS | GLOBAL
GLOBAL | FOR 2017, 2018, 2019, 2022 GLOBAL | FOR 2017, 2018, 2019, 2022 INCLUDING YEAR-ON-YEAR GROWTH
645M
Esports Enthusiasts
+14.0% +22.3% +34.3%
CAGR 2017- YOY
CAGR
Occasional Viewers 2022
2017-2022
$1.1Bn
454M
+15.0%
395M YOY 297
2019 total esports
+17.8% +26.7% revenues, +26.7%
YOY YOY +41.8% YOY
YOY
335M +32.0%
201 +14.8%
YOY
1,790 456.7 YOY
173
143
+22.4% -3.0%
1,096 251.3 YOY
YOY
347
865
189.2
253 655
222
192
103.7 95.2
Sponsorship Media Rights Advertising Merchandise & Game Publisher
2017 2018 2019 2022 2017 2018 2019 2022 Tickets Fees
SOURCE: NEWZOO 2019 GLOBAL ESPORTS MARKET REPORT
36GAME DIGITAL PLC – 2018/19 INTERIM RESULTS
CONSOLE DIGITAL MARKET
SUBSCRIPTIONS
Group Console Digital Sales
£m
120.0
111.9
100.0
96.8
CURRENCY
80.0
29%
79.3
76.7
72.3
60.0
60.4 59.5
CONTENT
40.0
20.0 FULL GAME DOWNLOADS
0.0
FY14 FY15 FY16 FY17 FY18 H1 FY18 H1 FY19
SOURCE IHS: CALENDAR
37GAME DIGITAL PLC – 2018/19 INTERIM RESULTS
HARDWARE & SOFTWARE MARKET OUTLOOK – UK & SPAIN
UK MINT MARKET VALUE - HARDWARE & SOFTWARE (£M) SPAIN Mint Market Value - Hardware & Software (€m)
1,600 1,600
1,400 1,400
1,200 1,200
1,000 733 744 1,000
556
627
800 656 800
600 600
298 328
400 400 291 270
664 649 650 211
537
200 458 200
340 330
235 269 265
0 0
2016 2017 2018 2019 2020 2016 2017 2018 2019 2020
PS, XB & SWITCH HW PS, XB & SWITCH SW PS, XB & SWITCH HW PS, XB & SWITCH SW
SOURCE HIS CALENDAR
38GAME DIGITAL PLC – 2018/19 INTERIM RESULTS
GROUP STORE ESTATE
UK SPAIN GROUP
Stores at beginning of the year 276 267 543
Openings 3 3 6
Closures (5) (1) (6)
Stores at H1 2019 274 269 543
Relocations 3 2 5
Average years to first break 0.8 0.8 0.8
39GAME DIGITAL PLC – 2018/19 INTERIM RESULTS
IFRS 16 – ILLUSTRATIVE IMPACT
52 weeks ended 28 July 2018 AS IFRS 16 VAR,
• GAME will adopt IFRS 16 Leases from FY20
(Underlying) REPORTED RESTATED £M
• The transition approach is still to be determined
Revenue 782.3 782.3 0.0
• Over 540 store leases across the Group plus head office and
distribution centre leases Cost of sales (586.1) (586.1) 0.0
• We will recognise right of use assets on the balance sheet and a
corresponding obligation for the lease liabilities Gross profit 196.2 196.2 0.0
• In the statement of comprehensive income, operating lease rental Other operating costs (198.4) (195.5) 2.9
costs will be replaced by depreciation charges on the asset and a
finance cost on the liability Operating (loss) / profit (2.2) 0.7 2.9
• These high level calculation for FY18, based on general
Net finance costs (1.3) (4.7) (3.4)
assumptions applied to all leases, show a minimal impact on
profit before tax but a significant improvement in adjusted Loss before tax (3.5) (4.0) (0.5)
EBITDA. These are estimated calculations to show the potential
impact of IFRS 16 and actual restatements for FY19 may differ
from this illustration
Adjusted EBITDA 10.1 42.0 31.9
• No impact on cash flow
• One of the key judgements relates to the treatment of store leases Depreciation & amortisation (12.3) 41.3 (29.0)
on rolling breaks or where the lease has expired and we are in
Operating (loss) / profit (2.2) 0.7 2.9
negotiation with the landlord
40You can also read