Results Presentation For the full year ended 30 June 2021 - FY21 RESULTS - Bell Direct
←
→
Page content transcription
If your browser does not render page correctly, please read the page content below
Results Presentation
For the full year ended 30 June 2021

RELEASE DATE: 26 AUGUST 2021

                                       FY21 RESULTS
AGENDA

GROUP FY21 RESULTS OVERVIEW             2

GROUP OPERATING MODEL RECAP             3

1 – LOTTERY RETAILING                   4

2 – SOFTWARE-AS-A-SERVICE               6

3 – MANAGED SERVICES                    8

DETAILED FINANCIALS                     10

BALANCE SHEET                           15

CASHFLOW                                16

ACQUISITION OF STRIDE MANAGEMENT INC.   17

SUMMARY                                 18

  MAKING LOTTERIES EASIER                    FY21 RESULTS   1
GROUP RESULT OVERVIEW AND HIGHLIGHTS

       Total Transaction Volume ($m)                                                           Revenue ($m)                                                 EBITDA – underlying1 ($m)

                             +37%                                                                      +17%

                                                                                                                                                                                +13%
                                            487.0                                                                      83.3
                                                                                         71.2
               356.1                                                                                                                                                                           48.9
                                                                                                                                                                  43.2

                FY20                         FY21                                        FY20                          FY21                                       FY20                         FY21

             NPAT – underlying1 ($m)                                                 Operating cashflow ($m)                                                  Dividends declared (cps)

Underlying                                                                                                                                                                      2.8%
                42.5                         45.4
EPS1 (cps)
                                                                                                       +24%                                                       35.5                         36.5

                              +7%
                                                                                                                                                    Final         17.0                         18.5

                                                                                                                       35.1
                26.5                         28.3                                        28.2
                                                                                                                                                 Interim          18.5                         18.0

                FY20                         FY21                                        FY20                          FY21                                       FY20                         FY21

     1. Statutory FY21 EBITDA adjusted for one-off items of $1.65m mainly reflecting ~$870k of consulting and legal fees associated with the extension of the Tabcorp agreement, ~$410k of costs associated with
        the conditional acquisition of Stride and ~$190k of one-off Gatherwell acquisition expenses.

             MAKING LOTTERIES EASIER                                                                                                                                             FY21 RESULTS                      2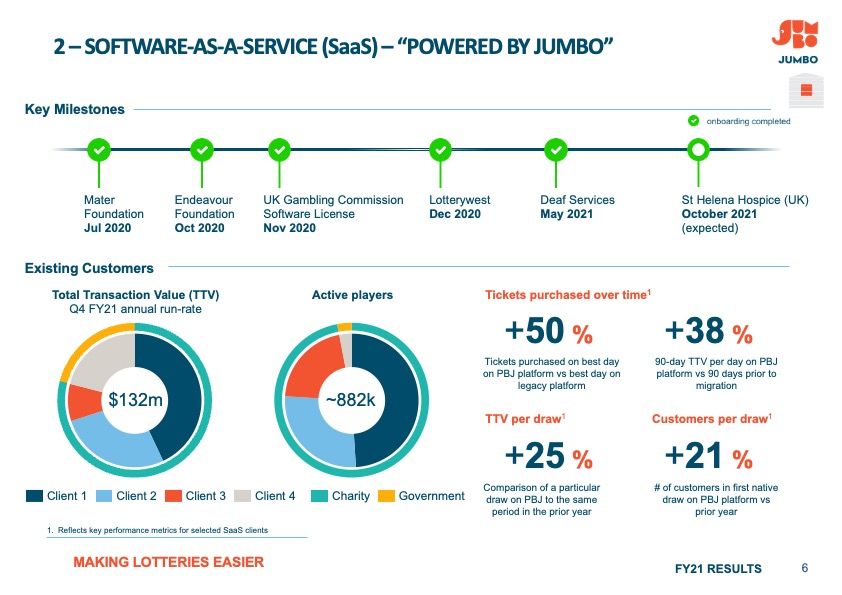
GROUP OPERATING MODEL WITH 3 DISTINCT BUSINESS SEGMENTS

                                                                                                                                                                                             Mission

                                                                                                                                                                                             Vision

                                                                                                                                                                                             Total Addressable
                                                                                                                                                                                             Market

                                                                                                                                                                                             Overview of
                                                                                                                                                                                             Business Activity

                                                                                                                                                                                             Core Capabilities

                                                                                                                                                                                             Revenue model

1. Source: Australian gambling statistics report (2018-19)
2. Total TAM of $25bn equates to TAM by region of: UK $1.6bn; US $22bn; and Canada $1.3bn: UK TAM of $1.6bn: The UK Gambling Commission reports TTV for sector of £775m (Sept 2019) applying a 5-year CAGR of +14% and/or PY rise of 8% gives a range of
   £837m to £884m in sector growth (to Sept’20). Using 6-month average GBP £1 to AUD $1.89, this leaves forecast TTV between $1.67bn and $1.58bn (Reference UKGC Annual Report18/19). 2018 US lottery sales were USD77bn. Draw games were USD28bn. With
   50% iLottery penetration forecast in next 5 years (23 US lotteries). Management has modelled 25% of draw game sales likely to be converted to digital, this coupled with a doubling of sales with the upsell of Instant Win Games, Management forecasts the iLottery market to
   be worth $14.6bn (3% growth adjustment) USD $1 to AUD $1.50 equating to a TAM of $21.9bn.
3. Total TAM of $42bn equates to TAM by region of: UK $18.8bn; Canada $13.1bn; and Australia $10.5bn: Sources: Australia $10.5 billion - ACNC (Australian Charities and Not-for-profits Commission) Report 2018; UK $18.8 billion – CAF (Charities Aid Foundation) Report
   UK Giving 2019; Canada $13.1 billion – JIN Research – independent consultant.

         MAKING LOTTERIES EASIER                                                                                                                                                                                                 FY21 RESULTS                                  3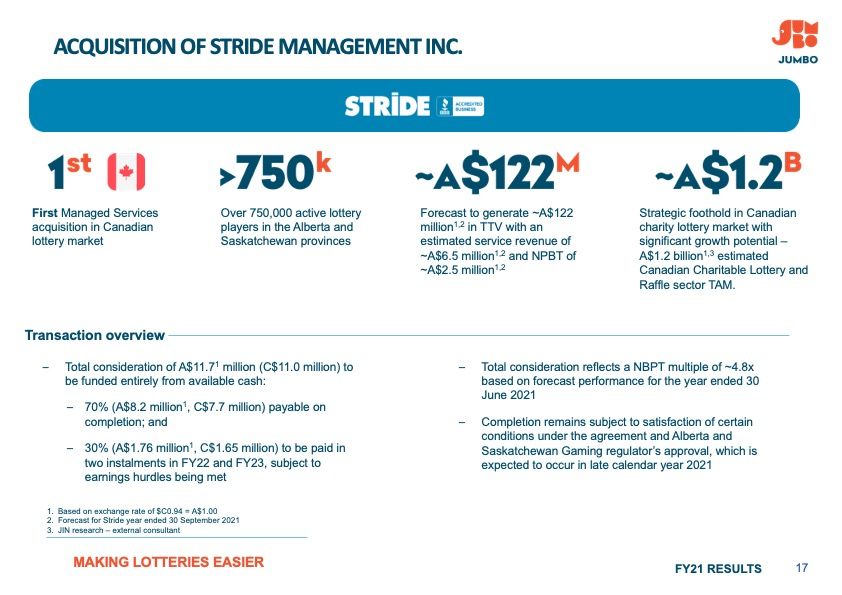
1 – LOTTERY RETAILING

Continued strong online penetration
         –    Australian digital sales of lottery tickets up to 32.8% (FY20: 28.0%)
         –    38 large jackpots (OzLotto/Powerball ≥ $15m) relative to 39 in FY20
         –    Average value per large jackpot - $31.8m (vs $40.1m in FY20)

     % of AUS lottery sales through the online channel1                                            Aggregate Division 1 Jackpots2 ($m)
                                                                                                                   49
   35%                                                                                                                        Large jackpots ≥ $15m
                                                              32.8%

   30%                                                28.0%                                                                 39         38
                                                                                                                  1,880
   25%                                        23.5%                                                      32
                                                                                             31
                                                                                                                           1,565
   20%
                              16.8%                                                                                                   1,210
   15%        13.7%
                                                                                                         910
                                                                                             750
   10%

    5%

    0%
               FY17            FY18           FY19    FY20    FY21                          FY17         FY18     FY19     FY20       FY21
                                                                          Average value
                                                                        per large jackpot   $24.2m      $28.4m    $38.4m   $40.1m    $31.8m

                                                                         Peak Division 1
   1. Source: TAH FY21 Results presentation                                     jackpot     $55m         $55m     $100m    $150m      $80m
   2. OzLotto/Powerball jackpots

         MAKING LOTTERIES EASIER                                                                                              FY21 RESULTS            4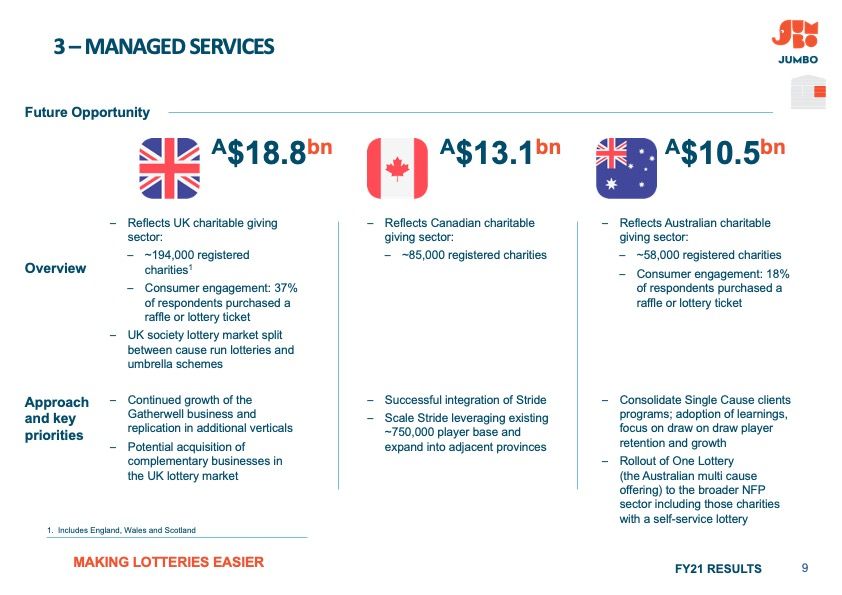
1 – LOTTERY RETAILING

Strong 2H21 sales performance
         –     19.5% Moving Annual Total (MAT) 5-year TTV CAGR to 30 June 2021
         –     Average spend per active customer up 10.4% to $423.11 (FY20: $383.12)
         –     Like-for-like active customers up 1.5% to 766,2632 (FY20: 755,2542)

       Oz Lotteries Moving Annual Total (MAT)1 TTV – by Fiscal Quarter

    MAT                                                                                                        Sales resulting from jackpots ≥ $15m        Sales resulting from jackpots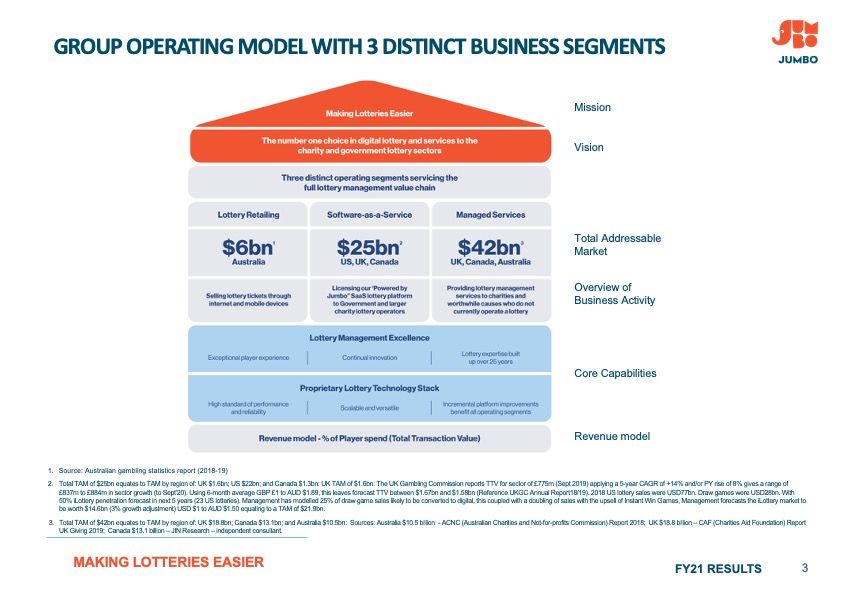
2 – SOFTWARE-AS-A-SERVICE (SaaS) – “POWERED BY JUMBO”

Key Milestones

             Mater                    Endeavour               UK Gambling Commission        Lotterywest          Deaf Services              St Helena Hospice (UK)
             Foundation               Foundation              Software License              Dec 2020             May 2021                   October 2021
             Jul 2020                 Oct 2020                Nov 2020                                                                      (expected)

Existing Customers
    Total Transaction Value (TTV)                                      Active players                 Tickets purchased over time1
       Q4 FY21 annual run-rate

                                                                                                          +50 %                         +38 %
                                                                                                     Tickets purchased on best day    90-day TTV per day on PBJ
                                                                                                     on PBJ platform vs best day on   platform vs 90 days prior to
                                                                                                             legacy platform                   migration
                   $132m                                                 ~882k
                                                                                                      TTV per draw1                   Customers per draw1

                                                                                                          +25 %                         +21 %
                                                                                                     Comparison of a particular       # of customers in first native
   Client 1           Client 2           Client 3           Client 4      Charity       Government   draw on PBJ to the same            draw on PBJ platform vs
                                                                                                      period in the prior year                  prior year
   1. Reflects key performance metrics for selected SaaS clients

          MAKING LOTTERIES EASIER                                                                                                         FY21 RESULTS                 6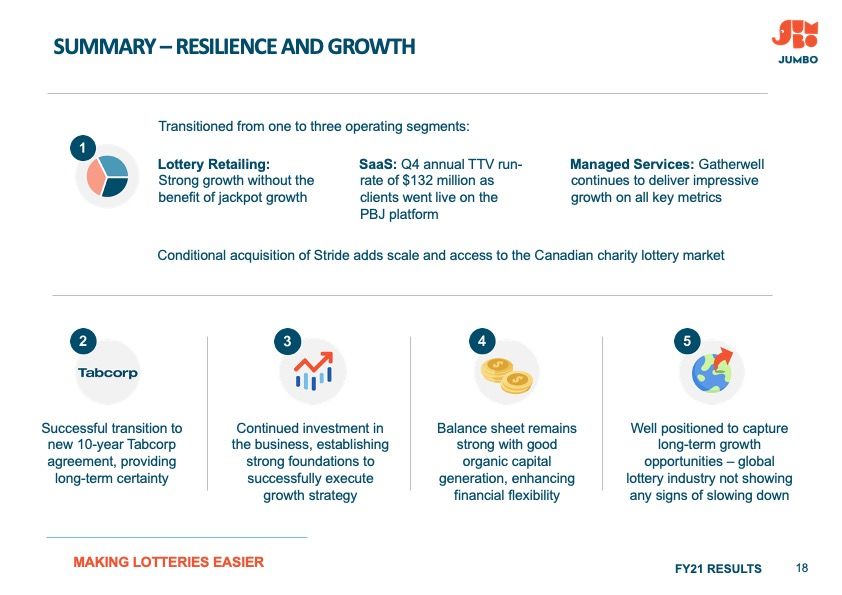
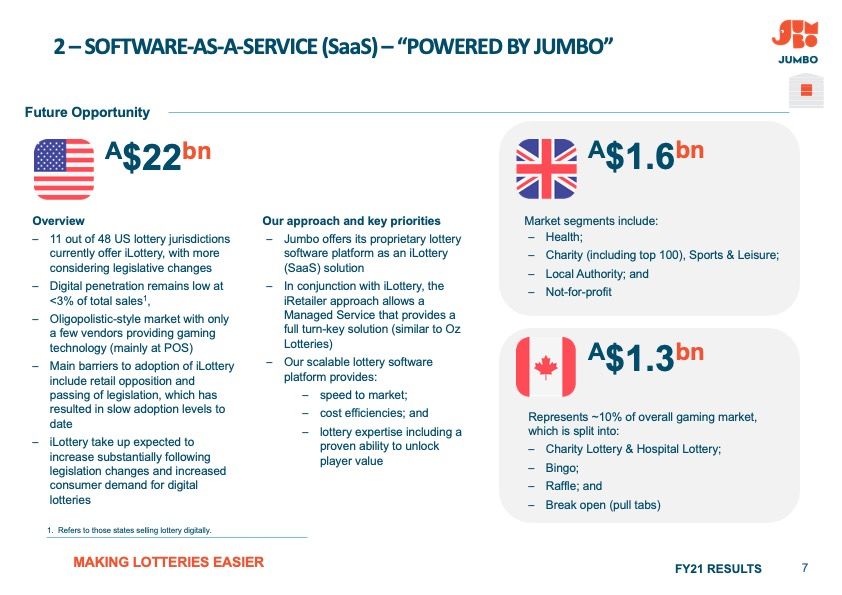
2 – SOFTWARE-AS-A-SERVICE (SaaS) – “POWERED BY JUMBO”

Future Opportunity

                     A$22bn                                                                                      A$1.6bn

 Overview                                                 Our approach and key priorities            Market segments include:
 – 11 out of 48 US lottery jurisdictions                  – Jumbo offers its proprietary lottery     – Health;
   currently offer iLottery, with more                       software platform as an iLottery        – Charity (including top 100), Sports & Leisure;
   considering legislative changes                           (SaaS) solution                         – Local Authority; and
 – Digital penetration remains low at                     – In conjunction with iLottery, the        – Not-for-profit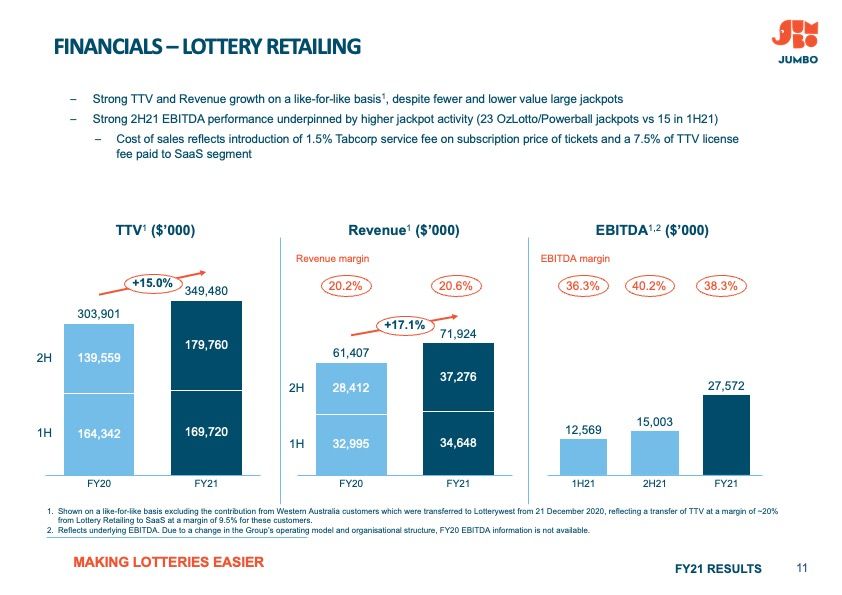
3 – MANAGED SERVICES

Key Milestones

             Gatherwell Ltd (UK)                                 Paralympics Australia                     St John Ambulance (VIC)                   Conditional acquisition of
             Nov 2019                                            May 2021                                  Jun 2021                                  Stride Management Inc.
                                                                                                                                                     August 2021

Existing Customers
    Total Transaction Value (TTV)                                         Active players                                 Gatherwell business performance
              Pro-forma1                                                   Pro-forma1

                                                                                                                              +26 %                       >90 %
                                                                                                                               3-year TTV CAGR               Recurring weekly
                                                                                                                                 (FY19 – FY21)             subscriptions over an
                                                                                                                                                           average lifetime > 18
                   ~$130m                                                    ~918k                                                                                months

                                                                                                                              >90                         ~2 k
                                                                                                                            Local Government            Schools using Your School
             Gatherwell              Stride          Jumbo Fundraising          2                                                Authorities                      Lottery
                                                                                                                            (total market ~400)            (total market ~30k)

   1. Includes Stride Management Inc. acquisition announced on 26 August 2021 and remains subject to completion conditions and regulatory approval
   2. Includes Paralympics Australia and St. John Ambulance (VIC)

          MAKING LOTTERIES EASIER                                                                                                                           FY21 RESULTS            8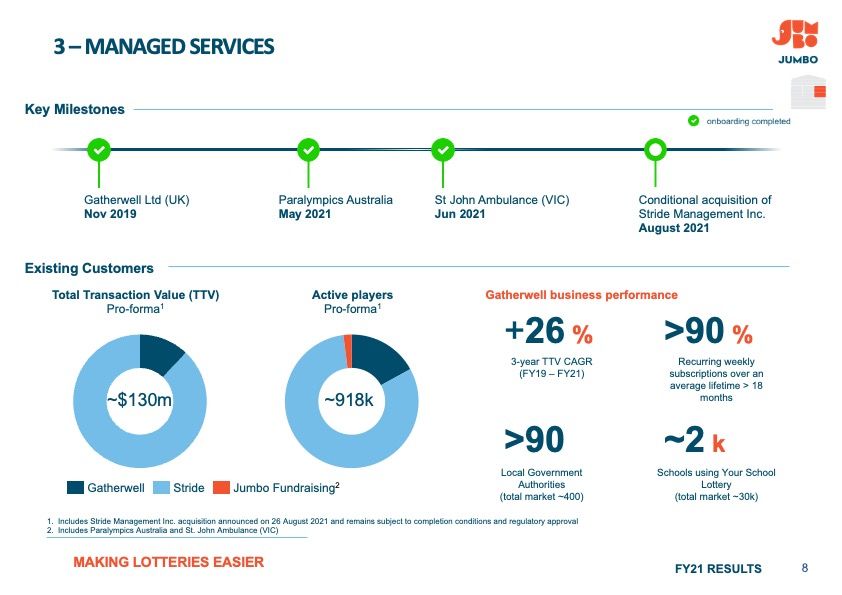
3 – MANAGED SERVICES

Future Opportunity

                                             A$18.8bn                   A$13.1bn                           A$10.5bn

                   – Reflects UK charitable giving         – Reflects Canadian charitable       – Reflects Australian charitable
                     sector:                                 giving sector:                       giving sector:
                     – ~194,000 registered                   – ~85,000 registered charities       – ~58,000 registered charities
Overview                charities1                                                                 – Consumer engagement: 18%
                     – Consumer engagement: 37%                                                      of respondents purchased a
                        of respondents purchased a                                                   raffle or lottery ticket
                        raffle or lottery ticket
                   – UK society lottery market split
                     between cause run lotteries and
                     umbrella schemes

Approach           – Continued growth of the               – Successful integration of Stride   – Consolidate Single Cause clients
and key              Gatherwell business and               – Scale Stride leveraging existing     programs; adoption of learnings,
                     replication in additional verticals     ~750,000 player base and             focus on draw on draw player
priorities
                   – Potential acquisition of                expand into adjacent provinces       retention and growth
                     complementary businesses in                                                – Rollout of One Lottery
                     the UK lottery market                                                        (the Australian multi cause
                                                                                                  offering) to the broader NFP
                                                                                                  sector including those charities
                                                                                                  with a self-service lottery
   1. Includes England, Wales and Scotland

         MAKING LOTTERIES EASIER                                                                             FY21 RESULTS            9
FINANCIALS – Underlying EBITDA
– Revenue growth underpinned by Lottery Retailing (+9.6%) and ramp up of SaaS and Managed Services (SaaS clients successfully
onboarded and first full year contribution of Gatherwell Ltd)
– Cost of sales up 56.6% mainly reflecting the introduction of a 1.5% Tabcorp service fee and growth in ticket sales
– Opex (excluding one-offs) up 15.2% reflecting a full 12-month contribution from Gatherwell and continued investment in the business
Underlying EBITDA FY21 vs FY20 ($’000)
+13.2%
(3,013)
(3,483) 44 48,922
12,151 +56.6%
43,223 +15.2% +12.9%
+17.1%
FY20 EBITDA Revenue Cost of Operating Other FY21 EBITDA
(underlying) sales expenses revenue (underlying)
1. Statutory FY21 EBITDA adjusted for one-off items including ~$870k of consulting and legal fees associated with the extension of the Tabcorp agreement, ~$410k of costs associated with the conditional
acquisition of Stride and ~$190k of one-off Gatherwell acquisition expenses.
MAKING LOTTERIES EASIER FY21 RESULTS 10FINANCIALS – LOTTERY RETAILING
– Strong TTV and Revenue growth on a like-for-like basis1, despite fewer and lower value large jackpots
– Strong 2H21 EBITDA performance underpinned by higher jackpot activity (23 OzLotto/Powerball jackpots vs 15 in 1H21)
– Cost of sales reflects introduction of 1.5% Tabcorp service fee on subscription price of tickets and a 7.5% of TTV license
fee paid to SaaS segment
TTV1 ($’000) Revenue1 ($’000) EBITDA1,2 ($’000)
Revenue margin EBITDA margin
+15.0% 20.2% 20.6% 36.3% 40.2% 38.3%
349,480
303,901
+17.1%
71,924
179,760
2H 139,559 61,407
37,276
2H 28,412 27,572
15,003
1H 164,342 169,720 12,569
1H 32,995 34,648
FY20 FY21 FY20 FY21 1H21 2H21 FY21
1. Shown on a like-for-like basis excluding the contribution from Western Australia customers which were transferred to Lotterywest from 21 December 2020, reflecting a transfer of TTV at a margin of ~20%
from Lottery Retailing to SaaS at a margin of 9.5% for these customers.
2. Reflects underlying EBITDA. Due to a change in the Group’s operating model and organisational structure, FY20 EBITDA information is not available.
MAKING LOTTERIES EASIER FY21 RESULTS 11FINANCIALS – SaaS
– Strong TTV and Revenue growth due to the on-boarding of clients
– Q4 FY21 TTV annualised run-rate ~$132m
– Revenue margin ranges from ~3% to 9.5% of TTV and includes 7.5% of Lottery Retailing TTV (internal revenue)
– External revenue up significantly to $4.9m ($1.2m in FY20)
– Stronger 2H21 EBITDA performance driven by on-boarding of Lotterywest from 21 December 2020
TTV ($’000) Revenue ($’000) EBITDA1 ($’000)
104,844 EBITDA margin
External
67.2% 69.6% 68.5%
32,060
64,910 2H
21,954
Internal 16,578 2H
10,408 11,546
39,934 1H 15,482 1H
8,703
1,162
FY20 FY21 FY20 FY21 1H21 2H21 FY21
1. Due to a change in the Group’s operating model and organisational structure, FY20 EBITDA information is not available.
MAKING LOTTERIES EASIER FY21 RESULTS 12FINANCIALS – MANAGED SERVICES
– Strong TTV, Revenue and EBITDA growth predominantly driven by Gatherwell (12 months contribution in FY21 vs 7 months
contribution in FY20)
– On a like-for-like basis, Gatherwell delivered:
– +40.0% TTV growth to £9.3m and +42.0% revenue growth to £1.8m (revenue margin of 19.8%)
– >100% EBITDA growth to £663k (EBTIDA margin of 36.0%)
– Contribution from Jumbo Fundraising in Australia was not material with Paralympics and St John Ambulance (VIC) going live
in late FY21
TTV ($’000) Revenue ($’000) EBITDA ($’000)
16,693 EBITDA margin
3,298 27.6% 27.7%
9,535
1,804 2H
7,715 914
1,520
450 2H
2H 6,757 419
7,158 1,322 1,494 1H
374 464 1H
1H 958 198 45
FY201 FY21 FY201 FY21 FY201 FY21
1. Includes contribution from Gatherwell for 7 months only.
MAKING LOTTERIES EASIER FY21 RESULTS 13OPERATING COSTS
– Underlying operating costs (excluding Gatherwell and one-off items) up 12.3%
– Step up in investment in the business planned for FY22
– Vast majority of anticipated spend aligned to growth strategy both domestically and overseas and to reduce strategy execution risk
Operating expenses FY21 vs FY20 ($’000) 1,646 28,090
1,751
+12.2%
567 24,693
735 (70)
462
998
22,583
22,001
(582)
FY20 One-offs1 FY20 Employee Consulting Technology Insurance Other FY21 Gatherwell2 One-offs1 FY21 reported
(ex- underlying costs costs costs underlying
Gatherwell) costs costs
1. FY20 one-offs include ~406k of Gatherwell acquisition costs and $176k related to the Gatherwell FV revaluation of deferred compensation. FY21 one-offs include $867k consulting and legal fees associated
with the Tabcorp agreement, $412k costs associated with the conditional acquisition of Stride and $177k related to the Gatherwell FV revaluation of deferred compensation.
2. Reflects FY21 operating expenses for Gatherwell (noting that reported FY20 operating expenses reflected approximately 7 months of Gatherwell expenses $960k).
MAKING LOTTERIES EASIER FY21 RESULTS 14BALANCE SHEET
Strong balance sheet as at 30 June 2021 reflecting: 30 June 30 June
– $15m cash payment to Tabcorp 2021 2020
– $6.4m capitalised website development costs Cash 63,139 72,259
(intangibles) (FY20: $6.4m)
– Cash balance of $53.8m1 (FY20: 61.3m1) Other current assets 5,380 3,749
Non-current assets 45,254 33,520
Capital management:
Total Assets 113,773 109,528
– Capital management strategy continuously
reviewed by Board
Current liabilities 23,248 23,574
– Dividend policy maintained at 85% of statutory
NPAT Non-current liabilities 5,199 7,035
Total liabilities 28,447 30,609
Net assets / Equity 85,326 78,919
1. Excluding customer account balances of $9.3m (FY20: $11.0m)
MAKING LOTTERIES EASIER FY21 RESULTS 15CASHFLOW
– Free cash flow of $28.6m1 (FY20: $21.5m1)
– Cash conversion ratio of 106.2%2 (FY20: 79.9%2)
Cashflow reconciliation ($’000)
8,239 (83) (6,408)
(15,000)
26,959
72,259 (21,857)
63,137
(972)
Opening Cash FY21 Depreciation & Other non- Website Tabcorp extension Dividend Other Closing Cash
balance NPAT Amortisation4 cash items3 development costs fee payment payments balance
(30 June 2020) (30 June 2021)
1. Operating cashflow less capex (excluding Tabcorp extension fee of $15m and Gatherwell payment of $8.8m).
2. Free cash flow / statutory NPAT
3. Includes other non-cashflow items and working capital changes
4. Reflects amortisation of the $15m capitalised Tabcorp extension fee payment over its 10-year term and ongoing platform development costs amortised over a 5-year period.
MAKING LOTTERIES EASIER FY21 RESULTS 16ACQUISITION OF STRIDE MANAGEMENT INC.
First Managed Services Over 750,000 active lottery Forecast to generate ~A$122 Strategic foothold in Canadian
acquisition in Canadian players in the Alberta and million1,2 in TTV with an charity lottery market with
lottery market Saskatchewan provinces estimated service revenue of significant growth potential –
~A$6.5 million1,2 and NPBT of A$1.2 billion1,3 estimated
~A$2.5 million1,2 Canadian Charitable Lottery and
Raffle sector TAM.
Transaction overview
– Total consideration of A$11.71 million (C$11.0 million) to – Total consideration reflects a NBPT multiple of ~4.8x
be funded entirely from available cash: based on forecast performance for the year ended 30
June 2021
– 70% (A$8.2 million1, C$7.7 million) payable on
completion; and – Completion remains subject to satisfaction of certain
conditions under the agreement and Alberta and
– 30% (A$1.76 million1, C$1.65 million) to be paid in Saskatchewan Gaming regulator’s approval, which is
two instalments in FY22 and FY23, subject to expected to occur in late calendar year 2021
earnings hurdles being met
1. Based on exchange rate of $C0.94 = A$1.00
2. Forecast for Stride year ended 30 September 2021
3. JIN research – external consultant
MAKING LOTTERIES EASIER FY21 RESULTS 17SUMMARY – RESILIENCE AND GROWTH
Transitioned from one to three operating segments:
Lottery Retailing: SaaS: Q4 annual TTV run- Managed Services: Gatherwell
Strong growth without the rate of $132 million as continues to deliver impressive
benefit of jackpot growth clients went live on the growth on all key metrics
PBJ platform
Conditional acquisition of Stride adds scale and access to the Canadian charity lottery market
Successful transition to Continued investment in Balance sheet remains Well positioned to capture
new 10-year Tabcorp the business, establishing strong with good long-term growth
agreement, providing strong foundations to organic capital opportunities – global
long-term certainty successfully execute generation, enhancing lottery industry not showing
growth strategy financial flexibility any signs of slowing down
MAKING LOTTERIES EASIER FY21 RESULTS 18DISCLAIMER
This presentation contains summary information about the current All dollar values are in Australian dollars (A$) unless otherwise
activities of Jumbo Interactive Limited (Jumbo). It should be read in stated. Neither Jumbo nor any other person warrants or guarantees
conjunction with Jumbo’s other periodic and continuous disclosure the future performance of Jumbo shares or any return on any
announcements lodged with the Australian Securities Exchange investment made in Jumbo shares.
(ASX), including the Full Year Report and Accounts released 26 This presentation may contain certain ‘forward- looking
August 2021 is available at www.asx.com.au. statements’. Indications of, and guidance on, financial position and
No member of Jumbo gives any warranties in relation to the performance are also forward-looking statements. Any forecasts or
statements or information contained in this presentation. The other forward looking statements contained in this presentation are
information contained in this presentation is of a general nature subject to known and unknown risks and uncertainties and may
and has been prepared by Jumbo in good faith and with due care, involve significant elements of subjective judgement and
however no representation or warranty, express or implied, is assumptions as to future events which may or may not be correct.
provided in relation to the accuracy or completeness of the Such forward- looking statements are not guarantees of future
information. performance and involve known and unknown risks, uncertainties
This presentation is for information purposes only and is not a and other factors, many of which are beyond the control of Jumbo,
prospectus, product disclosure statement or other disclosure or that may cause actual results to differ materially from those
offering document under Australian or any other law. This expressed or implied in such statements.
presentation does not constitute an offer, invitation or There can be no assurance that actual outcomes will not differ
recommendation to subscribe for or purchase any security and materially from these statements. You are cautioned not to place
neither this presentation nor anything contained in it shall form the undue reliance on forward-looking statements. Except as required
basis of any contract or commitment. by law or regulation (including the ASX Listing Rules), Jumbo
This presentation is not a recommendation to acquire Jumbo shares. undertakes no obligation to update these forward-looking
The information provided in this presentation is not financial product statements.
advice and has been prepared without taking into account any Past performance information given in this presentation is given for
recipient’s investment objectives, financial circumstances or illustrative purposes only and should not be relied upon as
particular needs, and should not be considered to be comprehensive (and is not) an indication of future performance.
or to comprise all the information which recipients may require in
order to make an investment decision regarding Jumbo shares.
MAKING LOTTERIES EASIER FY21 RESULTS 19QUESTIONS ? MAKING LOTTERIES EASIER FY21 RESULTS 20
0
Good morning everyone.

Today, as usual, I am joined by our CFO, David Todd, to present our full year results.

I’ll provide an overview of the result and tell you about the opportunities we see ahead, while
Dave will provide a more detailed run through of the numbers.

I will then speak briefly about the conditional acquisition of Stride, which we announced this
morning, before wrapping up and moving to Q&A.

                                                                                                  1
Turning to the Group result, and we reported strong double-digit growth across TTV, revenue
and underlying EBITDA.
Despite fewer and lower value jackpots and the absence of a greater than $100 million
jackpot, Lottery Retailing continues to deliver good growth, with the increase in TTV
predominantly driven by our SaaS segment, as clients went live on the PBJ platform.
Revenue was up 17% and was balanced between Lottery Retailing and the emerging SaaS
and Managed Services segments. At a headline level Lottery Retailing revenue was up 9.6%,
although after accounting for the transition of our WA customers to Lotterywest’s white-
labelled platform in December 2020, underlying revenue growth was 17.1%. Let me remind
you, this included the transfer of around $30 million of TTV at a revenue margin of around
20% to our SaaS segment at a margin of 9.5%.
Underlying EBITDA was pleasingly up 13%, despite the introduction of a 1.5% service fee
payable to Tabcorp on the subscription price of tickets, and continued investment in the
business.
The lower underlying NPAT growth of 7% mainly reflects the impact of a higher amortisation
charge following the capitalisation of the Tabcorp extension fee, and lower interest revenue.
Capital generation and cash conversion remain strong, with operating cashflow up 24% and
the Board has declared a final fully franked ordinary dividend of 18.5 cents per share.
COVID-19 has had a net positive impact on the FY21 results with mobility restrictions as a
result of the government mandated lockdowns supporting the purchase of lottery tickets
digitally.
2This slide builds on the operating model slide I first unveiled at our interim results in February.
Today I want to highlight:
• We have moved from one to three operating segments, all underpinned by our proprietary
technology platform and over two decades of lottery management expertise
• The significant opportunity for each of our segments, particularly for our emerging SaaS
and Managed Services segments
• Our SaaS business is focused on licensing the Powered By Jumbo platform to government
and charity lottery operators while our Managed Services segment assists charities and
worthwhile causes that not yet operate a lottery.
I also want to flag the conditional acquisition of Stride which we announced today, which adds
scale to our Managed Services segment and gives us a foothold in the Canadian charity
lottery market
Overall, it has been an important year for Jumbo, with the successful transition to the new
Tabcorp agreement and the implementation of our new operating model and organisational
structure. We aim to build on this in FY22, as we invest in the business to ensure we have the
right capabilities to capitalise on the growth runway ahead.
3Turning to Australia, and our Lottery retailing segment, I have summarised the key trends
impacting the segment:
• On-line sales of lottery tickets increased by 4.8 ppts to 32.8%. I also note that plans are
underway to refresh the OzLotto game and the changes are likely to be implemented in
late FY22.
• While the jackpot sequence improved significantly in the second half, with 23 Powerball /
OzLotto jackpots greater than or equal to $15 million compared to just 15 in the first half,
the total number of jackpots for the year was still slightly down on last year.
• Additionally, the average value of large jackpots was down 21% with no jackpots above
$100 million.
4This chart of Oz Lotteries sales performance over several years helps explain both the
resilience and the growth of our Lottery Retailing business. You can see the steady growth
achieved from small jackpots, and the boost we get from large jackpots.
To reinforce this point, just two weeks ago we sold the winning $80 million Powerball ticket to
a player in Victoria. We estimate that total national sales for that lottery alone were up an
impressive 16% compared to the previous $80 million in April, but we know that our own sales
for that lottery were up 32%. Additionally, 3 of the 13 division two winners were Jumbo
players.
What this demonstrates yet again is that we typically grow TTV, and therefore market share,
far more emphatically during periods of large jackpots, and so it is no surprise that our share
tends to subside in periods of low jackpots, as was the case in the first half, and rise during
periods of high jackpots.
Overall, our MAT TTV from Lotteries Retailing has grown at a very healthy average CAGR of
20% over the last five years.
5Moving now to our SaaS segment, where we licence our PBJ platform to customers nationally
(including our own Oz Lotteries). FY21 was a pivotal year as all four external clients in
Australia went live on the PBJ platform.
While it is still relatively early days, I have included some high-level metrics on the bottom
right hand side, outlining some of the benefits our clients have observed on the PBJ platform.
I note that Lotterywest went live on the platform on 21 December 2020 and we have already
seen some encouraging performance improvements.
We now have around 880k active players in Australia and we exited the year with an annual
run-rate TTV of $132 million, based on Q4 results.
We are working closely with our first international client, St. Helena Hospice, to launch our
market leading lottery platform in the the first half of FY22 in the UK.
6I have added this slide to highlight the global opportunity that exists for our SaaS business.
The US government lottery sector represents the largest opportunity.
The pace of digital transformation in lotteries has been slower than in the on-line wagering
space, which is not really surprising.
However, as legislative change continues and consumer demand for lotteries gains traction –
particularly as lotteries seek to ensure their products remain relevant for the next generation
of players who are more digitally savvy, carry less cash and visit retail outlets less frequently -
we see a significant medium term opportunity for Jumbo to be the preferred partner for small
to medium sized state government lottery programs.
We believe we have the technology and the lottery management expertise to deliver market
leading growth.
In the UK and Canada, we have prioritised the charity lottery sectors and continue to evaluate
opportunities in these markets.
7Turning now to Managed Services where we provide lottery management services to charities
and worthwhile causes that do not yet have a lottery.
Our UK business, Gatherwell continues to go from strength to strength, with TTV increasing at
26% per annum over the last three years. Gatherwell continues to expand its reach with local
government authorities and schools, now supporting over 10,000 good causes.
We have leveraged Gatherwell’s expertise and capabilities in launching Managed Services
here in Australia with our foundation clients of Paralympics Australia and St John Ambulance
(VIC) which went live in May and June respectively.
Today, we also announced the conditional acquisition of Stride and the charts on bottom left
of the slide provide a pro-forma view of TTV and active customers. As you can see, Stride
adds significantly more scale to this segment.
8This slide provides an overview of the Managed Services opportunity in the charitable giving
sectors across the UK, Canada and Australia, as well as our key priorities in these markets.
Importantly, the TAM for Managed Services is much larger than SaaS as a lot more charities
need managed services in addition to a software platform. Inevitably there will be some
overlap between our SaaS and Managed Services opportunity and this will largely depend on
the clients’ needs.
COVID-19 however has certainly amplified the trend towards digital channels, with lotteries
seen as an important source of sustainable fundraising revenue.
I’m optimistic that our Managed Services segment can capture more than its fair share of this
substantial market over the medium to long term.
With that, I will now hand over to Dave to run through the financials.
9Thanks Mike and good morning everyone.
Statutory EBITDA was up 10.9% while underlying EBITDA rose 13.2%. Underlying EBITDA
removes the impact of one-off items which in FY21 primarily relate to consulting and legal
costs associated with the extension of the Tabcorp agreement and costs related to the
acquisition of Stride.
Statutory revenue was up 17.1% with all segments growing strongly, noting that FY21 reflects
the first full year contribution from Gatherwell while FY20 only had approximately seven
months.
The increase in cost of sales was driven largely by the introduction of the Tabcorp 1.5%
service fee on the subscription price of tickets, as well as growth in ticket sales.
Operating expenses, excluding one-offs, increased at a lower rate than revenue, driven by
increased investment in the business to drive growth and building capability including
enhanced corporate governance and risk management.
10Starting with Lottery Retailing where we saw underlying TTV and revenue growth of 15.0%
and 17.1% respectively.
On this slide, I have adjusted the numbers to reflect the transition of our WA customers to
Lotterywest, which from 21 December 2020 is reported in our SaaS segment. This was
effectively a transfer of TTV at a margin of approximately 20% to a SaaS margin of 9.5%, with
an estimated $2.8 million headwind to the FY21 result.
We have not disclosed comparative EBITDA figures for all three segments due to the change
in operating model and organisational structure earlier this year, but I have broken out the
performance by halves.
The stronger 2H21 performance primarily reflects the improved jackpot cycle with 23
Powerball and OzLotto jackpots greater than $15 million, compared to only 15 in the first half
of FY21.
11Turning now to SaaS, where FY21 has seen a significant uplift in TTV and revenue as our
four SaaS clients have been successfully migrated to the PBJ platform.
While Mater Foundation has been on the PBJ platform for the full 12 month period, Endeavour
and Deaf Services only fully transitioned in October 2020 and May 2021 respectively, while
Lotterywest went live on 21 December 2020. Based on Q4, the annualised TTV run-rate was
$132.2 million.
Revenue of $32.1 million comprises internal revenue of $27.1 million from Lottery Retailing
and revenue from external customers of $4.9 million. This intersegment revenue is equivalent
to 7.5% of Lottery Retailing TTV and reflects a licence fee for use and customisation of the
PBJ platform including ongoing system improvements, platform feature developments and
innovation and use of data analytics software. The external revenue margin was 4.7%.
As I mentioned before, there is no comparative data following changes to the operating model
and organisational structure. FY21 EBITDA was $22.0 million, reflecting an EBITDA/revenue
margin of 68.5%.
12Moving to Managed Services which principally reflects the performance of our UK business,
Gatherwell, noting that our Australian operations, Jumbo Fundraising, was only launched in
February this year and therefore its contribution to FY21 has not been material.
The headline results shown in the charts are distorted due to the timing of the Gatherwell
acquisition, where approximately seven months of trading was reported in FY20 with a full 12
months recorded for FY21.
On a like-for-like and constant currency basis, Gatherwell delivered a very strong
performance with TTV and revenue up 40.0% and 42.0% respectively, with EBITDA more
than doubling to £663,000 at a margin of 36.0% (FY20: 23.0%).
13At a headline level, operating costs were up 19.3%. After removing one-off items including the
consulting fees related to the Tabcorp agreement extension and due diligence costs
associated with the acquisition of Stride, operating costs increased by 15.2%.
In the chart on the slide, I have shown the underlying operating cost growth, removing the
impact of one-off items and adjusting for the timing of the Gatherwell acquisition, which only
contributed approximately 7 months in FY20 and the full 12 months in FY21. You can see,
that underlying cost growth was 12.2%.
The new Tabcorp agreement provides Jumbo with a high degree of certainty over the longer
term and we are now one year into our 10-year agreement. The Board and management team
are committed to strengthening our capabilities, from both a platform and people perspective,
to ensure we maximise the growth opportunities that lie ahead.
That said, we anticipate a step up in underlying operating expenses in FY22, particularly in
the areas of marketing, people and technology, as we build the foundations to successfully
execute our growth strategy over the medium term.
The continued growth and cash generative nature of our Lottery Retailing business provides
us with a unique opportunity to simultaneously grow and invest for the future.
14Turning to the balance sheet, and we continue to maintain a strong position underpinned by
the strong organic cash generation of the business.
The Board has declared a final fully franked ordinary dividend of 18.5 cents per share, taking
the total dividend for the year to 36.5 cents per share, reflecting an 85% payout ratio of
statutory NPAT. We continue to maintain a strong cash position, after accounting for payment
of the final dividend due to be paid to shareholders on 24 September 2021.
As flagged at our interim results in February, the Board has now reviewed our broader capital
management strategy including dividend policy. The review considered our three-year
business plan, the current strength of our balance sheet and a review of peer capital
management frameworks as well as the desire to provide an appropriate dividend to our
shareholders. On balance, the Board has resolved to maintain the existing dividend payout
ratio at 85% of statutory NPAT, however I note that the overall capital management
framework will continue to be reviewed in the context of future growth opportunities for the
Group.
15And finally, turning to the cashflow where the cash generative profile of the business is clearly
evident, with a free cash flow of $28.6 million and a greater than 100% cash conversion.
I will now hand back to Mike.
16Thanks Dave and thank-you for highlighting our commitment to continue to invest in our
technology and people, which will be critical to executing on our growth strategy, both here
and overseas.
One example of the expansion opportunities emerging for the group is highlighted by today’s
announcement of our acquisition of Stride, which marks our entry into the Canadian lottery
market. While the acquisition is only expected to complete later this year and remains subject
to regulatory approval I would like to highlight:
• Stride adds over $122m to group TTV.
• It brings in over 750k new customers to the Group, from a combined population of
around 5.6m people in Alberta and Saskatchewan. As it only operates in two provinces,
there is a significant opportunity to expand outside these provinces.
• The acquisition will be funded entirely from available cash reserves and given the
earnings profile of the business, it will be EPS accretive from day 1 post completion.
• I’m also very pleased that Stride’s founder, Dean Faithfull, and his management team,
intend to stay on with the business and I welcome them to the Jumbo family.
17That brings me to the conclusion of the formal part of the presentation, where I just want to
summarise the key messages from today’s presentation.
The first is we have successfully implemented our new operating model and moved from one
to three operating segments.
Lottery Retailing continues to perform very well and enters FY22 with strong momentum given
the recent Powerball jackpot sequence. All our domestic SaaS clients have successfully
transitioned onto the PBJ platform and our foundation client in the UK, St Helena Hospice, is
expected to go live in 1H22.
Gatherwell continues to go from strength to strength and we are very pleased with how we
have integrated this business and leveraged its expertise in setting up Jumbo Fundraising in
Australia.
The transition to the new Tabcorp agreement has gone well and importantly provides long-
term certainty for Lottery Retailing as well as an opportunity for us to build our emerging SaaS
and Managed Services segments globally.
We continue to invest in the business to ensure we have the right capabilities to minimise the
execution risk of our strategy, particularly as we seek to enter new markets outside Australia.
Our balance sheet remains a key strength for us and finally, we are well positioned to benefit
from the structural tailwinds supporting the lottery industry globally and the ongoing shift to
digital.
On that note, we are now happy to take your questions.
1819
20
You can also read