The fiber and convergence leader in the North of Spain - Euskaltel
←
→
Page content transcription
If your browser does not render page correctly, please read the page content below

The fiber and convergence leader
       in the North of Spain

                              June 2018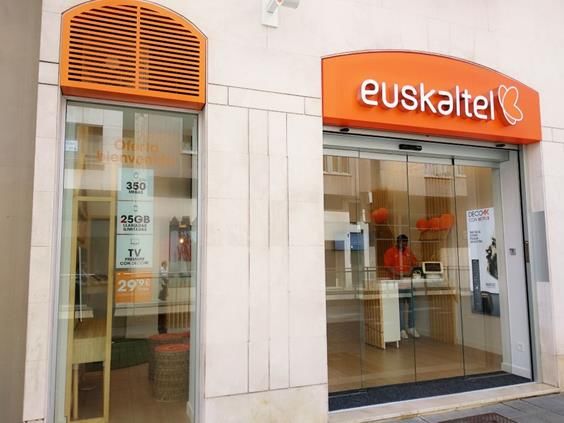
Disclaimer
This presentation (the "Presentation") has been prepared and is issued by, and is the sole responsibility of Euskaltel, S.A. ("Euskaltel" or "the Company"). For the purposes hereof, the Presentation shall
mean and include the slides that follow, any prospective oral presentations of such slides by the Company, as well as any question-and-answer session that may follow that oral presentation and any
materials distributed at, or in connection with, any of the above.
The information contained in the Presentation has not been independently verified and some of the information is in summary form. No representation or warranty, express or implied, is made by the
Euskaltel Group (including Euskaltel, S.A., R Cable y Telecomunicaciones Galicia, S.A.U. and Parselaya, S.L.U. and its subsidiaries (Telecable Capital Holding, S.A.U. and Telecable de Asturias
S.A.U.)), nor by their directors, officers, employees, representatives or agents as to, and no reliance should be placed on, the fairness, accuracy, completeness or correctness of the information or
opinions expressed herein. None of Euskaltel Group, nor their respective directors, officers, employees, representatives or agents shall have any liability whatsoever (in negligence or otherwise) for any
direct or consequential loss, damages, costs or prejudices whatsoever arising from the use of the Presentation or its contents or otherwise arising in connection with the Presentation, save with respect
to any liability for fraud, and expressly disclaim any and all liability whether direct or indirect, express or implied, contractual, tortious, statutory or otherwise, in connection with the accuracy or
completeness of the information or for any of the opinions contained herein or for any errors, omissions or misstatements contained in the Presentation.
Euskaltel cautions that this Presentation contains forward looking statements with respect to the business, financial condition, results of operations, strategy, plans and objectives of the Euskaltel Group.
The words "believe", " expect", " anticipate", "intends", " estimate", "forecast", "project", "will", "may", "should" and similar expressions identify forward-looking statements. Other forward-looking
statements can be identified from the context in which they are made. While these forward-looking statements represent our judgment and future expectations concerning the development of our
business, a certain number of risks, uncertainties and other important factors, including those published in our past and future filings and reports, including those with the Spanish Securities and
Exchange Commission (“CNMV”) and available to the public both in Euskaltel’s website (www.euskaltel.com) and in the CNMV’s website (www.cnmv.es), as well as other risk factors currently unknown
or not foreseeable, which may be beyond Euskaltel’s control, could adversely affect our business and financial performance and cause actual developments and results to differ materially from those
implied in the forward-looking statements. There can be no assurance that forward-looking statements will prove to be accurate, as actual results and future events could differ materially from those
anticipated in such statements. Accordingly, readers should not place undue reliance on forward-looking statements due to the inherent uncertainty therein.
The information contained in the Presentation, including but not limited to forward-looking statements, is provided as of the date hereof and is not intended to give any assurances as to future results. No
person is under any obligation to update, complete, revise or keep current the information contained in the Presentation, whether as a result of new information, future events or results or otherwise. The
information contained in the Presentation may be subject to change without notice and must not be relied upon for any purpose.
Market and competitive position data in the Presentation have generally been obtained from industry publications and surveys or studies conducted by third-party sources. There are limitations with
respect to the availability, accuracy, completeness and comparability of such data. Euskaltel has not independently verified such data and can provide no assurance of its accuracy or completeness.
Certain statements in the Presentation regarding the market and competitive position data are based on the internal analyses of Euskaltel, which involve certain assumptions and estimates. These
internal analyses have not been verified by any independent source and there can be no assurance that the assumptions or estimates are accurate. Accordingly, no undue reliance should be placed on
any of the industry, market or Euskaltel’s competitive position data contained in the Presentation.
You may wish to seek independent and professional advice and conduct your own independent investigation and analysis of the information contained in this Presentation and of the business,
operations, financial condition, prospects, status and affairs of the Euskaltel Group. Euskaltel is not nor can it be held responsible for the use, valuations, opinions, expectations or decisions which might
be adopted by third parties following the publication of this Presentation.
No one should purchase or subscribe for any securities in the Company on the basis of this Presentation. This Presentation does not constitute or form part of, and should not be construed as, (i) an
offer, solicitation or invitation to subscribe for, sell or issue, underwrite or otherwise acquire any securities, nor shall it, or the fact of its communication, form the basis of, or be relied upon in connection
with, or act as any inducement to enter into any contract or commitment whatsoever with respect to any securities; or (ii) any form of financial opinion, recommendation or investment advice with respect
to any securities.
The distribution of this Presentation in certain jurisdictions may be restricted by law. Recipients of this Presentation should inform themselves about and observe such restrictions. Euskaltel disclaims any
liability for the distribution of this Presentation by any of its recipients.
By receiving or accessing to this Presentation you accept and agree to be bound by the foregoing terms, conditions and restrictions.

                                                                                                                                                                                                                        2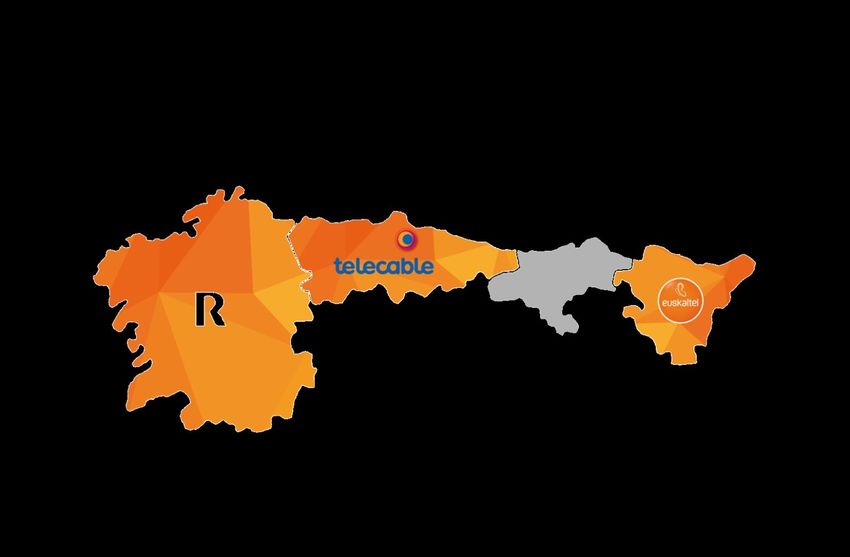
The leading platform in the north of Spain

                                          Geographical complementarity                                                                    Key metrics

                                                    Subs1: 153k                                                   Addressable         Homes
     Subs1: 284k                                                                                                                                                      Wi-Fi spots
                                                  Population2: 1.0m                      Subs1:350k                  market           passed         Subscribers
   Population2: 2.7m
                                                                                      Population2: 2.2m           (inhabitants)        (000’)
                                                                                                                    ~ 6m                               ~ 790k          > 400k
                                                                                                                                     ~ 2,200
                                                    39%                65%
                                                               68%
                                                                                      39%
                                                                                             42%
                                                                                                    79%                  1               Market position
                                                                                                                                        (in respective regions)
                   31%       42%          83%              Total group: c.790k subs

                                                       Mobile penetration    Broadband mkt         Pay TV mkt                         Key achievements
                                                       (2017)                share (2015)          share (2015)

                                                                                                                                             From a single
                                                                                                                                           region company
                   Consistently leading market position in our regions                                                                     to a multi-region
                                                                                                                                                platform

                                                                                                                       Shareholder                                Value-accretive
                                                                                                                      remuneration                                M&A delivered
       2010                           2                            1           1                   43                    initiated

                                                                                                                                                             Sector-top
       Now                            2                            1           1                   34                             Financial
                                                                                                                                  discipline
                                                                                                                                                            operating and
                                                                                                                                                          financial metrics
                                                                                                                                  preserved
Source INE, CNMC, Company internal estimates                                                                                                                 maintained
Notes:
1.   Total subscribers (Residential + business) figures as of Dec-17
2.   2016 data from INE                                                                                                                                                             3
3.   3rd operator in the Basque country
4.   4th operator in Asturias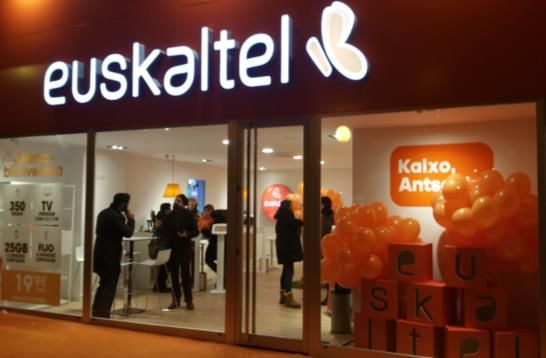
Strategic milestones

           Initial Public Offering                        Acquisition of R Cable                            Platform creation
                    Jul-15                                       Nov-15                                      Dec-15 / Today

           Successful IPO of the first Spanish         Transformational transaction in Euskaltel            Acquisition of the remaining
  1                                                1                                                1
               cable company1 in history                               history                          independent regional cable business

                                                          Fully consistent with consolidation
                                                   2
                                                                       strategy

                                                         Highly value accretive with cash flow
         Support of highly reputed institutional   3                                                    Largest independent convergent cable
  2                                                                impact over 20%                  2
                       investors                                                                                   platform in Spain

                                                       Synergies delivered on time and revised
                                                   4
                                                                      upwards

                                                       Support from institutional equity and debt           Governance support with the
          Strong after market performance of       5     investors (€255m equity raising and             incorporation of Zegona’s and Jon
  3                    the stock                                                                    3
                                                                 €900m debt raising)                       James’ international expertise

Note                                                                                                                                           4
1.   On a Spanish stock exchange
We have built a 2x larger business since IPO…

                  Subscribers (‘000)                                                                  EBITDA1 (€m)                         OpCF2 (€m)

Mobile penetration (%)                                                           EBITDA margin (%)                          As % of revenue (%)

              53%                              77%                                              49%                  48%            35%                 31%

                               >2x                                                                          >2x                               ~2x

                                                                                                                     341                                216
                                                777

                                                                                                                                     113
              348                                                                              156

              IPO                               2017                                           IPO                   2017            IPO                2017

Notes
1.   EBITDA adjusted for management fees, M&A expenses, transaction bonuses and other extraordinary items
2.   Throughout the presentation, OpCF defined as (EBITDA – capex)
                                                                                                                                                               5
Strong operational and financial profile while doubling size
                                                                              IPO
  Statutory figures                                                                    FY2015   FY2016   FY2017
                                                                            (Mar-15)

                                                          3P / 4P (%)        57.6%     63.3%    65.8%    68.0%

          KPIs                                          Mobility (%)1        53.3%     71.7%    77.2%    77.1%

                                                          ARPU (€)2          €55.7      €56.0    €58.4    €60.0

                                                       EBITDA (€m)           €156m     €167m    €281m    €307m

                                                 EBITDA Margin (%)           48.7%     47.8%    49.0%    49.3%

                                                         OpCF (€m)           €113m     €114m    €185m    €198m

    Financial
                                                   OpCF margin (%)           35.1%     32.6%    32.2%    31.8%
   statements
                                                   Net income3 (€m)          €37m       €7m      €62m     €50m

                                                            EPS3 (€)         €0.29      €0.13    €0.72    €0.28

                                               Eq. CF per share3 (€)         €0.694     €0.23    €0.87    €0.56

Notes:
1.   Mobile penetration as a percentage of fixed-line customers
2.   For the residential segment
3.   Statutory figures including extraordinary and non-recurrent elements
4.   EqCF per share at IPO calculated as of 31-Dec-2014
                                                                                                                  6
The regional integrated telecommunication champion
                        1                                        2
                               Undisputed leading fiber and          Supportive macro dynamics across
                            convergence operator in the Basque         regional footprint with broader
                               Country, Galicia and Asturias         improvement in telecom dynamics

         8                                                                           3
                  Strong and experienced                                                 Benefitting from strong emotional
               management team supported by                                              attachment and high-quality client
                 anchor shareholder base                                                                base

         7                                                                           4
                                                                                              State-of-the-art fiber
             Best-in-class margins and cash flow
                                                                                         network fully invested, providing
                generation underpinned by a
                   prudent financial policy                                                 best-in-class service and
                                                                                            acting as an entry barrier

                        6                                        5
                                                                        Growth momentum underway
                            Growth through expansion to nearby
                                                                     focused on the lifetime value of the
                                        territories
                                                                                   client

                                                                                                                              7
1            Undisputed leading operator

                             Basque Country                                                                           Galicia                        Asturias

                                Market Share                                                                       Market Share(1)                   Market Share

                 2                    1                1                   2                                  1       1            1     1     2     1          1         4
Residential

                                                                                                                                                            68%
                                                     46%
                 36%             38%                                                                                              39%
                                                                         28%                                         30%                            39%
                                                                                                           29%                                31%
                                                                                                                                        20%
                                                                                                                                                                      16%

                                Market Share                                                                       Market Share(1)                  Market Share(1)

                        2                                       2                                                          2                   2    2       1         4
                                                                                                                                                            56%
Business

                          35%                                33%                                                           35%
                                                                                                                                              23%   27%

                                                                                                                                                                      12%

                                (1)
                         SoHo                    SMEs & Large Accounts                                                    Fixed

                       Source: Company estimates and CNMC data. Market share in their respective footprints.
                       (1)   Ranking based on market share over cabled areas
                       (2)   2016 data for all segments and region, except B2B Telecable which accounts for 2015
                                                                                                                                                                              8
1     …on the back of a fully convergent offering

Residential Segment

                Successful migration towards 3P/4P…                  … driving an increase in value per customer

RGUs                                                           ARPU (€) (proforma for Telecable acquisition)
        3.04x            3.29x              3.43x      3.52x
/Sub

                                                                                                                  60.7
                                                      68%
                         65%               67%                                                             59.4
       59%

                                           28%        26%
                        31%                                                              56.9
       36%
                                                                       55.3

                                           39%        42%
                        34%
       24%

       2014             2015               2016       2017             2014              2015              2016   2017
                                 4P   3P

                                                                                                                         9
2   Supportive macro dynamics
      Price war bringing down ARPUs                                     … leading to a rapid shift                               …driving market consolidation,                                         …and resulting in tariff
             below EU average                                           towards convergence …                                    content investments and capex                                       inflation and sector recovery

      Spanish Telecom market(1) historical revenue growth (%YoY)

                                                                                                                                                                                                                 High end 4P bundles pricing
                                                                                                                                                                                                                  improved 19% for Orange,
         Introduction of heavily                                                                  Vodafone acquires                                                                                              35% for Telefonica and 47%
                                                                                                                                                            Orange acquires                                        for Vodafone since Q2-14
          discounted “Movistar                                                                     Ono for €7.2bn
                                                                                                                                                            Jazztel for €3.3bn
            Fusión” bundles

                                                                                                                                                                                                                                      1.8%
                                                                                     A                                   C                   A                                   C
                                                                                                                                                                                                                               0.5%
                                                                                                                                                                    0.0%
                                                                                                                                                     (0.5%)
                                                                                                                                                                                                              (0.9%)
                                                                                                                                                                                               (1.6%)

                                                                                                                                                                                 (3.0%)
                                                                                                                                 (3.3%)
                                                         (4.8%)
                                                                                                                         (5.3%)
                              (6.2%)        (6.0%)                (5.1%)

                                                                                             (7.3%)      (7.5%)

          (8.8%)
                   (9.8%)

           4Q12        1Q13          2Q13          3Q13          4Q13          1Q14          2Q14          3Q14           4Q14          1Q15          2Q15          3Q15          4Q15          1Q16          2Q16             3Q16   4Q16

                                                               Proportion of 3P / 4P bundles almost                                     Three main national operators initiated
                                                                 triples from 24% in 2012A to 67%                                        c.€3.3bn football rights and c.€9.2bn
                                                                                                                                          network upgrade investment plans

                   Sources: CNMC, IMF and Company Filings.
                   Notes:
                   (1)    Spanish TMT market includes the following segment as defined by CNMC: fixed telephony, broadband, Pay TV, Business communications, Wholesale, Mobile, TV advertising, Other TV and other revenues.
                          A = Announcement; C = Closing

                                                                                                                                                                                                                                               10
2 Market context : data and TV driven market with increased competition
Contribution to growth Spanish telecom sector1,2
CAGR 11A-21E
04.0%
4.0% 2.1%
(0.8%) 02.0% 1.4%
0.6% 1.2%
0.5%
2.0% 1.1% 1.1% 1.3% 1.3% 1.2%
0.6% -
0.5% 2011 2012 2013 2014 2015 2016 2017E 2018E 2019E
(0.1%) 1.9%
- (2.0%)
(3.8%)
(2.8%)
(2.3%) (4.0%)
(2.0%)
(3.0%) (0.9%)
(3.4%) (4.8%)
(6.0%)
(4.0%)
(5.5%) Mobile data (6.9%)
(8.0%)
Fixed broadband
(6.0%) Pay-TV
Mobile voice & messaging (10.0%) (8.9%)
Fixed telefony (9.5%)
Total revenue growth
(8.0%) (12.0%)
2011 2012 2013 2014 2015 2016 2017 2018 2019 2020 2021
Data and TV driving moderate industry growth Moderate growth expected for the coming years
Source Arthur D. Little (2015), CNMC
Notes:
1. Revenue growth over the 2011A - 2019E period calculated as the evolution of the aggregated revenues of the 5 main Spanish competitors (Euskaltel, Movistar, Vodafone, Orange, MásMovil). The series has been adjusted for Ono and Jazztel acquisitions by
Vodafone and Orange. Estimates for 2017E-2019E based on a selection of broker projections for each of the above mentioned companies.
2. 2016 growth excluding Euskaltel, Masmovil and Orange growth. 2017 growth excludes Masmovil
113 High valuable, longstanding customer base and best-in-class brand perception
120 Distribution of our customer base within Average seniority of the
Brand recognition2
our ARPU bands1 group’s client base
12.00
100
10.00
55% 45% Approachable
80 and close
Group average 8.6 years
8.00 Op.1 Op.2 Op.3 Op.4
60
Best quality
6.00 of service
ARPU: Op.1 Op.2 Op.3 Op.4
40
€59.61 4.00
20
2.00
I trust more
than others
0 -
€/month
< 10 10 - 20 - 30 - 40 - 50 - 60 - 70 - 80 - 90 - > Op.1 Op.2 Op.3 Op.4
20 30 40 50 60 70 80 90 100 100
The one I like
most
ARPU ARPU Highly valuable customer base
Op.1 Op.2 Op.3 Op.4
Note
1. ARPU as of 3Q 2017 of the combined entity (Euskaltel + R Cable + Telecable) 12
2. Kantar media independent study (period of study 1H17)4 Fully invested network - Best-in-class fiber network
Coverage (6)
87% 55% 72% 35% 39% 61% 36%(1) 81% 47%
(%HH)
% of EuroDOCSIS 3.0 100% 100% 100% c.50% 92% 100% c.96% 100%(2) 100%
Access capacity
862 862 862 862 862 600(3) 862 750 862
(MHz)
Households
c.500 c.280 c.585 n.a. c.580 c.580 c.450 n.a. c.500
per node (avg.)
✓
Fully-owned backbone (4) (5)
network
4G license
✓ ✓ ✓
via SFR via BASE via Optimus via Vodafone
Future-proofed network supports success-based capex and 17% capex over revenues as medium term target
Source: Company filings.
(1) In Core regions (as defined by Telecolumbus).
(2) EuroDOCSIS NGN.
(3) In August 2014, announced upgrade to 1 GHz in Flanders by 2019.
134 Fully invested network - Euskaltel network vs. FTTH challenge
Symmetry not a threat and… … our network is highly recognised by independent third parties
Broadband traffic evolution since Jan-15 (Upload vs Download) September 2017 ranking
90 Growth
Gbps
(%) 1
80 100% 3 4
3.9 3.9
3.8
70 3.7 3.7 3.7 3.7 3.7
3.7
60
91%
50 3.5
40 3.3
30
3.1
20 14%
(13%) 2.9
10
- 2.7 2.7
Jan-15 Sep-15 May-16 Jan-17 Oct-17
2.5
Weekly average download
Weekly average upload
Previous year - Weekly average download
Previous year - Weekly average upload
Source: Netflix ISP Speed Index
145 Lifetime value of customers | Residential segment
Unrivalled coverage with the Highly attractive and competitive The most complete and innovative
fastest broadband offering mobility proposition TV proposition
The speed leader with the only ultra-fast High-quality and comprehensive content
Full-service, leading MVNO offering covering different customer groups’
broadband offering across the entire region
(100% DOCSIS 3.0 network) needs with possibility of adding premium
channels
Competitive and innovative tariffs to address
Ongoing upgrade to DOCSIS 3.1 real customer needs
Superior fiber coverage in the Basque OTT platform offered by Telecable:
Country, Galicia and Asturias (2.1m homes Largest WiFi network in the Basque Country, - live coverage of Champions League
passed) Galicia and Asturias with more than 400k and Europa League football matches
hotspots allowing for data for clients
Wide offering of commercial speeds, ranging First hybrid 4K/UHD set top box in Spain
from 50Mbps to 350Mbps
Competitive prices offering best value
for money and superior service to competitors Enhanced offering providing a superior and
differentiated user experience (PVR, VoD, TV
Everywhere)
Increased penetration of superior quality
services (HD, catch-up TV, VOD, network
PVR, start over, time shift...)
FY 2017 RGUs: 915k (1)
FY 2017 RGUs: 489k (1) FY 2017 RGUs: 393k (1)
(77.1% penetration over fixed customers)
Convergent offer with a leading value proposition focused on the lifetime value of the client
(1) Pro-forma for Telecable acquisition
155 Leading business segment providing diversification
Diversified through significant B2B(1) presence… … based on strong and unique positioning pillars
Business revenues as a % of total revenues (2)
PF1 27% Strong and local brand
2 27% High technical capabilities in their respective footprint
3 21% Fully oriented offering based on addressing specific
customer needs by sector and client
4 12%
Tailor made and complex solutions
5 6%
Dedicated sales force and customer care to deliver
6 5% best results and services
Clear strategy to leverage superior infrastructure, brand and customer service to win in Business
Sources: Company filings.
(1) % of B2B revenues over total revenues as of 1H-17 LTM revenues
(2) Pro-forma for Telecable acquisition 166 Expansion strategy
Market shares across all segments to be balanced Pillars of the expansion strategy
Cantabria 1 Disciplined
Navarra
Leon
La Rioja
2 Value-accretive
3 Fast time-to-market
4 Ability to leverage brand equity
Canary Islands (Spain)
Current presence Potential expansion areas 5 Consistent with overall strategy
Expansion plan will add over 500,000 households
176 A two-fold approach
Two-fold strategy
Key details of the agreement
Infill projects New regions
with Orange
Framework agreement with
✓ leading operator
Flexible agreement in
terms of:
Economics: Indirect
✓ (opex) vs. co-
investment (capex)
Products and services
Agreement with Orange Agreement with Orange (mutualised / indirect
access model)
Targeted deployment (FTTH – HFC)
Support from regional governments Fast time-to-market ✓ Symmetric and up to 1 GB
Limited competition in targeted areas Well-defined commercial plan
✓ ICX services included
5 year roll out plan
80,000 residential premises
Break-even in 2-3 years No difference in customer
6,200 enterprises ✓ experience
Project IRR > 15%
187 Resilient top line across business segments
Proforma revenue evolution Revenue outlook
(€3.5m) / (0.5%) ✓ Stable - Low single digit revenue growth
€9.3m +€5.9m / +0.8% growth
revenue
Residential
without
margin1
Stable net subscriber evolution preserving current market share
710.5 715.2 Target churn below 14% amid implementation of specific measures
707.0
44.4 36.9 37.0
in Galicia and Asturias
ARPU growth linked to attractive value proposals
Increase 3P&4P penetration in existing customer base
202.2 191.8
206.0
New services will include
Mainly due
to loss of Increase mobile offering and penetration in Asturias
Basque Improved TV functionalities and 4K Deco
country
government New products penetration: Home connectivity, on-street
contract
Wi-Fi…
Revenue of new regions to amount for 5% of total revenue by 2022
476.1 478.3 Around 10-15% subscriber penetration over targeted new regions
460.0
Business
SoHo will mirror similar trends than residential
Renewed commercial push in SMEs and LA targeting to drive superior
2015 2016 2017 growth rates than residential over the medium term
Residential Business Wholesale and other
Penetration of hybrid-cloud, security, big data and alliances
Adjusted for revenue without margin Growth YoY (%) Targeted commercial offering in new expansion areas
Source Company information
Note: 19
1. Change of accounting method in 2016: revenue without margin no longer accounted for (2015 revenue without margin included in €713m revenue at €9.3m)7 Stable gross margin and strong focus on efficiencies to improve cost structure
Proforma gross margin (€m) Proforma EBITDA (€m)
Gross margin as a % of sales (%) EBITDA margin (%)
48.3% 48.2%
74.7% 74.5% 46.7%
72.8%
47.3%
517.3 533.9 526.5
345.3 341.0
331.7
2015 2016 2017 2015 2016 2017
EBITDA margin Adjusted for revenue without margin
Efficient management of Content and ITX costs driving gross Integration synergies and structure optimisation driving EBITDA
✓ ✓
margin over 75% in the medium term margin c.50% in the medium term
✓ Renewed commercial effort in brand equity and expansion
TV strategy focused on functionality and customer experience with
✓
disciplined approach to new content investment
✓ Unified organisation leading to leaner and more flexible operations
Sufficient data allowances under current host agreements to Systems integration, network management and talent management
✓ mitigate ITX costs growth
✓ driving structure optimization
207 Stable capex with future spending linked to commercial success and expansion plan
Proforma capex Capex breakdown and outlook
Capex (as a % of sales)
Business as usual
18.5% capex < 17% revenue
16.9% 17.7%
131.7
121.1 124.9
Business integration
€20m - €25m
and strategic
(2018 - 2019 accum.)
projects investments
Footprint expansion €20m (excluding SAC)
investments (2018 – 2019 accum.)
2015 2016 2017
Recurrent capex to remain in the 16-17% revenue range once Business as usual capex expected to remain below 17% of
✓ platform integration has concluded
✓ revenue
Additional extraordinary capex to be incurred in 2018-2019
✓ period corresponding to business integration, strategic projects
Source Company information and footprint expansion investments
217 Rapid deleveraging, supported by best in class EBITDA and cash conversion
Strong EBITDA performance with remaining future upside… + Historical Operational FCF generation
EBITDA margin (%)(1)
48% 48% 48% 46%
As % of EBITDA 59% 67% 64% 66% 63%
37%
34%
As % of Sales 28% 33% 32% 33% 31%
106
94 91 92
82
K+R+T Liberty Global Com Hem Telenet Nos Numericable
2H 15 1H 16 2H 16 1H 17 2H 17
PF
…driving superior cash flow conversion Historical Net Debt and Net Debt/EBITDA(3)
OpFCF conversion(2) and as % of Sales(1)
31% 30% 22% 18% 12% 13%
4.8x
64% 63% 4.2x c.4.5x
48%
37% 35% 35% 1,606
1,385 1,307
2.6x 1,223 1,185
417
1 2 3 4 5 6
PF
1H 15 2015 1H 16 2016 1H 17 2017
Note: Company data
(1) 1H-17 LTM numbers 22
(2) OpFCF = EBITDA-CAPEX
(3) Leverage shown including synergies. Excluding synergies, leverage equal to 5.1x and 4.7x at R Cable and Telecable closing respectively7 Strong support from debt and equity capital markets
R Cable Repricing of
IPO +
acquisition the Commercial Acquisition Debt
Pre-IPO Debt
+ Debt institutional paper1 of Telecable refinancing
refinancing
refinancing tranche
Total debt Up to
(€m)
€500m €900m €437m €835m
€200m
Total equity
placed (€m)
€840m €255m €250m
5.5% 4.6x 4.4x 4.6x 4.6x
4.5x
4.3x
3.5% 3.5% 3.2% 3.1% 3.0% 2.8%
1.5x
2.7x
Dec-14 Jun-15 Nov-15 Sep-16 Jun-17 Jul-17 Current
Average cost of debt Leverage
BB- Oct-15
Aug-17
B1
Source Company information
Note: 23
1. Commercial paper issued as of Mar-178 Anchor shareholder base
Shareholder structure
21%
21%
Kutxabank
Zegona
53%
55% 15%
15% CF Alba
Free-float
9%
11%
Board of Directors(1)
VP & Lead
Director
Chairman CEO
Proprietary director Executive director Independent director
(1) Proprietary directors in the Board of Directors representing Kutxabank (2), Zegona (1) and Corporación Financiera Alba (1) 24Conclusion
1
Euskaltel has delivered its ambitious organic and inorganic targets in record-time since
the IPO
2
Euskaltel has become a real multi-region platform, deeply rooted in its core markets,
but fully prepared to grow and enter new markets
3
We are competing in an evolving scenario that offers new challenges, but also great
opportunities
4
We have defined a clear and comprehensive strategy focused on value generation
through customer experience, growth and efficiencies, to which the entire
organisation is committed
5
The results of the implementation will offer sustained mid/long-term value creation
potential to our shareholders
25Results presentation 1H18 27 July 2018
1H18 key highlights (proforma data)

    B2C business stabilized in our three main regions       +2,190 fixed net adds
    (Euskadi, Galicia and Asturias)                                in 1H18

     Expansion plan on track as announced
                                                            +1,002 fixed net adds
                                                                   in 1H18

     B2B revenue recovering                                  +1.3% YoY in 1H18

    EBITDA margin growth thanks to announced synergies
                                                            +26bps YoY in 1H18
    and efficiencies

     Solid Free Cash Flow generation                     16.6% over revenue in 1H18

 1H18 results presentation
                                                                                      2
1H18 main figures
Financial figures (statutory data) Residential KPIs
€349.3m Total revenue 578.5k Fixed subscribers
+25.0% yoy +2.5k qoq
€168.8m Adj. EBITDA 14.9% Churn ratio
+22.4% yoy Adj. EBITDA margin 48.3% -74bps qoq
€100.8m OpCF1 €60.0 ARPU global
+10.0% yoy OpCF margin 28.9%2 -0.6% qoq
€28.8m Net income 2,381k Total RGUs
+36.6% yoy +32k qoq
Note: 1. OpCF defined as EBITDA-Capex
2. Operating Cash Flow margin excluding expansion capex stood at 31.3% of revenue
1H18 results presentation
3Operating review
Note: all 2017 data shown are proforma for including Telecable
1H18 results presentation
4B2C | Consolidation of growth in fixed customers
Fixed residential subscribers evolution (000’)
(2.1)
(4.7)
Net adds coming from
(4.7) expansion in Navarra:
Net adds coming from +0.8
expansion in Navarra:
+0.2
592.9 +2.5
(6.1)
+0.6
578.5
575.4 576.0
EOPs 4Q16 Net Adds 1Q17 Net Adds 2Q17 Net Adds 3Q17 Net Adds 4Q17 EOPs 4Q17 Net adds 1Q18 EOPs 1Q18 Net adds 2Q18 EOPs 2Q18
1H18 results presentation
5B2C | Churn approaching annual target while telecom ARPU growing
Churn fixed residential subscribers (% YTD) Residential ARPU (€/month)
(0.2%)
17.5%
17.0%
60.1 60.0
Negative impact yoy:
16.6% • Football (0.4€)
• Interconnection (0.2€)
15.9%
15.6%
+0.5€
68.0% 14.9%
3P/4P penetration
1Q17 2Q17 3Q17 4Q17 1Q18 2Q18
1H17 1H18
Telecom Interconnection Football
1H18 results presentation
6B2C | Bundling and upselling successful strategy
Convergence Broadband Mobile Pay TV
69.3% 85.7% 80.1% 70.6%
3P/4P penetration BB penetration Mobile penetration Pay TV penetration
(+69 bps qoq) (+36bps qoq) (+123bps qoq) (+123bps qoq)
RGUs RGUs RGUs RGUs
2,381k 496k 952k 408k
(includes RGUs of ‘mobile only’ customers)
1H18 results presentation
7B2B segment|Consolidating the growth in B2B revenue
Soho subscribers (000’) SME and Large accounts subscribers evolution (#)
105 103 101 100 100
+57
(145)
+58
(56)
(74) (18)
2Q17 3Q17 4Q17 1Q18 2Q18
14,963
Fixed Soho ARPU (€/month)
Negative impact yoy:
14,785
• Football (0.5€) 14,728
14,670
• Interconnection
69.0 69.0 69.1 68.3 (0.2€)
68.1
EOP 4Q16 Net Adds Net Adds Net Adds Net Adds EOP 4Q17 Net adds EOP 1Q18 Net adds EOP 2Q18
1Q17 2Q17 3Q17 4Q17 1Q18 2Q18
2Q17 3Q17 4Q17 1Q18 2Q18
1H18 results presentation
8Expansion | Navarra on track
EXPANSION PLAN
PHASE 3
28/02/2018 30/06/2018 31/12/2018
HOUSEHOLDS DELIVERED THROUGH PARTNERSHIP WITH ORANGE
✓ Postmail Marketing campaigns ✓ Massive campaign
First store opened in Navarra (Ansoain) Second store opened in Navarra (Pamplona)
4,000+
1,002 Active
Active customers
customers expected
✓ New areas to be entered
✓ New stores to be opened
1H18 results presentation
9Financial review
Note: all 2017 data shown are proforma for including Telecable
1H18 results presentation
10Top line performance
Total revenue (€m) Residential revenue (€m)
(0.8%) Fixed Global ARPU
(4.7)
352.2 349.3 +1.6
(0.7)
(1.4)
(0.8)
(0.7)
238.7 232.1
238.7 0.0%
232.1
77.1%
97.2
96.0 Mobile penetration
17.5 19.9
1H17 Lower fixed customer Telecom ARPU fixed Interconnection Football Mobile Only Other 1H18
1H17 1H18
base subscribers
Wholesale & others Business Residential
1H18 results presentation
11EBITDA performance
Adj. EBITDA (€m) and Adj. EBITDA margin (% over revenues) Adj. EBITDA evolution 1H18 vs 1H17 (€m)
Mobile host TV content Customer Mobile Fees &
+1.7 +2.5 equipment equipment Other
(5.1) (0.8) (1.3)
(0.3%)
190,0
54,0%
+5.6
(3.0) (3.1)
170,0
52,0%
150,0
50,0%
48.3%
130,0 48.1%
48,0%
169.3 168.8
110,0 169.3 168.8
46,0%
90,0
44,0%
70,0 42,0%
50,0 40,0% 1H17 Revenue Direct costs Commercial and 1H18
1H17 1H18 overhead
1H18 results presentation
12CAPEX overview 16.8%
Recurrent capex in line with guidance 16.7%
95,0
CAPEX (€m) and CAPEX over revenue (%) CAPEX breakdown (€m) and CAPEX over revenue (%)
85,0
45,0 30,0%
40,0 75,0
25,0% 67.9
35,0
59.8
21.5% 65,0
8.5
30,0 20,0% 0.9
19.7%
19.2% 55,0
25,0 16.4% 0.0%
15.2% 15,0% 17.0%
17.4%
20,0 45,0 16.2%
38.4
16.7%
33.9 34.0
15,0 29.0 10,0% 58.9 59.4
26.8 35,0
10,0
5,0% 25,0
5,0
0,0 0,0% 15,0
1H17 1H18
2Q17 3Q17 4Q17 1Q18 2Q18
Capex ex - expansion Expansion
1H18 results presentation
13Cash generation
OpCF1 (€m) and OpCF margin (% over revenue) Cash allocation (€m)
Over revenue (%)
31.1% 48.3%
ex – expansion
70,0 31.9% 32.5% 35,0%
28.5%
29.3%
60,0 27.6% 30,0%
(67.9)
50,0 25,0% 28.9%
40,0 20,0% (20.1)
168.8
30,0 15,0% (22.9)
16.6%
56.3 57.3
49.2 50.3 50.5
100.8 22.7
20,0 10,0%
57.9
10,0 5,0% 35.2
0,0 0,0% EBITDA 1H18 Capex OpCF 1H18 Interest expenses WC,tax&others 2 FCF 1H18 Dividends Debt reduction since
Dec17
2Q17 3Q17 4Q17 1Q18 2Q18
Net Debt Net Debt/EBITDA3 Average Cost of Debt Average Maturity
€1,571m 4.46x 2.76% 5.0 years
Note:
1. Operating Cash Flow calculated as EBITDA-capex
2. ‘WC,tax&others’ includes €13.3m of non recurrent payments related to the acquisition of Telecable and the optimization of the organizational structure
3. Including €12m of synergies in EBITDA
1H18 results presentation
14Thank you
You can also read