Qantas Airways Limited 1H18 Results - ASX:QAN US OTC:QABSY 22 February 2018 - Open Briefing
←
→
Page content transcription
If your browser does not render page correctly, please read the page content below
Qantas Airways Limited
1H18 Results
22 February 2018

ASX:QAN
US OTC:QABSY
1H18 Highlights

Another record performance

    •      Record first half Underlying Profit Before Tax (PBT)1 $976m, Statutory PBT $857m

    •      Continued strong Group Return on Invested Capital (ROIC) of 20.9%2

    •      All operating segments delivering ROIC > WACC 3

    •      Effectively managing increases in fuel costs

    •      Ongoing transformation on track to deliver >$400m gross benefits in FY18

Continuing to invest for customers

    •      787-9 Dreamliner entered into service, new London and Perth lounges

Balance sheet continues to strengthen

    •      Net debt4 of $5.1b, towards the bottom of the target range

    •      $500m returned to shareholders in first half

    •      Announced 7 cents per share dividend, unfranked, additional on-market share buy-back of up to $378m

                            UNDERLYING EARNINGS PER SHARE UP 19%5 TO A RECORD 38.7 CENTS PER SHARE
 1. Underlying PBT is a non-statutory measure and is the primary reporting measure used by the chief operating decision-making bodies, being the Chief Executive Officer, Group Management Committee and the
 Board of Directors, for the purpose of assessing the performance of the Qantas Group. All items in the 1H18 Results Presentation are reported on an Underlying basis. For a reconciliation to Underlying PBT, please
 see slide 6 in the Supplementary presentation. 2. Calculated as ROIC EBIT for the 12 months ended 31 December 2017, divided by the 12-months average Invested Capital. 3. Weighted Average Cost of Capital                      2
 calculated on a pre-tax basis. 4. Net debt under the Group’s Financial Framework includes net on balance sheet debt and off balance sheet aircraft operating lease liabilities. For a detailed calculation of net debt target
 range, please see slide 12 in the Supplementary presentation. 5. Compared to 1H17.
Integrated Portfolio Provides a Stable Earnings Base

                                                                                                                                                    Operating Segment EBIT3

                             Maximising leading Dual Brand Domestic
                             position with customer focused investments
                                                                                                                              $1.2b

                             Group Domestic1 Underlying EBIT of $652m                                                                                                                         Group
                                                                                                                                                                                          International4
                $            supported by proactive capacity management                                                                         Group
                                                                                                                                            International4             Group
                                                                                                                                                                   International4
                                                                                                                              $0.8b

                             Continued Loyalty earnings growth2 and
                             diversification
                                                                                                                                               Group                  Group                 Group
                                                                                                                                              Domestic1              Domestic1             Domestic1
                             Strengthening core airline partnerships and                                                      $0.4b
                             continued Transformation to reduce earnings
                             volatility
                                                                                                                                                Loyalty               Loyalty                Loyalty
                             Highly trusted brand that supports diversification                                               $0.0b
                             into new businesses                                                                                               1 H1 6                1 H1 7                 1 H1 8

                                            INTEGRATED PORTFOLIO PROVIDES A STABLE EARNINGS BASE

                                                                                                                                                                                                           3
1. Group Domestic includes Qantas Domestic and Jetstar Domestic. 2. Measured on Underlying EBIT compared to 1H17. 3. Measured on Underlying EBIT. 4. Group International includes Qantas International,
Qantas Freight, Jetstar International Australian operations, Jetstar New Zealand (including Jetstar Regionals), Jetstar Asia (Singapore) and the contributions from Jetstar Japan and Jetstar Pacific.
1H18 Key Group Financial Metrics

             Underlying PBT1                               Underlying EPS3                              12 Month ROIC%                                                       Cash Flow

                                                                   38.7c                                                                                                    $1,734m
                   $976m                                           Up 19%2
                                                                                                                                                             Operating cash flow, Up $561m 2
                   Up $124m2                                                                                   20.9%
           Statutory PBT $857m
                                                          Statutory EPS 34.0c
                                                                                                                 > WACC                                                       $772m
                                                                Up 25%2                                                                                       Net free cash flow4, Up $484m 2

               Unit Revenue5                                Total Unit Cost6                           Operating Margin7                                         Traffic/Capacity Growth

                                                                                                               12.3%                                                  ASKs8 +2.0%
                    +3.5%                                        +2.0%                                    Versus 11.6% in
                                                                                                               1H17                                                  RPKs9 +5.2%

1. Underlying PBT is a non-statutory measure and is the primary reporting measure used by the chief operating decision-making bodies, being the Chief Executive Officer, Group Management Committee and the
Board of Directors, for the purpose of assessing the performance of the Qantas Group. All items in the 1H18 Results Presentation are reported on an Underlying basis. Refer to Supplementary slide 6 for a
reconciliation of Underlying to Statutory PBT. 2. Compared to 1H17. 3. Underlying Earnings Per Share is calculated as Underlying PBT less tax expense (based on the Group’s effective tax rate of 29.2%) divided by
the weighted average number of shares during the year (consistent with the Statutory Earnings per share calculation). 4. Net cash from operating activities less net cash used in investing activities (excluding aircraft
operating lease refinancing). 5. Ticketed passenger revenue per Available Seat Kilometre (ASK). 6. Underlying PBT less ticketed passenger revenue per Available Seat Kilometre (ASK). 7. Group Underlying EBIT               4
divided by Group Total Revenue. 8. Available Seat Kilometres. Total number of seats available for passengers, multiplied by the number of kilometres flown. 9. Revenue passenger kilometres. Total number of
passengers carried, multiplied by the number of kilometres flown.
1H18 Profit Bridge

                                                                           Underlying Profit Before Tax ($M)
                                                58
                                                                   99                                      19
                                                                                       47
                           339                                                                                                125                                     58                                     976
                                                                                                                                                  100                                      3
       852

                                              Net revenue benefits2                          $ 71m
                                              Fuel efficiency benefits3                      $ 10m
                                              Non-fuel cost reduction                        $100m
                                              Transformation benefits                        $181m

     1H17                Ticketed         Fuel Expense          Cost from          FX on Net        Depreciation &            CPI5          Transformation        Bond Rate6             Other             1H18
 Underlying PBT         Passenger                              Activity and         Non-Fuel        Non-cancellable                         Cost Reduction                                             Underlying PBT
                        Revenue1                                 Network          Expenditure 4         Aircraft
                                                                Changes                                Operating
                                                                                                     Lease Rentals

1. Represents the change in Unit Revenue and Available Seat Kilometres. 2. Revenue benefits less incremental costs associated with that benefit including costs of increased activity where related to a Transformation      5
initiative. 3. Includes reduction in consumption from fuel efficiency and reduction in into-plane costs following Transformation initiatives. 4. FX other than on ticketed passenger revenue, fuel and depreciation & non-
cancellable aircraft operating lease rentals. 5. Company estimate, including wage and other inflation. 6. Revaluation impact of discount rate and other actuarial assumption changes on employee-related provisions.
Maximising Leading Dual Brand Domestic Position
     Dual brand strategy at the core of Group’s portfolio strength

                                                                                                                                   Average Domestic Market Capacity Growth5
$652m                Record Group Domestic1 Underlying EBIT in 1H18

                                                                                                                            2.2%
                                                                                                                                              -1.4%                0.7%              -0.5%            -0.9%

 >10%                >10% ROIC2 for Qantas and Jetstar Domestic
                                                                                                                            FY14               FY15                FY16              FY17             1H18

                                                                                                                                         Growing Qantas and Jetstar Margins4
                     More Qantas Domestic departures from capital
 ~50%                ports3 compared to competitor                                                                           1H17         1H18
                                                                                                                                                                              +1.6
                                                                                                                               +1.9

                     Increase in operating margin4 at Qantas Domestic
+1.9pts              compared to 1H17
                                                                                                                                                                          14.8% 16.4%
                                                                                                                          12.7% 14.6%
                                                                                                                                                                                               2.1%
                                                                                                                                                  4.5%

                                                                                                                        Qantas Domestic         Virgin Australia          Jetstar Group      Tigerair Australia
                     Increase in operating margin at Jetstar Group
+1.6pts              compared to 1H17
                                                                                                                                                   Domestic

                                                                                                                                   Note. 1H18 Competitor margins not available as at 22 February 2018

                                  THE DUAL BRAND STRATEGY CONTINUES TO DELIVER SUPERIOR MARGINS

1. Includes Qantas Domestic and Jetstar Domestic. 2. Calculated as ROIC EBIT for the 12 months ended 31 December 2017, divided by the 12-months average Invested Capital. 3. Qantas Domestic compared to              6
Virgin Australia Domestic for 1H18. Source Diio Mi and internal estimates. 4. Calculated as Underlying segment EBIT divided by total segment revenue. Competitor operating margins calculated using published data.
5. Compared to prior corresponding year or half year. Source: BITRE capacity data and published schedules.
Building a More Resilient Qantas International

                                                                                                             46% capacity growth in Asia markets since 1H156 including
                                                                                                           introduction of new routes and upgauges to improve customer
  >10%                >10% ROIC1 since FY15                                                                                         proposition

                                                                                                                                                     Beijing
                       Capacity growth since                1H152
                                                       achieved through                                                                                                               Tokyo
   17%                 increase in utilisation3 of existing group fleet
                                                                                                                                                                          Osaka
                                                                                                                                                       Shanghai

                                                                                                                                                  Hong Kong

                       Increase in utilisation of International widebody                                                            Bangkok
                                                                                                                                                         Manila
   14%                 fleet since 1H154

                                                                                                                                      Singapore

                                                                                                                                           Jakarta             Denpasar
                       Codeshare destinations across the world further
  >230                 enhancing network reach and Group value
                       through alliance partnerships

                       of Qantas International capacity devoted to high-                                                                                                                           Brisbane
   37%                 growth Asia markets5 with further increases                                                   New or additional capacity                  Perth                            Sydney
                       announced                                                                                     Announced to commence 2H18 7                                             Melbourne
                                                                                                                     Australia major cities to Asian gateways pre FY15
1. Calculated as rolling 12 month ROIC EBIT, divided by the 12-months average Invested Capital for each financial period. 2. 1H18 ASKs compared to 1H15. 3. Average block hours per aircraft per day compared to
1H15. Based on Qantas internal reporting. 4. 1H18 widebody fleet average block hours per aircraft per day compared to 1H15. Based on Qantas internal reporting. 5. Includes South East Asia, North East Asia and   7
Japan. 6. 1H18 ASKs in Asia markets compared to 1H15. 7. Sydney-Singapore A380 upgauge to commence 4 March 2018, Melbourne-Singapore A380 upgauge to commence 25 March 2018 and Melbourne-
Denpasar route to commence 23 June 2018.
Segment Results
Qantas Domestic

•       Record1 first half Underlying EBIT and Operating Margin                                                                                                               1H18          1H17 VLY %9
•       Unit Revenue up 8.6%                                                                                                 Revenue                              $M         3,070          2,916              5.3
       –     Disciplined capacity management                                                                                 Underlying EBIT                      $M            447            371              20
       –     Leadership in corporate market share; growing SME2 share                                                        Operating Margin7                      %          14.6           12.7        1.9pts
       –     Resource market revenue growth3                                                                                 ASKs                                   M      17,681         18,254            (3.1)
•       Continued cost base discipline and transformation
                                                                                                                             Seat factor8                           %          78.7           77.3       1.4 pts
•       Investment in customer experience

      –      >30% of 737-800 fleet now Wi-Fi equipped

      –      >16pts customer advocacy premium to competitor4

      –      86% on time performance, on par with competitor 5

      –      Resident fares introduced in selected regional markets6

                                     MAINTAINING OUR LEADING POSITION IN THE DOMESTIC PREMIUM MARKET
    1. For Qantas Domestic segment, reported as an operating segment since FY13. 2. Small to Medium Enterprise. 3. Resource marke t ticketed passenger revenue compared to 1H17. Based on Qantas internal
    reporting. 4. Customer advocacy measured as Net Promoter Score (NPS). Competitor refers to Virgin Australia. Based on Qantas internal reporting. 5. On time performance (OTP) of Qantas Domestic Mainline
    (excluding QantasLink) operations, measured as departures within 15 minutes of scheduled departure time. Average for the 12 months to December 2017. Source: BITRE. Competitor refers to Virgin Australia.      9
    6. Revenue for regional non Corporate passengers on regional routes comprises 5% of Group Domestic revenue. 7. Operating margin calculated as Underlying EBIT divided by total segment revenue. 8. RPKs divided
    by ASKs. 9. Variance to 1H17.
Qantas International1
• Strong Underlying EBIT and Operating Margin performance 1H18 1H179 VLY %
– Unit revenue up 0.3%2 in competitive environment Revenue $M 3,439 3,204 7.3
• Dreamliner and new network structure will deliver benefits in FY19 Underlying EBIT $M 222 235 (5.5)
– Commenced MEL-LAX3 Dreamliner service Operating Margin % 6.5 7.3 (0.8)pts
– PER-LHR4 from March 2018; MEL-SFO5 and BNE-LAX-JFK6 ASKs M 34,714 32,756 6.0
Dreamliner services from September 2018
Seat factor % 84.4 81.3 3.1pts
– Dreamliner contributing to ongoing cost base transformation
• Strengthening core airline partnerships 7
• Steady performance in freight market
• Continuing investment in customer experience
– Customer service training completed by more than 2,000 cabin crew and frontline employees
– New London lounge opened; new Perth lounge to open March 2018
– Partnering with the University of Sydney’s Charles Perkins Centre to improve customer in-flight well-being
FLEET AND NETWORK CHANGES TO DRIVE IMPROVED8 PERFORMANCE IN FY19
1. The Qantas Freight segment which was previously a separate operating segment has been consolidated into the Qantas International segment. 2. Calculated as ticketed passenger revenue per ASK including FX
(1.6% improvement excluding FX). 3. Melbourne – Los Angeles. 4. Perth – London. 5. Melbourne – San Francisco. 6. Brisbane – Los Angeles – New York. 7. On 16 February 2018 the ACCC issued a draft
determination indicating that it proposes to grant reauthorisation for the Qantas/Emirates partnership for a further 5 years. Qantas will resubmit the application for anti-trust immunity of the American Airlines joint 10
business agreement to the US Department of Transportation, and is growing its China presence with China Eastern joint busines s. 8. Assuming no change to Fuel and competitive environment. 9. Comparatives
restated to reflect the consolidation of Qantas Freight into the Qantas International segment.Jetstar Group
• Record first half Underlying EBIT and Operating Margin 1H18 1H17 VLY %
• Record Domestic result1, Unit Revenue up 7% Revenue7 $M 1,936 1,859 4.1
• Strong International2 earnings1 Underlying EBIT $M 318 275 15.6
• Jetstar’s Asian airlines portfolio3 was profitable Operating Margin % 16.4 14.8 1.6pts
– Jetstar Japan maintained LCC4 leadership position5 ASKs M 24,845 24,722 0.5
– Jetstar Pacific improved earnings performance1 Seat factor % 85.7 83.3 2.4pts
• Growing International network into Bali, Vietnam and China and its
territories
• Continuing investment in digital transformation, operational improvements and customer experience
– Next phase of service training for more than 3,000 team members
– Cabin Enhancement Program for A321 retrofit complete and A320 retrofit underway
– Club Jetstar continued growth with more than 195,000 members6
– New and innovative payment options launched
PROFITABLE MODEL WITH SIGNIFICANT GROWTH POTENTIAL
1. Underlying EBIT. 2. Includes Jetstar International Australian operations, Jetstar New Zealand (including Jetstar Regionals), Jetstar Asia (Singapore), Jetstar Japan and Jetstar Pacific. 3. Includes Jetstar Asia
(Singapore), Jetstar Japan and Jetstar Pacific. 4. Low Cost Carrier. 5. Measured as percentage of market share based on ASKs for 1H18. Source: Diio Mi. 6. Members as at 13 February 2018. Launched in Japan
11
and Singapore in 1H18, continued member growth in Australia and New Zealand following relaunch in May 2017 and June 2017 respectively. 7. Revenue consolidated by the Qantas Group, does not include Jetstar
Japan and Jetstar Pacific.Qantas Loyalty
• Record first half Underlying EBIT result 1H18 1H17 VLY %
− Strategy to mitigate interchange fee regulatory change on track Revenue $M 763 743 2.7%
• Coalition Business fundamentals strengthening Underlying EBIT $M 184 181 1.7%
− Co-branded credit card growth outpacing market1; increases in Operating Margin % 24.1 24.4 (0.3)pts
member earn per credit card2
QFF Members M 12.0 11.6 3.9%7
− 48 new retail earn partners
− Additional ‘Everyday Earn’ partners to commence in fourth quarter of FY18
− Qantas Business Rewards membership growth3 supports the broader SME strategy
• Scaling of New Businesses supported by digital and marketing assets
− Assure Health #1 brand in market for growth4 with one of the lowest premium increases 5
− Launch of the Qantas Premier Everyday card; strong take up of Qantas Premier Platinum card 6
GROWTH AND DIVERSIFICATION OF EARNINGS
1. Based on number of credit card accounts with interest free periods. December 2017 compared to June 2017. Source: RBA credit and card charges statistics. 2. Compared to 1H17. 3. Members at December 2017
compared to June 2017. 4. Based on 12 months to June 2017 growth in net persons insured. Source: APRA Operations of Private Health Insurers Annual Report 2016-2017 and nib policyholder data. 5. Increases
12
effective 1 April 2018. Includes all Qantas Assure products as at 8 December 2017. Source: Australian Government Department of Health, excludes the Australian Government Rebate. 6. Qantas Premier Platinum
card launched in June 2017 and Qantas Premier Everyday card in December 2017. 7. Adjusted to remove the impact of rounding of member numbers.Financial Framework
Financial Framework Aligned with Shareholder Objectives

        1. Maintaining an Optimal                                                        2. ROIC > WACC2                                              3. Disciplined Allocation
            Capital Structure                                                            Through the Cycle                                                   of Capital

                          ✓
        Minimise cost of capital by
                                                                                                  ✓
                                                                                         Deliver ROIC > 10%3
                                                                                                                                                                          ✓
                                                                                                                                                    Grow invested capital with
       targeting a net debt range of                                                      through the cycle                                       disciplined investment, return
               $5.0b to $6.2b1                                                                                                                            surplus capital
                       (See slide 15)                                                      (See slides 16 to 17)                                              (See slides 18 to 19)

                                                            MAINTAINABLE EPS4 GROWTH OVER THE CYCLE

                                                     TOTAL SHAREHOLDER RETURNS IN THE TOP QUARTILE 5

1. Based on current invested capital of ~$9b. For detailed calculation refer to Supplementary slide 12. 2. Weighted Average Cost of Capital, calculated on a pre-tax basis. 3. Target of 10% ROIC allows ROIC to be     14
greater than pre-tax WACC through the cycle. 4. Earnings per Share. 5. Target Total Shareholder Returns within the top quartile of the ASX100 and global listed airline peer group as stated in the 2017 Annual Report,
with reference to the 2017-2019 Long Term Incentive Plan.
Maintaining an Optimal Capital Structure
Leverage and liquidity
Optimal capital structure
• Net debt1 at $5.1b, towards the bottom of the range
Debt Maturity Profile as at 31 December 2017 ($M) 5
• Established innovative A$ Corporate Debt Program
– First issuance - 8 year tenor; $350m
Includes $350m
from new Corporate
– Debt secured by portfolio of mid-life aircraft 400 300
Debt Program
280 250 250
• Unencumbered aircraft valued at ~US$3.7b2
440 440 407 457 486 400 386 13
– 60% of Group fleet3 214 35 175 26
– 2 new 787-9s added to the pool in 1H18 FY18 FY19 FY20 FY21 FY22 FY23 FY24 FY25 FY26 FY27 FY28+
Secured aircraft debt Bonds Syndicated Loan Facility - Drawn
• Investment Grade credit ratings from Moody’s (Baa2)
and S&P (BBB-)
Strong short term liquidity
– Cash of $1.8b4; Undrawn facilities of $1b
Lowers cost of debt
MAINTAINING OPTIMAL CAPITAL STRUCTURE DELIVERS LOWEST WACC
1. Net debt includes on balance sheet debt and aircraft operating lease liabilities under the Group’s Financial Framework. Capitalised aircraft operating lease liabilities are measured at fair value at the lease
commencement date and remeasured over lease term on a principal and interest basis akin to a finance lease. Residual value of capitalised aircraft operating lease liability denominated in foreign currency is 15
translated at the long-term exchange rate. 2. Based on AVAC market values. 3. Based on number of aircraft as at 31 December 2017. The Group fleet totalled 310 aircraft. 17 Aircraft entered the Corporate Debt
Program and 3 leased aircraft were refinanced to unencumbered aircraft in 1H18. 4. Includes cash and cash equivalents as at 31 December 2017. 5. Cash debt maturity profile excluding operating leases.Delivering ROIC >10% Through the Cycle
Protecting ROIC through the disciplined hedging program
• FY18 fuel cost is expected to be ~A$3.24b1 FY18 Fuel Cost Outlook (A$B)
– Expected fuel cost is 81% hedged for the remainder of FY18, protection
3.23 3.241
in place against adverse movements in fuel and FX 3.04
A$3.9
– The level of options provide an average of ~20% participation2 to b
declines in A$ Brent prices for the remainder of the financial year
• FY19 hedging underway consistent with Qantas’ long-term approach
– FY19 expected fuel cost is 50% hedged
– High proportion of options providing participation to favourable price
movements
• Operational flexibility to mitigate rising fuel costs over the medium to
longer term FY15 FY16 FY17 FY18 F
1. As at 15 February 2018. Expected fuel costs for the remainder of FY18 assume that the long term correlation between oil prices and the AUD/USD exchange rate holds. Actual fuel costs for FY18 could be 16
impacted by a breakdown in this assumed correlation or by increases in refiner margins. 2. Participation from current market Brent prices down to A$76/bbl for remainder of FY18. Assumes a correlated move in
AUD/USD exchange rates and oil prices.Delivering ROIC >10% Through the Cycle
FY18 Transformation status
• On track to deliver Transformation gross benefits of at least Transformation Initiatives Status
$400m in FY18
– $181m delivered to date1; Completed initiatives include Development
revenue management system, commercial sourcing and 23%
contract renegotiations Development
47%
• Initiatives to be implemented in 2H18 delivering full year Implementation
benefits to FY19 26%
– Introduction of the 787-9 Dreamliner to Qantas
International
– London network and hub restructure; FY19 benefit Implementation
valued at >$80m Completed 43%
51%
– Commencement of Perth – London direct service using
the 787-9 Dreamliner
Completed
10%
FY18F FY19F
As at Dec-17 2 As at Dec-17 2
ON TRACK TO DELIVER >$400m GROSS BENEFITS IN FY18
17
1. See Supplementary slide 5 for details of Transformation costs treated as items not included in Underlying PBT for 1H18. 2 . Against the annual target.Disciplined Capital Allocation
Disciplined capital expenditure
• FY18 and FY19 aggregate net capital expenditure1 of $3.0b, net of asset sales, no change to prior guidance
• Net capital expenditure of $962m in 1H18
• Net debt towards the bottom of the target range
• Continued generation of sustainable positive net free cash flow2, $772m in 1H18, up $484m3
• Capex allocations determined by whether it enhances shareholder value and generates sufficient free cash flow to:
– Maintain net debt within the target range
– Support base dividend
• Any additional surplus capital prioritised to value creating investment opportunities or returned to shareholders
DISCIPLINED ALLOCATION OF CAPITAL TO INCREASE SHAREHOLDER VALUE
18
1. Equal to net investing cash flows included in the Consolidated Cash Flow Statement (excluding aircraft operating lease refinancing) and the impact to Invested Capital from the disposals/acquisitions of operating
leased aircraft. 2. Net cash from operating activities less net cash used in investing activities (excluding aircraft operating lease refinancing ). 3. Compared to 1H17.Disciplined Capital Allocation
Shareholder distributions
• Completed on-market share buy-back of $373m in 1H18 Shares on Issue (M)
~24% reduction2
– 3.5% of issued capital purchased
– 20.5%1 reduction in shares on issue since Oct 2015 at
an average price of $3.90 2,196 2,062 1,919 1,832 1,808 1,745 1,6722
• On-market share buy-back of up to $378m announced
– ~24%2 reduction in shares on issue at completion of 30 Jun 31 Dec 30 Jun 31 Dec 30 Jun 31 Dec 30 Jun
2015 2015 2016 2016 2017 2017 2018
this buy-back
Track Record of Delivering Shareholder Returns ($M)
• Base interim dividend of 7 cents per share declared,
unfranked totalling $122m
• Future dividends will be unfranked until tax payments Up
373
275 to
resume 505 500
378
91
‒ Carried forward income tax losses estimated at $368m 134 122
127 127
as at 31 December 2017
1H16 2H16 1H17 2H17 1H18 2H18
Capital Return Dividend Buy-back
>$2.6B OF CAPITAL RETURNS3 TO SHAREHOLDERS SINCE OCTOBER 2015
19
1. Reduction in shares calculated against balance as at 1 July 2015. 2. Reduction in shares calculated against balance as at 1 July 2015. Represents indicative reduction in shares where announced buy-back is
calculated based on closing share price on 6 February of $5.16. 3. Subject to completion of announced on-market share buy-back of up to $378m.Building Long-Term Shareholder Value
Customer and Innovation
        Looking forward

•   Complete redevelopment of Sydney International Business Lounge
    to increase capacity by 30%

•   Melbourne Domestic Lounge upgrade underway

•   Interior refresh of 45 QantasLink turboprops

•   Rollout of Wi-Fi on 737-800s

    –    Installed on >30% of fleet to date; majority by the end of 2018

•   Ongoing development of Project Sunrise to achieve the goal of
    direct flights to London and New York from the east coast of
    Australia by 2022

•   Jetstar Cabin Enhancement Program

    –    A321 retrofit complete, A320 retrofit program underway

•   Qantas established an innovation accelerator program, AVRO, to
    partner and invest in early and growth stage technology companies

    –    13 companies from AVRO 2017; 4 secured trials or commercial
         deals, 2 investments

    –    AVRO 2018 opens in April

                                                                           21
Fleet Strategy
Jetstar
• Commencing replacement of the current Jetstar A320/A321CEO fleet
with A321LR NEOs in calendar year 2020
– Initial 18 aircraft of 99 aircraft firm order to be delivered over 2 year
period
• Benefits of A321LR NEO introduction to Jetstar
– Scale and fuel efficiency in Domestic service
– Extended range capability enabling enhanced International flying
options
– Provides fleet flexibility enabling some 787-8 redeployment to
additional leisure destinations
Qantas International
• 787-9 deliveries to continue through 2018
– Aircraft 3 received January 2018, next five 787-9 deliveries by end of
calendar year 2018
• Retirement of 4 oldest 747-400 by the end of calendar year 2019; Retaining 6 youngest 747-400ER aircraft
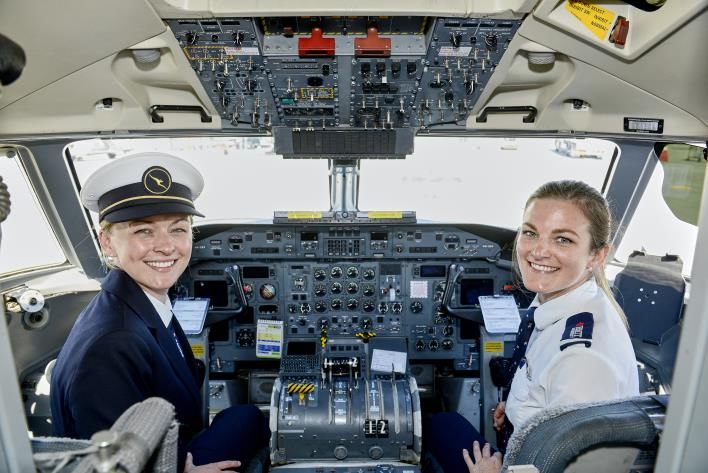
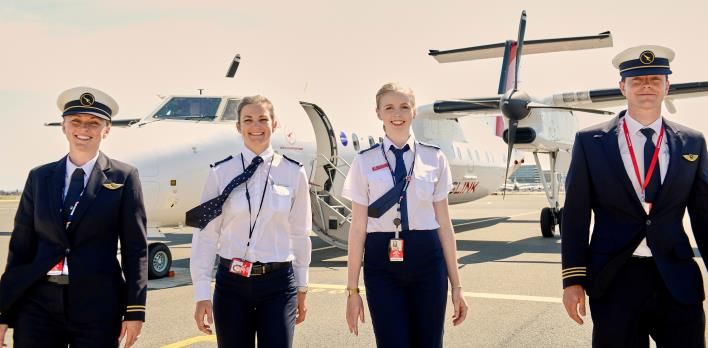
22People – Qantas Group Pilot Academy
• Fleet renewal and network growth driving largest pilot recruitment
and training initiative in the Qantas Group’s 97 year history
• Since 2016, hired over 600 new pilots with ongoing recruitment to
meet Group requirements
• Qantas Group Pilot Academy to be established during 2019
– Initial focus on training up to 100 cadet pilots per year for direct
entry to Qantas Group
– Capability to become a major training centre to meet strong
demand for pilots in the region
• Investing up to $20m in FY19
TRAINING THE NEXT GENERATION OF PILOTS
23Outlook
2H18 Outlook – Domestic and International Operating Environment

•         Healthy consumer demand growth consistent with an improved global outlook

•         2H18 planned Group capacity to increase by ~1%1

•         Group Domestic capacity expected to decrease by ~1%1, expecting continued Unit Revenue growth1, albeit at a lower rate
          than 1H182 given 2H17 Unit Revenue growth of 7%3

      ‒     Continued healthy business and leisure demand despite the less favourable alignment of school holidays and Public
            holidays

•         Group International capacity expected to increase by ~2-3%1

       –     Unit Revenue increased by 0.8% in 1H182, this positive trend is expected to continue into 2H181 despite competitor
             growth of ~5%1

•         Qantas retains significant flexibility to respond to market conditions

                                                                                                                                   25
    1. Compared to 2H17. 2. Compared to 1H17. 3. Compared to 2H16.
FY18 Group Outlook
• Current Group operating expectations:
– FY18 fuel cost expected to be no more than $3.24b1
– FY18 net depreciation and non-cancellable aircraft operating lease rentals expected to be ~$70m higher than FY17
➢ FY18 depreciation and amortisation expense expected to be ~$150m higher than FY17
➢ FY18 non-cancellable aircraft operating lease rentals expected to be ~$80m lower than FY17
– FY18 transformation benefits (cost, fuel efficiency and net revenue) expected to be >$400m
– FY18 inflation impact on expenditure forecasted to be ~$250m (including wage growth)
– Capital expenditure2, net of asset sales, expected to be $3.0b for FY18 and FY19 combined
1. As at 15 February 2018. Expected fuel costs for the remainder of FY18 assume that the long term correlation between oil prices and the AUD/USD exchange rate holds. Actual fuel costs for FY18 could be 26
impacted by a breakdown in this assumed correlation or by increases in refiner margins. 2. Equal to net investing cash flows included in the Consolidated Cash Flow Statement (excluding aircraft operating lease
refinancing) and the impact to Invested Capital from the disposals/acquisitions of operating leased aircraft.Questions?
Disclaimer & ASIC Guidance

This Presentation has been prepared by Qantas Airways Limited (ABN 16 009 661 901) (Qantas).

Summary information
This Presentation contains summary information about Qantas and its subsidiaries (Qantas Group) and their activities current as at 22 February 2018, unless otherwise stated. The information in this Presentation does
not purport to be complete. It should be read in conjunction with the Qantas Group’s other periodic and continuous disclosure announcements lodged with the Australian Securities Exchange, which are available at
www.asx.com.au.

Not financial product advice
This Presentation is for information purposes only and is not financial product or investment advice or a recommendation to acquire Qantas shares and has been prepared without taking into account the objectives,
financial situation or needs of individuals. Before making an investment decision prospective investors should consider the appropriateness of the information having regard to their own objectives, financial situation and
needs and seek legal and taxation advice appropriate to their jurisdiction. Qantas is not licensed to provide financial product advice in respect of Qantas shares. Cooling off rights do not apply to the acquisition of
Qantas shares.

Not tax advice
Tax implications for individual shareholders will depend on the circumstances of the particular shareholder. All shareholders should therefore seek their own professional advice in relation to their tax position. Neither
Qantas nor any of its officers, employees or advisers assumes any liability or responsibility for advising shareholders about the tax consequences of the return of capital and/or share consolidation.

Financial data
All dollar values are in Australian dollars (A$) and financial data is presented within the six months ended 31 December 2017 unless otherwise stated.

Future performance
Forward looking statements, opinions and estimates provided in this Presentation are based on assumptions and contingencies which are subject to change without notice, as are statements about market and industry
trends, which are based on interpretations of current market conditions. Forward looking statements including projections, guidance on future earnings and estimates are provided as a general guide only and should not
be relied upon as an indication or guarantee of future performance.

An investment in Qantas shares is subject to investment and other known and unknown risks, some of which are beyond the control of the Qantas Group, including possible delays in repayment and loss of income and
principal invested. Qantas does not guarantee any particular rate of return or the performance of the Qantas Group nor does it guarantee the repayment of capital from Qantas or any particular tax treatment. Persons
should have regard to the risks outlined in this Presentation.

No representation or warranty, express or implied, is made as to the fairness, accuracy, completeness or correctness of the information, opinions and conclusions contained in this Presentation. To the maximum extent
permitted by law, none of Qantas, its directors, employees or agents, nor any other person accepts any liability, including, without limitation, any liability arising out of fault or negligence, for any loss arising from the use
of the information contained in this Presentation. In particular, no representation or warranty, express or implied is given as to the accuracy, completeness or correctness, likelihood of achievement or reasonableness of
any forecasts, prospects or returns contained in this Presentation nor is any obligation assumed to update such information. Such forecasts, prospects or returns are by their nature subject to significant uncertainties
and contingencies. Before making an investment decision, you should consider, with or without the assistance of a financial adviser, whether an investment is appropriate in light of your particular investment needs,
objectives and financial circumstances.

Past performance
Past performance information given in this Presentation is given for illustrative purposes only and should not be relied upon as (and is not) an indication of future performance.

Not an offer
This Presentation is not, and should not be considered, an offer or an invitation to acquire Qantas shares or any other financial products.

ASIC GUIDANCE
In December 2011 ASIC issued Regulatory Guide 230. To comply with this Guide, Qantas is required to make a clear statement about whether information disclosed in documents other than the financial report has
been audited or reviewed in accordance with Australian Auditing Standards. In line with previous years, this Presentation is unaudited. Notwithstanding this, the Presentation contains disclosures which are extracted or
derived from the Consolidated Interim Financial Report for the half year ended 31 December 2017 which has been reviewed by the Group’s Independent Auditor.                                                                28
You can also read