Cerebellum and brain stem volume loss in relapsing remission multiple sclerosis by MRI volumetry: relation to neurological disability score and ...
←
→
Page content transcription
If your browser does not render page correctly, please read the page content below
Elzayady et al. Egyptian Journal of Radiology and Nuclear Medicine                    (2021) 52:11
https://doi.org/10.1186/s43055-020-00394-w
                                                                                                                   Egyptian Journal of Radiology
                                                                                                                          and Nuclear Medicine

 RESEARCH                                                                                                                                             Open Access

Cerebellum and brain stem volume loss in
relapsing remission multiple sclerosis by
MRI volumetry: relation to neurological
disability score and number of relapses
Magdy Elzayady1,2, Naglaa Lotfy Debees2,3, Mohamed Khalil2,3 and Mohammed Mahmoud Dawoud2,3*

  Abstract
  Background: MRI is the method of choice in the diagnosis of MS as well as in monitoring the disease activity. MRI
  volumetry is used to assess whole or regional brain volume loss which reflects neurodegenerative aspect of the
  disease and plays an important role in all stages of disease. The aim of this work is to study MRI volumetry in the
  evaluation of cerebellum and brain stem volume loss in RRMS patients and its correlation with neurological
  disability score and number of relapses.
  Results: Volumes of whole brainstem, medulla, and pons showed a significant decrease in RRMS cases compared
  to controls (p < 0.05). Brainstem volume had a mean volume of 22.17 and 25.09 cm3 in cases and controls,
  respectively. However, midbrain volume showed no significant difference between cases and controls (p = 0.134).
  Volume of left cerebellar cortex showed a significant decrease in RRMS cases compared to controls (p < 0.001). It
  had mean volumes of 81.64 and 92.14 ml in cases and controls, respectively, at left cerebellar hemisphere, while
  right cerebellar hemisphere cortex volumes were 80.37 and 91.97 ml in cases and controls, respectively. Cerebellar
  white matter showed no significant volume decrease in cases and controls.
  Conclusion: Volumetric MR imaging is an important tool for quantifying the MS disease, assesses MS activity,
  progression, and tissue loss. The degree and the pattern of atrophy on MRI images correlate significantly with the
  neurological disability score and number of relapses.
  Keywords: MRI volumetry in RRMS, Brain stem volume loss in MS, Cerebellar volume loss in MS

Background                                                                                 It was believed that MS associated with loss of white
Multiple sclerosis (MS) is a central nervous system                                      matter (WM) volume, but recent studies have confirmed
(CNS) chronic demyelinating, inflammatory disease with                                   greater grey matter (GM) volume loss. Moreover, pa-
axonal loss. The development of lesions throughout the                                   tients who converted into clinically definite MS over
CNS is its distinguishing criteria. MS characterized by                                  a period of 3 years develop significant brain volume
progressive CNS atrophy and is thought to be a better                                    loss, thus confirming early brain atrophy can present
correlated with permanent disability than T2 lesion load [1].                            in some patients [2, 3].
                                                                                           The positive correlation between progression of MS
                                                                                         and brain atrophy is widely accepted. Magnetic reson-
* Correspondence: dr.m.dawoud82@gmail.com                                                ance imaging (MRI) studies of MS patients clarify that
2
 El-Geish Street, Tanta, Gharbya Governorate, Egypt                                      brain atrophy related to demyelination and axonal loss.
3
 Faculty of Medicine, Tanta University, El-Geish Street, Tanta, Gharbya                  Demyelination is potentially reversible process whereas
Governorate, Egypt
Full list of author information is available at the end of the article                   axonal loss is not [4, 5].

                                         © The Author(s). 2021 Open Access This article is licensed under a Creative Commons Attribution 4.0 International License,
                                         which permits use, sharing, adaptation, distribution and reproduction in any medium or format, as long as you give
                                         appropriate credit to the original author(s) and the source, provide a link to the Creative Commons licence, and indicate if
                                         changes were made. The images or other third party material in this article are included in the article's Creative Commons
                                         licence, unless indicated otherwise in a credit line to the material. If material is not included in the article's Creative Commons
                                         licence and your intended use is not permitted by statutory regulation or exceeds the permitted use, you will need to obtain
                                         permission directly from the copyright holder. To view a copy of this licence, visit http://creativecommons.org/licenses/by/4.0/.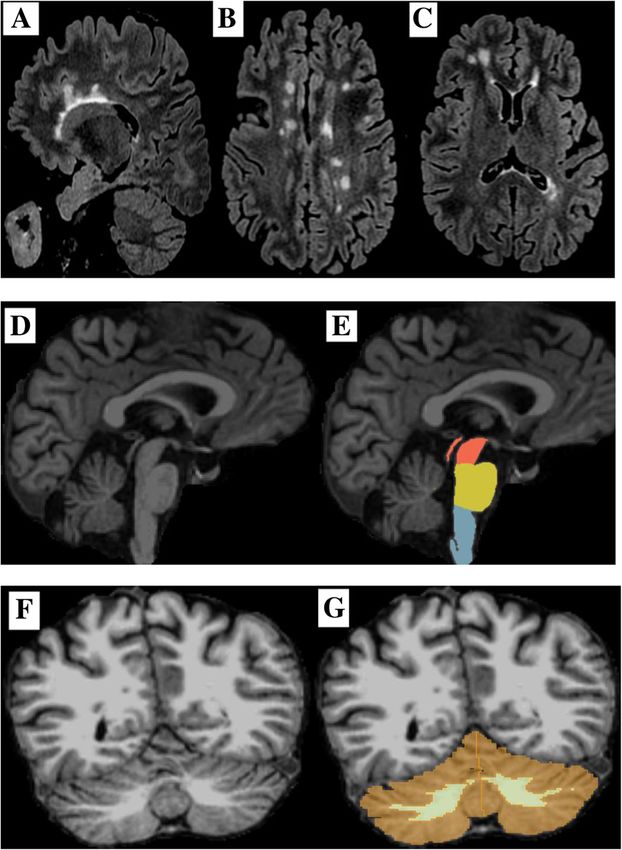
Elzayady et al. Egyptian Journal of Radiology and Nuclear Medicine   (2021) 52:11                                          Page 2 of 9

  While there have been many studies focused on brain                  group I) diagnosed with RRMS by clinical examinations
and spinal cord volume loss, relatively little researches              and conventional MRI according to modified McDo-
have focused on volume loss of the brain stem and cere-                nald’s criteria referred to diagnostic radiology depart-
bellum in MS. The brain stem is a common site for MS                   ment from the neurology department throughout period
affection which can cause vertigo, eye movement disor-                 extending from December 2017 to March 2020. Thirty
ders, urinary problems, tremors, facial pain, hemiplegia,              healthy subjects (control group/group II) with age and
paralysis, and hearing problems. Many of these manifes-                sex distribution similar to case group were selected as
tations may develop early in MS [6].                                   control group, with no medical or neurological disor-
  The cerebellum is functionally and anatomically a                    ders. Patients with cardiac pacemaker, clipped aneurysm
fascinating but complex structure. The cerebellum has the              or cochlear implant, or who refuse examination were ex-
highest growth rate of all brain structures during the late            cluded from study.
fetal and early postnatal life, reaching its adult cell count            Approval of Research Ethics Committee (REC) and in-
only by the age of 2 years. It is segregated in parallel               formed written consent were obtained from all partici-
cortico-nuclear sub-circuits that are integrated in various            pants in the study after full explanation of the benefits
sensory-motor and cognitive-behavioral networks. There-                and risks of the procedure. Privacy and confidentiality of
fore, MS-related tissue damage of the cerebellum affects a             all patient data were guaranteed. All data provision were
magnitude of brain functions and significantly contributes             monitored and used for scientific purpose only.
to the development of disability [7, 8].
  Brain volume measurements are correlated with the                    All patients were subjected to the following
clinical status of patients and are important predictive               Full neurological examination
feature of their clinical evolution. Progressive loss of re-
gional or whole brain volume can be detected in vivo by                Magnetic resonance imaging (MRI) Magnetic reson-
MR imaging, mainly with the use of quantitative mea-                   ance imaging was done for all patients using a 1.5 Tesla
sures acquired by automated techniques [9].                            MRI system (GE sigma explorer).
  MR imaging has become the modality of choice in
evaluation of MS and is used to help the diagnosis and                      a) MRI protocol
track the natural course of the disease. The ability to
detect and characterize the disease burden, including                    Sagittal 3D T1-weighted spoiled gradient (SPGR)
occult microscopic disease invisible when using conven-                utilizing the following parameters in Table 1.
tional MR techniques, has largely improved with the
advent of newer quantitative MR techniques including                   Table 1 Parameters of volumetric MRI protocol
volumetric MR imaging, diffusion tensor imaging (DTI),                 Imaging parameters                              3D T1W SPGR
magnetization transfer imaging (MTI), and proton MR                    Plane                                           Sagittal
(1H-MR) spectroscopy. Today, MR imaging is the most
                                                                       Mode                                            3D
important paraclinical tool for MS, and MR imaging-de-
                                                                       Pulse sequence                                  SPGR
rived measures have been established as standard out-
come markers to monitor the treatment response in                      Prep. time                                      500 ms

various MS clinical trials [10].                                       TE                                              Minimum full
  There are various software programs to calculate volu-               TR                                              7.2 ms
metric changes and assess extension of atrophic changes                FOV                                             256 × 256 mm
in the affected regions that happen during a certain dis-              Phase FOV                                       1.0
ease. One of these programs is 3D Slicer software which                Frequency                                       16 kHz
is a free open-source software application for medical
                                                                       Slice thickness                                 1.2 mm
image computing used to assess volumetric changes that
                                                                       Number of slices                                160
occur in the brain stem and cerebellum in MS [11].
  The aim of this work is to study MRI volumetry in the                Slice spacing                                   0

evaluation of cerebellum and brain stem volume loss in                 Flip angle                                      10°
RRMS patients and its correlation with neurological                    Matrix                                          192 × 192
disability score and number of relapses.                               Freq DIR                                        S/I
                                                                       NEX                                             1.0
Methods                                                                Shim                                            Auto
Patients population
                                                                       Phased array uniformity enhancement (PURE)      On
This prospective study included 60 subjects (30 case
                                                                       Surface coil intensity correction (SCIC)        Off
groups, 30 control groups). Thirty patients (case group/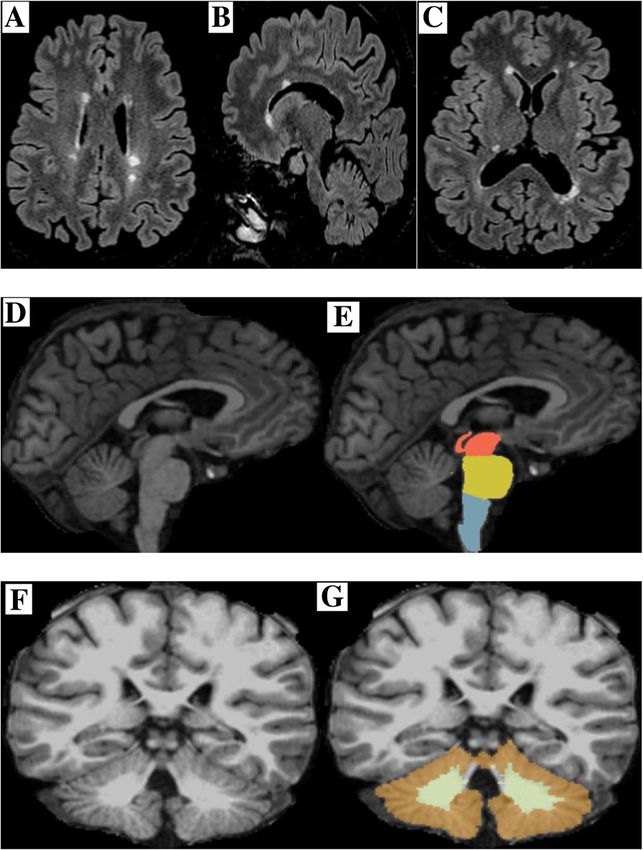
Elzayady et al. Egyptian Journal of Radiology and Nuclear Medicine   (2021) 52:11                                                 Page 3 of 9

  b) Image analysis                                                    Table 2 Age and sex distribution in the studied subjects (n = 60)
                                                                       Age and sex distribution in the studied control group (n = 30)
  Volumetric analysis has been done by 3D Slicer software              Age in years      Sex                               Total
package version 4.6 using semi-automated technique to                                    Male            Female
calculate the volumes of cerebellar gray matter, cerebellar
                                                                                         No.    %        No.      %        No.        %
white matter, midbrain, pons, medulla oblongata, and
whole brain stem. 3D Slicer software is an open source                 25–> 30           4      13.33    6        20       10         33.33
medical image computing platform for biomedical research               30–> 35           4      13.33    10       33.33    14         46.66
and freely downloadable. Semi-automatic slice-by-slice seg-            35–≥ 40           3      10       3        10       6          20
mentations of every data set have been performed. As hard-             Age and sex distribution in the studied case group (n = 30)
ware platform, we used a computer with Intel Core i7-750
                                                                       Age in years      Sex                               Total
CPU, 4 × 2.66 GHz, 8 GB RAM, with Windows 10 Profes-
                                                                                         Male            Female
sional × 64.
                                                                                         No.    %        No.      %        No.        %
  c) Image interpretation                                              25–> 30           3      10       2        6.66     5          16.66
                                                                       30–> 35           6      20       12       40       18         60
  Interpretation of MR images and volumetric analysis                  35–≥ 40           3      10       4        13.33    7          23.33
were done by two experienced radiologists with at least
5 years of experience in neuroradiology.
                                                                       from 0.5 to 5 with a mean of 2. The number of relapses
Statistical analysis of the data                                       was ranges between 1 and 7 with a mean of 3. These
Data were fed to the computer and analyzed using IBM                   findings were listed in Table 3.
SPSS software package version 20.0. Qualitative data                      Magnetic resonance volumetry was done for all sub-
were described using number and percent. Quantitative                  jects (case and control groups) to assess volume of
data were described using range (minimum and max-                      medulla oblongata, pons, midbrain, whole brain stem,
imum), mean, standard deviation, and median. Compari-                  left cerebellar white matter, left cerebellar grey matter,
son of MR volumetric findings with normal values was                   right cerebellar white matter, and right cerebellar grey
done using one sample t test. Significance test results                matter.
are quoted as two-tailed probabilities. Significance of the               The volume of medulla oblongata in the case group
obtained results was judged at the 5% level.                           (3.09–3.71 cm3) with a mean volume of 3.41 ± 0.25 cm3.
                                                                       In control group (4.25–5.12 cm3) with a mean volume of
Results                                                                4.71 ± 0.45 cm3 with statistically significant difference
Case group (group I) included 30 patents with RRMS                     between the two groups (p = 0.041). The volume of pons
(18 female & 12 male), their ages ranged from 24 to 38                 in case group (11.42–14.03 cm3) with a mean volume of
years with a mean age of 30.93 ± 3.67 years. Control                   12.08 ± 1.35 cm3. In the control group (12.66–16.51
group (group II) included 30 healthy subjects (19 female               cm3) with a mean volume of 14.16 ± 1.64 cm3 with sta-
and 11 male), their ages ranged from 25 to 38 years with               tistically significant difference between the two groups
a mean age of 31.13 ± 3.62 years. Most of the subjects                 (p = 0.039). The volume of midbrain in the case group
included in the study were females (60% in the cases                   (4.74–5.97 cm3) with a mean volume of 5.37 ± 0.45 cm3.
group and 63.3% in the control group). Different body                  In the control group (5.24–6.33 cm3) with a mean vol-
measurements were nearly the same in both groups in-                   ume of 5.97 ± 0.59 cm3 with no statistically significant
cluding height (mean height 178.16 ± 7.12 in case                      difference between the two groups (p = 0.134). The
group\168.47 ± 8.26 in control group) and body weight
(mean body weight 85.98 ± 10.96 in case group\84.96 ±                  Table 3 Clinical presentations in the studied cases (n = 30)
14.46 in control group), the above findings were listed in
                                                                       Variable                              Frequency     Percentage (%)
Table 2.
                                                                       Pyramidal dysfunction                 25            83.3
  Pyramidal dysfunction was detected in 25 cases,
sensory dysfunction (19 cases), cerebral dysfunction (11               Sensory dysfunction                   19            63.3
cases), cerebellar dysfunction (18 cases), bowel and blad-             Cerebral dysfunction                  11            36.7
der dysfunction (16 cases), visual problems (22 cases),                Cerebellar dysfunction                18            60
and mental problems (2 cases). More than one com-                      Bowel and bladder dysfunction         16            53.3
plains detected in the same patient. The disease duration              Visual problems                       22            73.3
ranged between 1 and 13 years with a mean disease
                                                                       Mental problems                       2             6.7
duration was 6.78 ± 3.17 years. The EDSS score ranged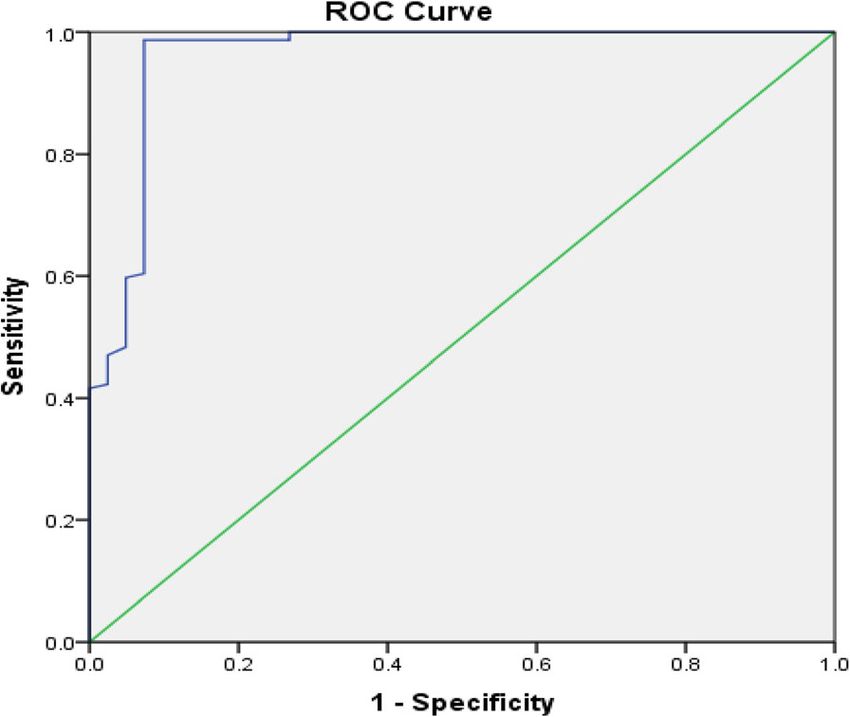
Elzayady et al. Egyptian Journal of Radiology and Nuclear Medicine   (2021) 52:11                                      Page 4 of 9

whole brain stem volume in the case group (19.11–25.4                  the two groups (p < 0.001). Volumetric analysis mea-
cm3) with a mean volume of 22.17 ± 2.37 cm3, in the                    surements of right cerebellar hemisphere were listed in
control group (22.46–28.1 cm3) with a mean volume of                   Table 5.
25.09 ± 2.58 cm3 with statistically significant difference               The best cut-off value of a mean cerebellar grey matter
between the two groups (p = 0.025). Volumetric analysis                volume between cases and controls to detect volume
measurements of brain stem were listed in Table 4.                     loss was < 83.46 Scm3. The area under the curve (AUC)
  The best cut-off value of the whole brain stem volume                at this point was 0.937 with 97.8% sensitivity, 95.7% spe-
to detect volume loss between cases and controls was <                 cificity, 96.4% PPV, and 94.3% NPV. The best cut-off
23.25 cm3. The area under the curve (AUC) at this point                value of a mean cerebellar white matter volume to detect
was 0.855 with 84% sensitivity, 86% specificity, 64% PPV,              volume loss between control and case group was < 21.74
and 74% NPV as shown in Fig. 1.                                        cm3. The area under the curve (AUC) at this point was
  The volume of left cerebellar white matter in the case               0.774 with 62% sensitivity, 96% specificity, 88% PPV, and
group (18.86–24.1 cm3) with a mean volume of 21.75 ±                   95% NPV as described in Figs. 2 and 3.
2.87 cm3 and in the control group (19.06–25.21 cm3)                      Thirteen cases with EDSS score of (0.5–≤ 1) showed
with a mean volume of 22.04 ± 3.27 cm3, no statistically               the following brain stem and cerebellar volume measure-
significant difference between the two groups (p =                     ments; medulla (3.5–3.71 cm3), pons (13–14.03 cm3),
0.264). The volume of left cerebellar cortex (grey matter)             midbrain (5.5–5.97 cm3), whole brain stem (23.7–25.4
in the cases group (76.33–86.52 cm3) with a mean                       cm3), left cerebellar white matter (23–24.1 cm3), left
volume of 81.64 ± 4.8 cm3 and in the control group                     cerebellar grey matter (83.55–86.52 cm3), right cerebel-
(84.39–102.17 cm3) with a mean volume of 92.14 ± 9.83                  lar white matter (22.5–24.08 cm3), and right cerebellar
cm3 with high statistically significant difference between             grey matter (82.7–85.11 cm3). Eleven cases with EDSS
the two groups (p < 0.001). Volumetric analysis mea-                   score of (< 1–≤ 3) showed the following brain stem and
surements of left cerebellar hemisphere were listed in                 cerebellar volume measurements: medulla (3.15–3.49
Table 5.                                                               cm3), pons (11.9–13.04 cm3), midbrain (5.03–5.51 cm3),
  The right cerebellar white matter volume in the cases                whole brain stem (20.46–23.91 cm3), left cerebellar
group (18.65–24.08 cm3) with a mean volume of 21.41 ±                  white matter (19.7–23.38 cm3), left cerebellar grey mat-
2.67 cm3 and in the control group (18.55–25.54 cm3)                    ter (78.15–84.02 cm3), right cerebellar white matter
with a mean volume of 22.32 ± 3.18 cm3 with no statisti-               (21.62–23.09 cm3), and right cerebellar grey matter
cally significant difference between the two groups (p =               (77.5–82.73 cm3). Six cases with EDSS score of (< 3–≤
0.174). The volume of right cerebellar cortex (grey mat-               5) showed the following brain stem and cerebellar vol-
ter) in the cases group (75.92–85.11 cm3) with a mean                  ume measurements: medulla (3.09–3.22 cm3), pons
volume of 80.37 ± 4.68 cm3 and in the control group                    (11.42–12.07 cm3), midbrain (4.7–5 cm3), whole brain
(84.36–101.87 cm3) with a mean volume of 91.97 ± 8.38                  stem (19.11–21.34 cm3), left cerebellar white matter
cm3 with high statistically significant difference between             (18.86–20.03 cm3), left cerebellar grey matter (76.3–79

Table 4 Volumetric MRI analysis measurements of brain stem in studied subjects (n = 60)
                                         Group I (case group)                       Group II (control group)              p value
                                         n = 30                                     n = 30
Medulla oblongata (cm3)
Mean ± SD                                3.41 ± 0.25                                4.71 ± 0.45                           0.041*
Range                                    (3.09–3.71)                                (4.25–5.12)
Pons (cm3)
Mean ± SD                                12.08 ± 1.35                               14.16 ± 1.64                          0.039*
Range                                    (11.42–14.03)                              (12.66–16.51)
Midbrain (cm3)
Mean ± SD                                5.37 ± 0.45                                5.97 ± 0.59                           0.134
Range                                    (4.74–5.97)                                (5.24–6.33)
Whole brain stem (cm3)
Mean ± SD                                22.17 ± 2.37                               25.09 ± 2.58                          0.025*
Range                                    (19.11–25.4)                               (22.46–28.10)
Data are expressed as mean ± SD, p probability
*Statistically significant (p < 0.05)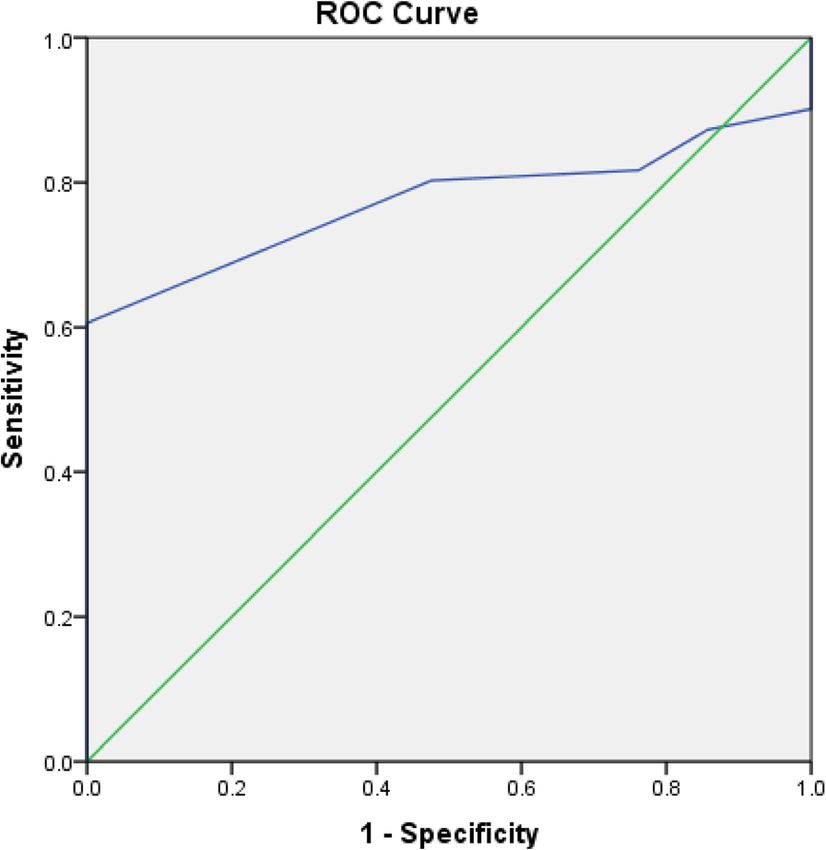
Elzayady et al. Egyptian Journal of Radiology and Nuclear Medicine        (2021) 52:11                                                  Page 5 of 9

                                                                              Fig. 2 ROC curve of prediction of cerebellar grey matter volume loss
                                                                              in RRMS cases

 Fig. 1 ROC curve of prediction of whole brain stem volume loss in
                                                                            measurements: medulla (3.2–3.71 cm3), pons (13.4–
 RRMS cases                                                                 14.03 cm3), midbrain (5.7–5.97 cm3), whole brain stem
                                                                            (24.7–25.4 cm3), left cerebellar white matter (23.4–24.1
                                                                            cm3), left cerebellar grey matter (82.78–86.52 cm3), right
cm3), right cerebellar white matter (18.65–21.63 cm3),                      cerebellar white matter (23.5–24.08 cm3), and right cere-
and right cerebellar grey matter (75.92–77.48 cm3).                         bellar grey matter (83.7–85.11 cm3). Fourteen cases with
  There was statistically significant moderate negative                     number of relapses of 3 and 4 showed the following
correlation between neurological disability and volumes                     brain stem and cerebellar volume measurements: me-
of midbrain, pons, medulla oblongata, and the whole                         dulla (3.13–3.39 cm3), pons (11.4–13.34 cm3), midbrain
brain stem. Also, there was statistically significant strong                (5.73–5.59 cm3), whole brain stem (21.46–23.91 cm3),
negative correlation between neurological disability and                    left cerebellar white matter (19.7–23.68 cm3), left cere-
volumes of cerebellar gray and white matter as shown in                     bellar grey matter (77.67–83.82 cm3), right cerebellar
Table 6, Figs. 4, 5, and 6.
  Nine cases with number of relapses (1 and 2) showed
the following brain stem and cerebellar volume

Table 5 Volumetric MRI analysis measurements of cerebellum
in studied subjects (n = 60)
                 Group I (30 cases)       Group II (30 case)   p value
Left-cerebellum-white-matter (cm3)
Mean ± SD        21.75 ± 2.87             22.04 ± 3.27         0.264
Range            (18.86–24.1)             (19.06–25.21)
Left-cerebellum-cortex (grey matter) (cm3)
Mean ± SD        81.64 ± 4.8              92.14 ± 9.83         < 0.001*
Range            (76.33–86.52)            (84.39–102.17)
Right-cerebellum-white-matter (cm3)
Mean ± SD        21.41 ± 2.67             22.32 ± 3.18         0.174
Range            (18.65- 24.08)           (18.55–25.54)
Right-cerebellum-cortex (grey matter) (cm3)
Mean ± SD        80.37 ± 4.68             91.97 ± 8.38         < 0.001*
Range            (75.92–85.11)            (84.36–101.87)
                                                                              Fig. 3 ROC curve of prediction of cerebellar white matter volume
Data are expressed as mean ± SD, p probability                                loss in RRMS cases
*Statistically significant (p < 0.05)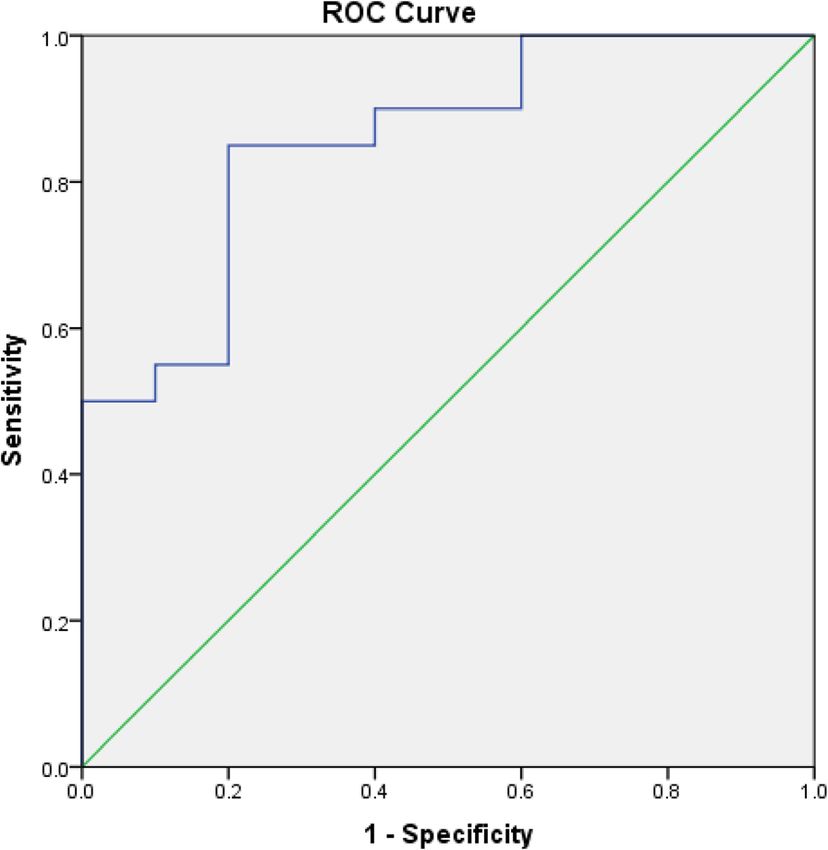
Elzayady et al. Egyptian Journal of Radiology and Nuclear Medicine       (2021) 52:11                                                   Page 6 of 9

Table 6 Correlation between EDSS score and different brain
stem, cerebellum volumetric MRI measurements
EDSS
Variable                                          R           p
Medulla (cm3)                                     − 0.376     0.031*
Pons (cm3)                                        − 0.408     0.005*
Midbrain (cm3)                                    − 0.194     0.187
Whole brain stem (cm3)                            − 0.459     < 0.001*
Left-cerebellum-white-matter (cm )      3
                                                  − 0.215     0.089
Left-cerebellum-cortex(grey matter) (cm3)         − 0.712     < 0.001*
Right-cerebellum-white-matter (cm )         3
                                                  − 0.254     0.067
Right-cerebellum-cortex (grey matter) (cm3)       − 0.644     < 0.001*
r Spearman’s correlation
*Statistically significant (p < 0.05)

white matter (21.37–23 cm3), and right cerebellar grey
matter (76.5–83.73 cm3). Seven cases with number of re-
lapses of 5 to 7 showed the following brain stem and
cerebellar volume measurements: medulla (3.09–3.12
cm3), pons (11.42–12.26 cm3), midbrain (4.7–4.93 cm3),
whole brain stem (19.11–21.1 cm3), left cerebellar white
matter (18.86–19.73 cm3), left cerebellar grey matter
(76.3–78.9 cm3), right cerebellar white matter (18.65–21.83
cm3), and right cerebellar grey matter (75.92–77.79 cm3).
  There was negative correlation between number of re-
lapses and volumes of medulla, pons, midbrain, and
whole brain stem. All these correlations were statistically
significant except the midbrain. Also, there was statisti-                   Fig. 4 A 29-year-old male patient with RRMS, EDSS score of 2, and
cally significant strong negative correlation between                        a relapse rate of 2, complaining of sensory and pyramidal
number of relapses and volume of cerebellar gray and                         dysfunction. Axial and sagittal Flair sequences (a–c) showed multiple
white matter as shown in Table 7, Figs. 4, 5, and 6.                         plaques of high SI seen at both parietal lobes; in periventricular
                                                                             white matter, pericallosal areas and centeum semiovale. The
                                                                             periventricular plaques are perpendicular to the ventricle giving
Discussion                                                                   Dawson’s finger appearance. 3D T1WI in sagittal view (d, e) for brain
Multiple sclerosis (MS) is an idiopathic demyelinating                       stem segmentation and in coronal view (f, g) for cerebellar white
chronic disabling CNS illness common in young adults.                        and grey matter segmentation; (d, f) raw unprocessed T1W image,
MRI is a highly sensitive modality to detect lesions [12].                   (e, g) 3D T1 image after processing with 3D Slicer with colored
                                                                             segmented brain stem and cerebellum. The brain stem and
  Using EDSS score alone as an outcome measure had
                                                                             cerebellar segmentation results showed the following data: midbrain
several limitations, it is based on neurological examin-                     5.82 (N 5.24–6.33 cm3), pons 12.83 (N 12.66–16.51 cm3), medulla 3.87
ation, which is inherently subjective. Also, the clinical                    (N 4.25–5.12 cm3), whole brain stem 22.52 (N 22.46–28.10 cm3), left
state of the patient does not reflect the true activity of                   cerebellar white matter 23.47 (N 19.06–25.21 cm3), left cerebellar
MS in the CNS. Hence, an objective method is preferred                       grey matter 83.94 (N 84.39–102.17 cm3), right cerebellar white
                                                                             matter 22.82 (N 18.55–25.54 cm3), and right cerebellar grey matter
by most practitioners [13].
                                                                             83.16 (N 84.36–101.87 cm3). Patient with EDSS score of 2 and a
  Brain atrophy and lesion load on MRI are important                         relapse rate of 2 had a moderate decrease in the volumes of the
biomarkers and associated with long-term disabilities                        medulla and cerebellar grey matter bilaterally
[14]. Brain volume loss in MS patients occurs at a faster
rate than in the healthy population: 0.5–1.0% vs. 0.1–0.3%
per year. The exact mechanism of brain atrophy in MS is                      MS is the most common cause of non-traumatic
not clear, it may related to myelin and axonal loss [15].                  disability in young adults typically begins at the ages of
  Loss of medulla oblongata volume is associated with                      20–40 years. Also, women are affected approximately
spinal cord damage and disability in a cohort of MS                        twice as often as men [17]. We reported in current study
patients with a mean disease duration of 7.1 years, sup-                   predominant female affection (60% in the cases group
porting that medulla atrophy is an important pathology                     and 63.3% in the control group) with a mean age of 30.93
in MS [16].                                                                years in cases group and 31.13 ± 3.62 years in control group.
Elzayady et al. Egyptian Journal of Radiology and Nuclear Medicine (2021) 52:11 Page 7 of 9
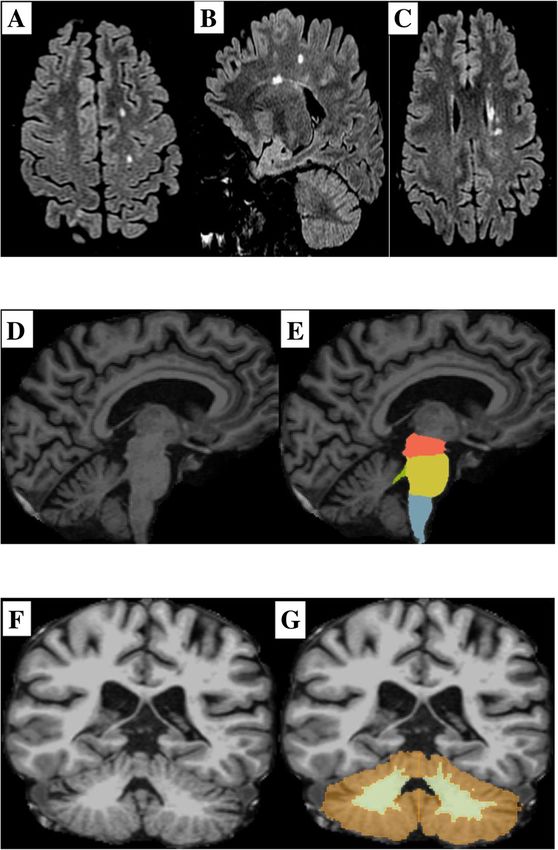
Fig. 5 A 25-year-old female patient aged 25 years old with RRMS,
EDSS score of 0.5, and a relapse rate of 1, complaining of pyramidal Fig. 6 A 35-year-old female patient with RRMS, EDSS score of 4, and a
dysfunction. Axial and sagittal Flair sequences (a–c) showed multiple relapse rate of 6, complaining of visual problems, cerebellar
plaques of high SI seen at both parietal lobes; in periventricular dysfunction, bowel, and bladder dysfunction. Axial and sagittal Flair
white matter, pericallosal areas right deep white matter (basal sequences (a–c) showed multiple plaques of high SI at both parietal
ganglia). 3D T1W images in sagittal view (d, e) for brain stem lobes; in periventricular white matter, pericallosal and callosomarginal
segmentation and in coronal view (f, g) for cerebellar grey and areas, juxtacortical junction, and centeum semiovale. The
white matter segmentation; (d, f) raw unprocessed T1W image, (e, periventricular plaques are perpendicular to the ventricle giving
g) 3D T1image after processing with 3D Slicer with colored Dawson’s finger appearance. 3D T1W images in sagittal view (d, e) for
segmented brain stem and cerebellum structures. The brain stem brain stem segmentation and in coronal view (f, g) for cerebellar grey
and cerebellum segmentation results showed the following data: and white matter segmentation; (d, f) raw unprocessed T1W image, (e,
midbrain 5.9 (N 5.24–6.33 cm3), pons 13.85 (N 12.66–16.51 cm3), g) 3D T1image after processing with 3D Slicer with colored segmented
medulla 3.63 (N 4.25–5.12 cm3), whole brain stem was 23.38 (N brain stem and cerebellum structures. The brain stem and cerebellum
22.46–28.10 cm3), left cerebellar white matter 24 (N 19.06–25.21 segmentation results showed the following data: midbrain 5.02 (N
cm3), left cerebellar grey matter 84.59 (N 84.39–102.17 cm3), right 5.24–6.33 cm3), pons 11.7 (N 12.66–16.51 cm3), medulla 3.1 (N 4.25–
cerebellar white matter 23.7 (N 18.55–25.54 cm3), and right 5.12 cm3), whole brain stem 19.82 (N 22.46–28.10 cm3), left cerebellar
cerebellar grey matter 84.5 (N 84.36–101.87 cm3). Patient with EDSS white matter 19.42 (N 19.06–25.21 cm3), left cerebellar grey matter
score of 0.5 and a relapse rate of 1 had a mild decrease in the 76.57 (N 84.39–102.17 cm3), right cerebellar white matter 20.61 (N
volume of the medulla oblongata only 18.55–25.54 cm3), and right cerebellar grey matter 76.07 (N 84.36–
101.87 cm3). Patient with EDSS score of 4 and a relapse rate of 6 had a
minimal decrease in the volume of the midbrain, severe decrease in
In the current study, volumes of the whole brainstem, the volumes of the pons, medulla, whole brain stem, and cerebellar
medulla, and pons showed a significant decrease in MS grey matter bilaterally
cases compared to control cases (p < 0.05). Brainstem
volume had a mean volume of 22.17 and 25.09 cm3 in
cases and control cases, respectively. However, midbrain et al. [14] reported as regards medulla oblongata volume,
volume was not significantly different between cases and there was no significant difference between cases and
controls (p = 0.134). controls (4.33 in MS vs. 4.35 cm3 in controls—p > 0.05).
Daams et al. [18] reported a 5.2% normalized brain There was a significant decrease in the size of pons and
volume reduction in MS patients compared to healthy midbrain volumes in MS cases compared to controls (p
controls. Normalized brainstem volume was significantly < 0.05). The normalized volumes of whole brainstem
decreased in MS cases (27.71 ml) compared to control were significantly reduced in MS subjects compared to
cases (29.6 ml). In contrast to the present study, Lee controls. Midbrain had mean sizes of 5.5–6 cm3,Elzayady et al. Egyptian Journal of Radiology and Nuclear Medicine (2021) 52:11 Page 8 of 9
Table 7 Correlation between number of relapses and different volume showed a moderate to strong positive correlation
brain stem, cerebellum volumetric MRI measurements with normalized supratentorial brain volume (p = 0.027).
Number of relapses In the present study, EDSS score and number of relapses
Variable R p showed a significant negative correlation with medulla,
Medulla (cm3) − 0.402 0.009* pons, whole brain stem volumes, in addition to both
Pons (cm3) − 0.475 0.001*
right and left cerebellar cortical volumes (p < 0.05) and
could be used a predictor for disease severity in such
Midbrain (cm3) − 0.213 0.132
cases.
Whole brain stem (cm3) − 0.657 < 0.001* Our study had several limitations; small sample size,
Left-cerebellum-white-matter (cm ) 3
− 0.187 0.324 study design, and imaging protocol did not include mean
Left-cerebellum- grey matter (cm3) − 0.661 < 0.001* upper cervical cord area measurement, which has been
Right-cerebellum-white-matter (cm ) 3
− 0.303 0.102 reported to be an important predictor of motor dysfunc-
Right-cerebellum-grey matter (cm3) − 0.655 < 0.001*
tion and disability in MS subjects. Moreover, the effect
of treatment on brainstem and cerebellar volumes
r Spearman’s correlation
*Statistically significant (p < 0.05) should have been assessed. Therefore, more studies
handling the previous parameters should be conducted
whereas pons had mean sizes of 13.22–14.05 cm3 in MS in the near future.
cases and controls, respectively.
In the present study, volume of left cerebellar hemi- Conclusion
sphere cortex showed a significant decrease in MS cases Volumetric MR imaging is an important tool for quanti-
compared to controls (p < 0.001). It had mean volumes fying the MS disease, assess MS activity, progression,
of 81.64 and 92.14 cm3 in cases and controls, respect- and tissue loss. The degree and the pattern of atrophy
ively, while right cerebellar hemisphere cortex volumes on MRI images correlate significantly with the neuro-
were 80.37 and 91.97 cm3 in cases and controls, respect- logical disability score and number of relapses.
ively. On the contrary, cerebellar white matter showed
no significant volume decrease in cases and controls. Abbreviations
1H-MR: Proton MR; 3D: Three dimensions; AUC: Area under the curve;
These results agreed with Anderson et al. [19], and
CNS: Central nervous system; DTI: Diffusion tensor imaging; EDSS: Expanded
they reported that volume of cerebellar white matter not disability status scale; GM: Grey matter; MRI: Magnetic resonance imaging;
statistically different between MS cases and controls MS: Multiple sclerosis; MTI: Magnetization transfer imaging; NPC: Negative
predictive value; PPV: Positive predictive value; PURE: Phased array uniformity
(20.8 cm3 in RRMS, 18.9 cm3 in PPMS, and 20.4 cm3 in
enhancement; REC: Approval of research ethics committee; RRMS: Relapsing
controls). However, PPMS had lower cerebellar grey remission relapse; SCIC: Surface coil intensity correction; SPGR: Sagittal 3D T1-
matter volumes (93.3 cm3) compared to RRMS (97.2 weighted spoiled gradient; WM: White matter
cm3), and healthy controls (97.5 cm3).
Acknowledgements
In contrast to current study, Ge Y et al. [20] reported The authors acknowledge all the participants for their cooperation and
a significant loss of cerebellar white matter rather than patience.
gray matter in the early stage of MS which might indi-
cate a different mechanism of atrophy in MS versus Authors’ contributions
MD suggested the research idea, ensured the original figures and data in the
other neurodegenerative diseases. Lee et al. [14] reported work, minimized the obstacles to the team of work, correlated the study
that there was no significant difference in normalized concept and design and had the major role in analysis, ME collected data in
cerebellar volume between MS cases and controls (0.119 all stages of manuscript, performed data analysis. ND supervised the study
with significant contribution to design the methodology, manuscript
vs. 0.117 in MS and controls, respectively—p > 0.05). revision, and preparation. MK correlated the clinical data of patient and
Unfortunately, they did not assess both white and grey matched it with the findings, drafted and revised the work. All authors read
matter volumes separately. and approved the final manuscript for submission.
As regarding brain stem volume, we reported MRI sen-
Funding
sitivity and specificity of 84 and 86%, respectively, with an No funding. Not applicable for this section.
accuracy of 82% by using a cut-off value of 23.25 cm3.
Also using a cut-off value of 83.46 cm3 for cerebellar grey Availability of data and materials
matter, MRI had sensitivity and specificity of 87.8 and The authors confirm that all data supporting the finding of the study are
available within the article, and the raw data and data supporting the
95.7%, respectively, with an accuracy of 95.2%. findings were generated and available at the corresponding author on
Daams et al. [18] reported a significant negative correl- request.
ation between EDSS score and normalized brainstem
volume (r = − 0.293—p < 0.001). Also, between EDSS Ethics approval and consent to participate
Informed written consents taken from the patients and healthy volunteers,
score and normalized cerebellar volume (r = − 0.242—p the study was approved by ethical committee of Tanta University Hospital,
< 0.01). Lee et al. [14] reported normalized brainstem Faculty of Medicine. Committee’s reference number: 31619/06/17.Elzayady et al. Egyptian Journal of Radiology and Nuclear Medicine (2021) 52:11 Page 9 of 9
Consent for publication diffusion tractography and volumetric analysis. Multiple Sclerosis J 17(9):
All participants included in the research gave written consent to publish the 1079–1087
data included in the study. 20. Ge Y, Grossman RI, Udupa JK et al (2001) Brain atrophy in relapsing-
remitting multiple sclerosis: fractional volumetric analysis of gray matter and
white matter. J Radiol 220(3):606–610
Competing interests
The authors declare that they have no competing of interests.
Publisher’s Note
Author details Springer Nature remains neutral with regard to jurisdictional claims in
1 published maps and institutional affiliations.
Samanoud Central Hospital, Samanoud, Gharbya Governorate, Egypt.
2
El-Geish Street, Tanta, Gharbya Governorate, Egypt. 3Faculty of Medicine,
Tanta University, El-Geish Street, Tanta, Gharbya Governorate, Egypt.
Received: 11 November 2020 Accepted: 14 December 2020
References
1. Tomos C, Cris C, Christopher T (2015) MRI-based measurement of brain
stem cross-sectional area in relapsing-remitting Multiple Sclerosis. J
Neuroimaging 25:1002–1006
2. Quarantelli M, Ciarmiello A, Morra VB et al (2003) Brain tissue volume
changes in relapsing–remitting multiple sclerosis: correlation with lesion
load. J Neuroimage 18(2):360–366
3. Dalton CM, Chard DT, Davies GR et al (2004) Early development of multiple
sclerosis is associated with progressive grey matter atrophy in patients
presenting with clinically isolated syndromes. Brain J 127(Pt 5):1101–1107
4. Paz Soldán MM, Raman MR, Gamez JD et al (2015) Correlation of brain
atrophy, disability and spinal cord atrophy in a Murine Model of Multiple
Sclerosis. J Neuroimaging 25(4):595–599
5. Miller DH, Barkhof F, Frank JA et al (2002) Measurement of atrophy in
multiple sclerosis: pathological basis, methodological aspects and clinical
relevance. Brain J 125:1676–1695
6. Magnano I, Pes GM, Pilurzi G et al (2014) Exploring brainstem function in
multiple sclerosis by combining brain stem reflexes, evoked potentials,
clinical and MRI investigations. Clin Neurophysiology J 125:2286–2296
7. Weier K, Banwell B, Cerasa A et al (2015) The role of the cerebellum in
Multiple Sclerosis. The Cerebellum J 14(3):364–374
8. Eriksson M, Andersen O, Runmarker B (2003) Long-term follow up of
patients with clinically isolated syndromes, relapsing–remitting and
secondary progressive multiple sclerosis. Multiple Sclerosis J 9(3):260–274
9. Sastre-Garriga J, Pareto D, Rovira A (2017) Brain atrophy in multiple sclerosis
clinical relevance and technical aspects. Neuroimaging Clin N Am J 27(2):
289–300
10. Ge Y (2006) Multiple sclerosis: the role of MR imaging. Am J Neuroradiol
27(6):1165–1176
11. Fedorov A, Beichel R, Kalpathy-Cramer J et al (2012) 3D Slicer as an image
computing platform for the quantitative imaging network. J Magnetic
Resonance Imaging 30(9):1323–1341
12. Habek M (2013) Evaluation of brainstem involvement in multiple sclerosis.
Expert review of neurotherapeutics 13(3):299–311
13. Filippi M (2015) MRI measures of neurodegeneration in multiple sclerosis:
implications for disability, disease monitoring, and treatment. J Neurol
262(1):1–6
14. Lee C, Mak HK, Chiu P et al (2018) Differential brainstem atrophy patterns in
multiple sclerosis and neuromyelitis optica spectrum disorders. J Magnetic
Resonance Imaging 47(6):1601–1169
15. Marciniewicz E, Pokryszko-Dragan A, Podgórski P et al (2019) Quantitative
magnetic resonance assessment of brain atrophy related to selected
aspects of disability in patients with multiple sclerosis: preliminary results.
Polish J Radiol 84:171–178
16. Liptak Z, Berger A, Sampat M et al (2008) Medulla oblongata volume: a
biomarker of spinal cord damage and disability in multiple sclerosis. Am J
Neuroradiol 29(8):1465–1470
17. Tullman MJ (2013) Overview of the epidemiology, diagnosis, and disease
progression associated with multiple sclerosis. Am J Managed Care 19(2
Suppl):15–20
18. Daams M, Steenwijk MD, Wattjes MP et al (2015) Unraveling the
neuroimaging predictors for motor dysfunction in long-standing multiple
sclerosis. Neurology J 85(3):248–255
19. Anderson V, Wheeler-Kingshott C, Abdel-Aziz K et al (2011) A
comprehensive assessment of cerebellar damage in multiple sclerosis usingYou can also read