LEADING THE WAY FORWARD - Results for the year ended 30 June 2019 - Seven Group Holdings ...
←
→
Page content transcription
If your browser does not render page correctly, please read the page content below
LEADING THE WAY
FORWARD
Results for the year ended 30 June 2019

21 August 2019
Full Year Results Presentation
                                      Seven Group Holdings   2
21 August 2019

GROUP
OVERVIEW

Our objective is to grow
shareholder returns by ensuring our
businesses continue to perform and
deliver market-leading positions
Full Year Results Presentation
                                                                                                                                                  Seven Group Holdings   3
21 August 2019

GROUP OVERVIEW BUSINESSES AND MARKETS
                                                                                                                         Mining production

  Industrial                      Industrial                  Energy                        Media                        • We provide equipment solutions to the world’s
  services                        services                                                  investments                    largest miners, supporting record production
                                                                                                                           volumes and driving efficiency
                                                                                                                         Infrastructure investment
                                                                                                                         • We are the largest national equipment hire
                                                                                                                           business, providing solutions to major
                                                                                                                           infrastructure and construction customers with
  WesTrac (100% owned) is         Coates Hire (100% owned)    Beach Energy (28.6%           Seven West Media (41%
  one of the largest CAT                                      owned) is a leading mid-cap   owned) is a leading
                                                                                                                           a strong pipeline of committed government
                                  is the largest nationwide
  dealers globally (by sales)     industrial and general      E&P business and a key        diversified media company      projects
  and supports customers in       equipment hire company      supplier to a growing East    in Australia with 2,800
  Australia’s rich iron ore and                               Coast market                  employees                    East coast gas
  thermal coal regions
                                                              SGH Energy (100% owned)       Audience of 18.9 million     • Beach and SGH Energy are well positioned to
                                                              holds operated and non-       Australians engaged
  23 branches and 3,300           Over 160 branches and                                                                    meet growing East Coast gas demand and
                                                              operated oil and gas          monthly
  employees                       2,300 employees
                                                              interests including 15% of                                   domestic LNG export opportunity
                                                              the Crux LNG Project

  Key customers: BHP,             Key customers: BMD,         Key customers: Alinta, AGL,   Other media investments      Diversified investments
                                                                                            include interests in China
  CIMIC, FMG, Macmahon,           CIMIC, Downer, FMG,
                                  Lend Lease, John Holland
                                                              Adelaide Brighton, Origin
                                                              Energy                        P/E funds
                                                                                                                         • Strong balance sheet to pursues growth
  Min Res, Rio Tinto, Roy Hill
                                                                                                                           opportunities within or adjacent to our existing
                                                                                                                           core businesses
  Trading revenue                 Trading revenue             Segment Underlying EBIT       Segment Underlying EBIT

  $  3.0b                         $1.0b                       $157m $66m
  Asset value                     Asset value                 Segment assets                Segment assets

  $  1.9b                         $ 2.2b                      $  1.2b                       $ 0.5b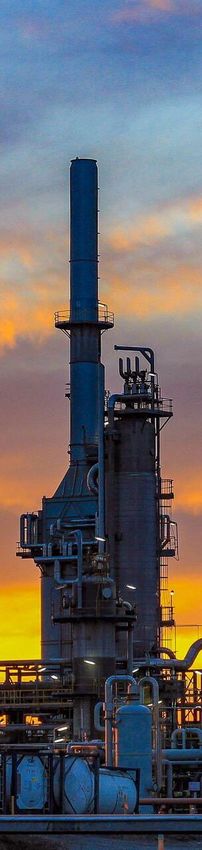
Full Year Results Presentation
                                                                                                                                                Seven Group Holdings             4
21 August 2019

GROUP OVERVIEW PEOPLE, SAFETY AND CULTURE

Our people are our greatest asset and keeping them safe is
                                                                                                                             LTIFR                                TRIFR
our top priority
• Expanded our safety commitment through leadership programs                                                            FY19              FY18              FY19               FY18
   – WesTrac’s “Built By Us” program is designed to drive a
                                                                            WesTrac WA                                     1.2               2.5                8.3            12.8
     transformational shift in safety culture and behaviour along with
     staff engagement
                                                                            WesTrac NSW                                    1.0               0.4              10.2              4.8
   – Objective is to create a safer, enjoyable and more productive
     workplace                                                              Coates Hire                                    1.6               2.3              12.8             21.5

• Improvements achieved in safety performance within most
                                                                            AllightSykes                                   0.0               0.0                4.9             7.7
  businesses
                                                                            SGH Energy                                     0.0               0.0                0.0             0.0
Range of people and culture initiatives underway
                                                                            Group Total                                    1.3               1.4              10.4             14.0
• Apprenticeship program launched by Coates Hire while WesTrac’s
  program has expanded in recent years with targets set for gender
                                                                          – Lost time injury frequency rate (LTIFR) = number of lost time injuries per million hours worked;
  diversity and indigenous intake                                         – Total recordable injury frequency rate (TRIFR) = number of recordable injuries per million hours worked;

• Executed “train to task” across six key operational teams in WesTrac,
  aimed at redirecting our trained technicians to higher skilled tasks
• “Competent Person Program” being rolled out in Coates Hire,
  delivering career development for staff and savings to the business
• Good leadership supported by people and culture initiatives has led
  to over 10% improvement in engagement results across all our
  businesses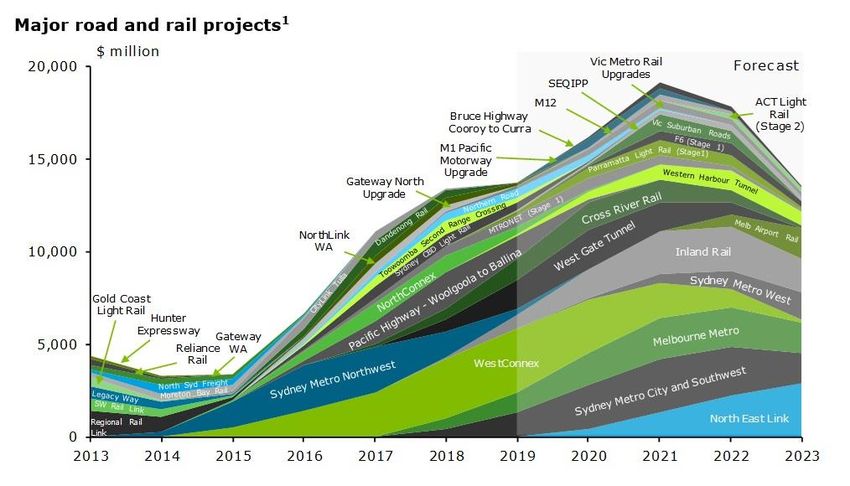
Full Year Results Presentation
                                                                         Seven Group Holdings   5
21 August 2019

GROUP OVERVIEW HIGHLIGHTS

Strong financial results with EBIT up 40% to $695m
• Trading revenue of $4.1bn up 27% with growth across all businesses
• EBIT up $198m on pcp delivered through WesTrac ($83m),
  Coates Hire ($54m) and Beach Energy ($85m)
• Continued operating discipline reflected in underlying margin
  improvement of 1.5% at EBIT level and 1.7% at NPAT level
• Improved operating cash flow despite investment in future growth
  through working capital

Unique position in all our key markets to drive growth
• Industrial services EBIT growth of 40% reflecting strength of end
  markets in mining and infrastructure
   – WesTrac part lines invoiced were up 11% to 6.4m driven by the
     record level of mining production and export volumes
   – Coates Hire asset utilisation remains 1.2% higher than average
     over previous five years despite slower construction market and
     project delays

Energy investments creating value
• Beach delivered record production and earnings result, enabling
  reinvestment from strong cash flow and $172m net cash
• Crux FEED more 50% complete, FID targeted for Q2 2020, and
  interest in project growing from a range of LNG buyers and investors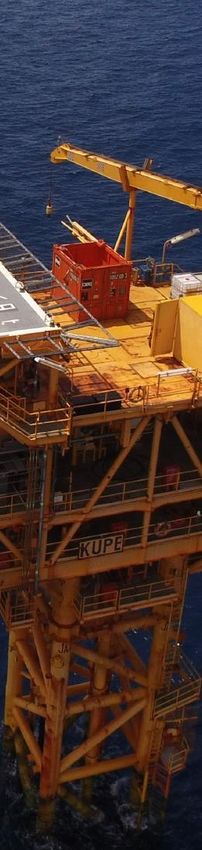
Full Year Results Presentation
                                                                                                            Seven Group Holdings   6
21 August 2019

GROUP OVERVIEW KEY FINANCIALS

 Underlying Results ($m) – continuing operations                                        FY19        FY18             % Change

 Trading revenue                                                                      4,084.0     3,207.9                  27%

 Earnings before interest and tax1                                                     695.1       496.9                   40%

 Underlying net profit after tax1                                                      478.9       321.9                   49%

 Underlying earnings per share1                                                     143 cents    97 cents                  47%

 Underlying EBITDA cash conversion1,2                                                   59%         54%                      5%

 Statutory results ($m) – continuing operations                                         FY19        FY18             % Change

 Trading revenue                                                                      4,084.0     3,207.9                  27%

 Earnings before interest and tax                                                      436.1       570.4                  (24)%

 Net profit after tax attributable to shareholders                                     219.2       405.2                  (46)%

 Earnings per share                                                                  65 cents   124 cents                 (48)%

 Final fully franked ordinary dividend                                               21 cents    21 cents

Notes:
1. Excluding significant items. Refer to slide 9 for listing of significant items
2. Refer to slide 11 for EBITDA cash flow conversion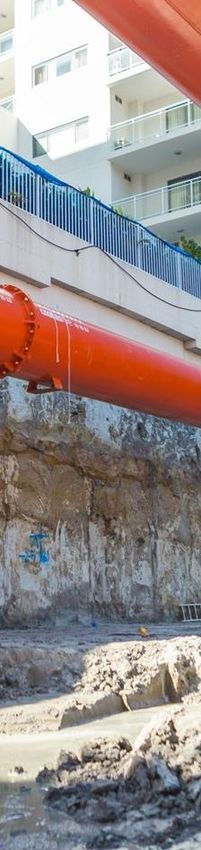
Full Year Results Presentation
                                          Seven Group Holdings   7
21 August 2019

GROUP
FINANCIALS

Our financial results reflect the level
of operating performance achieved
and our continued focus on driving
efficiencies and cash flow
Full Year Results Presentation
                                                                                         Seven Group Holdings   8
21 August 2019

FINANCIALS PROFIT AND LOSS

 $m                                                                 FY19        FY18              Change %

 Revenue                                                          4,084.0     3,207.9                   27%

 Other income                                                        53.5        65.1                 (18)%

 Share of results from equity accounted investees                   210.2       144.1                   46%

 Trading revenue and other income                                 4,347.7     3,417.1                   27%

 Expenses (excluding. depreciation, amortisation and interest)   (3,452.5)   (2,774.4)                  24%

 Underlying EBITDA                                                  895.2       642.7                   39%

 Depreciation and amortisation                                    (200.1)     (145.8)                   37%

 Underlying EBIT                                                    695.1       496.9                   40%

 Net finance costs                                                (102.8)     (101.7)                    1%

 Underlying net profit before tax                                   592.3       395.2                   50%

 Underlying tax expense                                           (113.4)       (73.3)                  55%

 Underlying NPAT from continuing operations                         478.9       321.9                   49%

 NPAT from discontinued operations                                       -       10.4                       -

 Significant items (including tax impact)                         (259.7)        83.3                       -

 Underlying NPAT from continuing operations                         219.2       415.6                 (47)%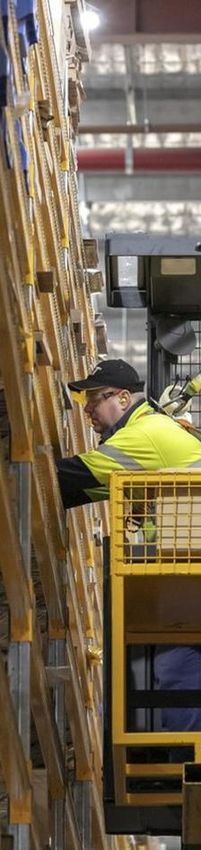
Full Year Results Presentation
                                                                    Seven Group Holdings   9
21 August 2019

FINANCIALS SIGNIFICANT ITEMS

 $m                                                        FY19                    FY18

 Share of equity accounted investees' significant items   (230.4)                 (17.4)

 (Impairment) / impairment reversal – SWM equity           (57.5)                   28.6

 Other items                                                28.9                    62.3

 Significant Items – EBIT                                 (259.0)                   73.5

 Net finance income                                         (1.0)                      -

 Tax benefit relating to significant items                   0.3                     9.8

 Significant Items – NPAT                                 (259.7)                   83.3

 Statutory NPAT                                            219.2                  405.2

 NPAT excluding significant items                          478.9                  321.9
Full Year Results Presentation
                                                                                                                                   Seven Group Holdings     10
21 August 2019

FINANCIALS EARNINGS SUMMARY

                                                          Total               Coates       Allight                                Invest-
 $m                                                                WesTrac                               Energy       Media                     Other
                                                         Group                 Hire        Sykes                                  ments

 Trading revenue                                         4,084.0    3,041.3     956.5          77.6          6.5              -        2.1              -

 Statutory EBIT                                           436.1       285.6     183.6           1.3        159.2      (224.6)         21.4          9.6

 Add unfavourable significant items

 Impairment – SWM equity                                   57.5           -            -             -            -      57.5               -           -

 Share of equity accounted investees significant items    233.0           -            -             -            -     233.0               -           -

 Subtract favourable significant items

 Gain on conversion of convertible notes                  (28.9)          -            -             -            -           -             -    (28.9)

 Share of equity accounted investees significant items     (2.6)          -            -             -      (2.6)             -             -           -

 Total significant items – EBIT                           259.0           -            -                    (2.6)       290.5               -    (28.9)

 Underlying EBIT – FY19                                   695.1       285.6     183.6           1.3        156.6         65.9         21.4       (19.3)

 Underlying EBIT – FY18                                   496.9       202.7     129.4           3.0         71.8         72.6         33.1       (15.7)

 Year-on-year change                                       40%        41%        42%         (57)%         118%         (9)%        (35)%          23%
Full Year Results Presentation
Seven Group Holdings 11
21 August 2019
FINANCIALS CASH FLOW
$m FY19 FY18
Underlying EBIT 695.1 496.9
Add: depreciation and amortisation 200.1 145.8
Underlying EBITDA 895.2 642.7
Operating cash flow 410.6 253.1
Add: interest and other costs of finance paid 85.6 83.4
Net income taxes paid 28.2 8.3
Add back: restructuring costs - 1.8
• Strong operating cash flow of $411m
Underlying operating cash flow 524.5 346.6 and conversion of ~60%
Underlying EBITDA cash conversion 59% 54% • Operating cash flow includes inventory
Operating cash flow 410.6 253.1
investment of $103m primarily in
WesTrac parts and components to drive
Investing cash flow (188.9) (216.1) FY20-21 growth
Financing cash flow (248.8) (102.1) • Investing cash flow includes: $111m
Net (decrease) / increase in cash and cash equivalents (27.1) (65.0)
Beach investment, $262m in net capex
($194m Coates, $62m WesTrac, $7m
Opening net debt 2,036.1 1,308.1 SGHE), and $184m net investment
Movement in net debt (38.4) 728.0 proceeds including listed portfolio sales
Closing net debt 1,997.6 2,036.1
• Financing cash flow includes $138m
ordinary dividend and $110m in debt
repaid (net)Full Year Results Presentation
Seven Group Holdings 12
21 August 2019
FINANCIALS BALANCE SHEET
As at As at • Additional inventory investment of $103m
$m Change %
mainly in WesTrac including $73m in new
30 Jun 19 30 Jun 18
Trade and other receivables 574.7 585.8 (2)%
machines and $63m in parts to support
future sales, partially offset by reduction
Inventories 931.8 828.6 12% in parts exchange and embedded
Net assets held for sale 2.1 2.4 (14)% maintenance
Investments 1,462.8 1,536.8 (5)%
• PP&E increase of $76m includes 4x 794
electric drive trucks added to rental fleet
Property, plant and equipment 911.9 835.6 9%
• Reduction in provisions by $45m
Oil and natural gas assets 454.2 441.8 3% includes WesTrac reclassification of
Intangible assets 1,624.4 1,617.7 0% service warranties to deferred income in
line with AASB 15 along with reduction in
Other assets 32.1 29.6 9% provisions against specific equipment
Trade and other payables (409.4) (427.7) (4)% warranties and service contracts
Provisions (176.8) (221.7) (20)% • Increase in net tax liabilities includes an
$117m increase in current tax reflecting
Deferred income (130.1) (113.5) 15% the Group’s tax payable position
Net tax assets (liabilities) (379.2) (262.5) 44% • Increase in derivative financial
Derivative financial instruments 110.8 18.5 >100% instruments of $92m includes impact of
$61m reclassification of the convertible
Net debt (1,997.6) (2,036.1) (2)% note embedded derivative liability to
Total shareholders equity 3,011.7 2,835.3 6% equity, with the remaining $31m mainly
relating to FX impact on USPP cross
currency swapFull Year Results Presentation
Seven Group Holdings 13
21 August 2019
FINANCIALS CAPITAL MANAGEMENT
Capital structure optimised and strengthened
• TELYS4 conversion to ordinary shares well supported by all investors
and simplifies the capital structure
• Free float increased from 34% to 39% and new investors introduced
onto register
• Successful track record of capital markets transactions over the past
two years a signal of market confidence
• Funding base diversified and overall funding costs reduced
• Capacity of >$1bn to pursue targeted growth opportunities
Corporate debt refinanced and extended
• Upsized from $900m to $1.3bn in 3 and 5 year tranches
• Reduction in borrowing margin reflects the support from the banking
syndicate and the Group’s strong credit metrics
• Net debt below $2bn and effective net debt below $1.7bn after
adjusting for value of hedges and the listed portfolio
Enhancing shareholder return
• Total shareholder return of 52% per annum over past three years
(ranked second vs ASX100 ex. Financials) Note: adjusted ratio takes into account the value of the listed portfolio and the market
value of Beach in excess of book value
• Final dividend maintained at 21 cents given the opportunities to
reinvest cash flow across our businessesFull Year Results Presentation
Seven Group Holdings 14
21 August 2019
FINANCIALS AASB 16 LEASES
Adoption of AASB 16 Estimated impact as at 1 July 2019 $m
• SGH will adopt AASB 16 under the full retrospective approach with
effect from 1 July 2019, resulting in a material impact on the Balance Sheet
balance sheet, P&L and categorisation of cash flows
Right of Use asset 668.1
• Leases contracts include land and buildings, equipment, motor
vehicles and IT equipment Lease liability (856.4)
Balance sheet impact Retained earnings 188.3
• Right of Use (ROU) asset and lease liability will be recognised at the
commencement of leases greater than 12 months
– ROU asset depreciated over shorter of lease term or useful life Estimated FY20 impact
– Lease liability initially measured at PV of future lease payments EBITDA 102.6
P&L impact Depreciation and amortisation (70.1)
• Operating lease rental payment will be replaced by depreciation of EBIT 32.5
the ROU asset and interest expense on the lease liability
– Estimated increase of $32.5m in FY20 EBIT Interest expense (50.4)
– Estimated decrease of $12.5m in FY20 profit after tax Profit before tax (17.9)
Cash flow impact Net profit after tax (12.5)
• Reported operating cash flow will increase due to portion of lease
payment recognised as financing rather than operating cash flowsFull Year Results Presentation
Seven Group Holdings 15
21 August 2019
BUSINESS REVIEW
WESTRAC
Leader in helping customers to
drive efficiency by partnering on
product support and technology
solutionsFull Year Results Presentation
Seven Group Holdings 16
21 August 2019
INDUSTRIAL SERVICES WESTRAC HIGHLIGHTS
Growing demand for support through parts and rebuilds
• Record 6.4m parts lines invoiced in WA and NSW as parts demand is
driven by equipment life extension and ageing fleet
• Miners are capturing efficiency gains with WesTrac support such as
new installed and retro-fitted autonomous technology
• Assets being run hard by customers with average age now >10 years
Major project commencements
• FMG’s Eliwana and Iron Bridge projects along with Glencore’s United
Wambo project provide a pipeline of opportunity
• Working with Rio Tinto on Koodaideri “Mine of the Future” to supply
fleet of autonomous 793F trucks and ancillary equipment
– WesTrac responsible for all technology installation and Parts lines invoiced (#m)
commissioning
– Demonstrates CAT’s superior technology roadmap
Ability to deliver valued customer solutions and support
• High velocity of parts delivery enabled through facility investments
• High quality of component rebuilds and other collaboration with
customers to extend product lives; component rebuilds up 38% YoY
• Committed sales up compared to same time last year and order book
for FY21 and FY22 strengtheningFull Year Results Presentation
Seven Group Holdings 17
21 August 2019
INDUSTRIAL SERVICES WESTRAC FINANCIALS
Rise in equipment sales to completement parts growth
• Revenue up 24% with strength across all categories
– Product support revenue up $344m or 19%, driven by 11%
increase in parts lines invoiced
– Product sales revenue up $245m or 38% including new
equipment sales growth of 60% in mining and 34% in construction
in FY19
• EBIT growth of 41% on pcp delivering an additional $83m in FY19
Further margin improvement
• EBIT margin improved by 1.1% to 9.4% reflecting the operating
leverage being unlocked across the business
Reinvestment in the business
• Investment in inventory particularly in the last quarter to support the
future sales opportunity
• Upcoming investment in South Guildford site to expand capacity
Capital replacement cycle
• Demand for new machines strengthening off a low base compared to
historic levelsFull Year Results Presentation
Seven Group Holdings 18
21 August 2019
BUSINESS REVIEW
COATES HIRE
A key supplier of equipment to
infrastructure and non-residential
construction markets with a strong
pipeline of projects aheadFull Year Results Presentation
Seven Group Holdings 19
21 August 2019
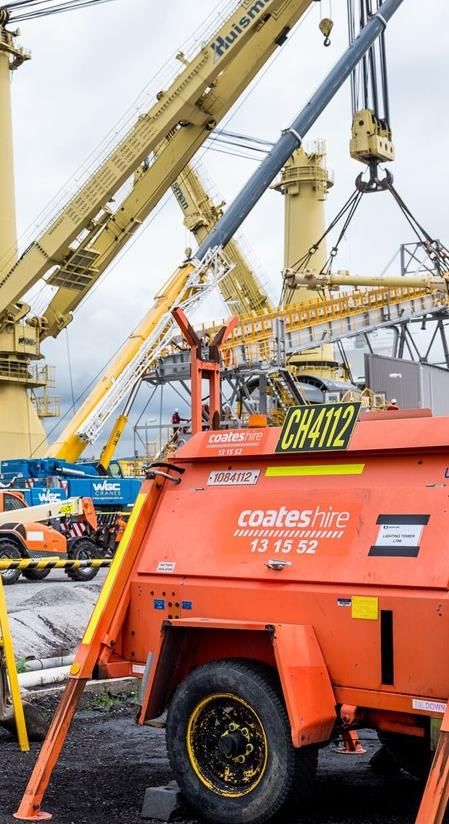
INDUSTRIAL SERVICES COATES HIRE
Solid performance in a competitive market
• NSW and VIC/SA businesses are delivering robust performance
while WA market growth has accelerated
– Manageable exposure to residential construction given
diversification across multiple sectors
– New projects emerging in NSW as pipeline of work grows
– WA growth providing opportunities in that market
– Overall results impacted by substantial weakness in QLD,
however long-term outlook for the state is positive reflecting a
need for infrastructure investment
• Coates remains well positioned relative to competitors in the current
market environment which is expected to remain competitive over
the next 12 months despite strong five-year outlook
Fleet optimisation and customer value proposition
• Optimising fleet composition for current and future opportunities to
grow or take market share in certain product categories
• Lowering average fleet age to meet customer requirements
• Focus on improving customer experience in each market segment
• Looking to optimise business to deliver low cost to serve
Source: Deloitte Access EconomicsFull Year Results Presentation
Seven Group Holdings 20
21 August 2019
INDUSTRIAL SERVICES COATES HIRE
Stable revenue impacted by QLD weakness
• Revenue down 2% given QLD impacted by project delays and
benefit of Commonwealth Games in prior year
• Time utilisation down to 55% but remains above five year average
• EBIT growth of 7% to $184m underlining a solid operational result
• EBIT margin improvement by 1.6% to 19.2% reflecting the ongoing
focus to drive the return from existing assets and discipline on return
on capital through the cycle
Strategic initiatives making an impact
• Branch reorganisations underway focusing on more efficient ways to
complete repetitive tasks
• Ongoing focus on equipment turnaround times and reducing redline
• Digital capability continues to improve with planned rollout in FY20 of
online hiring and real-time pricing and availability data via website
Reinvesting in new fleet and expanding services team
• Invested $194 million (net) in new fleet, lowering fleet age
• Confidence in level of infrastructure growth over the next five years
• Growing our specialist services team offering competitive customer Notes: Coates Hire FY18 result shown on pro-forma 100% consolidated basis
solutions such as propping, shoring and dewateringFull Year Results Presentation
Seven Group Holdings 21
21 August 2019
BUSINESS REVIEW
ENERGY
Portfolio of opportunities within
Beach Energy and SGH Energy
aimed at meeting the East Coast
gas demand and new domestic
LNG export opportunitiesFull Year Results Presentation
Seven Group Holdings 22
21 August 2019
ENERGY BEACH ENERGY
Record production and delivering as a low cost operator
• Record full year production of 29.4 MMboe, up 55% on previous year
• Operating costs reduced 4% in FY19, currently $9.3/Boe in 2H FY19
• High facility reliability and strong customer demand in key regions
• Free cash flow of $559m for the year, resulting in a net cash position
two years ahead of target
Investing to accelerate production and free cash flow growth
• Participation in 134 wells in FY19, up 40% with success rate of 84%
• Reserves replacement ratio of 204% in FY19
• Otway sell down completed, delivering $262m in sale proceeds and
diversity in capital investment
• FID taken on Waitsia Stage 1 expansion to 20 TJ/day and gas sales
agreement signed with Alinta commencing 2020 for 4.5 years
• Otway development drilling underway
Outlook for FY20
• Production guidance of 27 to 29 MMBoe and capital expenditure
guidance of $750m to $850m to drive growth in reserves and
production in Cooper / Otway / Perth basins
• EBITDA guidance of $1.25bn to $1.4bn and DD&A of $17-18/BoeFull Year Results Presentation
Seven Group Holdings 23
21 August 2019
ENERGY SGH ENERGY
Crux – strongly positioned to deliver returns $m FY19 FY18
• Crux forms an important part of Shell Australia’s gas portfolio
Sale of oil, gas and condensate 6.5 5.9
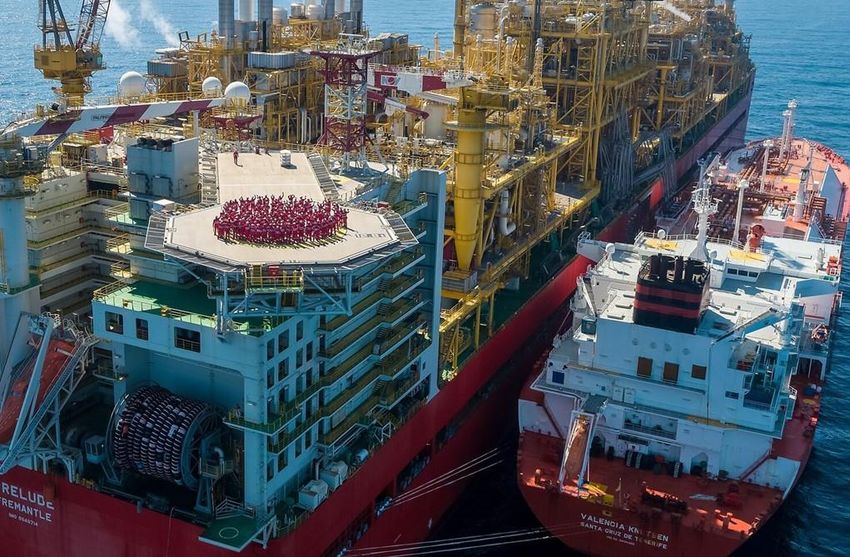
– Identified as primary source of backfill gas to Prelude FLNG
– Prelude now in production with first LNG cargo shipped in Jun ‘19 Other income - 0.7
• FEED process commenced Jan 2019; now more than 50% complete Beach share of associate NPAT 158.4 73.3
• FID on-track for Q2 2020; competitive commercial tolling agreements
in place with Prelude JV Total revenue 164.9 79.9
• World-class project that will deliver “super rich” LNG to Asian buyers Segment EBITDA 159.1 73.8
as early as 2024/25 with upside on accelerated volumes through
Prelude, exploration targets and third-party tolling through Crux Segment EBIT 156.6 71.8
• Option to realise value through divestment or development /
production
Book Value Current
Asset value / Ownership %
Longtom – connecting a discovered resource to market 30 Jun 19 Mkt Value
• Potential to supply 80 PJ via Longtom and approximately 135 PJ via Beach Energy (29%) 742 1,295
other Gippsland Basin resources to East Coast gas users
Crux (15%) 227 n/a
• Exploring all pathways to market through joint studies and feasibility
of stand-alone facilities Longtom (100%) 115 n/a
• Strong gas market resulting in demand for Longtom gas as shown by
enquiries from industrial buyers over time Bivins Ranch (11%) 112 n/aFull Year Results Presentation
Seven Group Holdings 24
21 August 2019
BUSINESS REVIEW
MEDIA
Seven Network provides leadership
through its mass audience reach
across multiple platformsFull Year Results Presentation
Seven Group Holdings 25
21 August 2019
MEDIA SEVEN WEST MEDIA
Growth in revenue share and ratings in a soft market $m FY19 FY18
• Most watched network, channel and multi-channel in FY19 with
38.8% revenue share in FY19, up 0.7% Share of associate NPAT – SWM 50.6 58.4
• Live content schedule driving ratings success while rapidly scaling Other media investments 15.2 14.2
and increasing share in high growth BVOD market
• Underlying EBIT of $212m, down 7.5% excluding FY18’s 53rd week Underlying segment EBIT 65.9 72.6
Transformation continuing at pace Significant items (290.5) 24.9
• Realised cost savings of $38m at upper end of guidance, net debt
Statutory segment EBIT (224.6) 97.5
reduced by $63m and debt facility refinanced to 2021/22
• Investing in growth areas, including Seven Studios which delivered
5% EBIT growth to $59m
• Launch of 7News.com.au in March, achieving a top 5 position vs
Australian publishers within 90 days of launch
• Launch of digital subscriptions for thewest.com.au in June 2019
• New ventures (Airtasker, HealthEngine and SocietyOne) benefiting
from audience alignment as portfolio value increased 25% to $95m
Outlook
• Focus on content led growth, transformation and balance sheet
• Metro TV ad market expected to decline low single digits; BVOD
market growth >25%
• Maintain cost discipline and reducing net debtFull Year Results Presentation
Seven Group Holdings 26
21 August 2019
INVESTMENTS LISTED PORTFOLIO AND PROPERTY
Unlocking value of listed portfolio $m FY19 FY18
• Mark-to-market gain of $63m during the year
Revenue 2.1 8.8
• Sell down of portfolio by $196 million, providing funds for
reinvestment into Beach during the year and debt reduction Other income 22.3 30.8
• Intention to further sell down over time to fund other opportunities
Share of associate NPAT (1.7) 0.7
Property portfolio Total revenue and other income 22.7 40.3
• Kodo apartment development in Adelaide delivered by Flagship
(46% SGH interest) was completed in July Segment EBITDA 21.4 33.3
• Signs of market recovery in WA to benefit remaining legacy property Segment EBIT 21.4 33.1
held at Kings Square and Dianella sites over the long-term
Fair value movement of listed portfolio
63.0 (146.9)
recognised in reservesFull Year Results Presentation
Seven Group Holdings 27
21 August 2019
GROUP
OUTLOOK
Focused on how we can position
the businesses to best drive value
and realise their potentialFull Year Results Presentation
Seven Group Holdings 28
21 August 2019
OUTLOOK FY20
Business Outlook
Strong medium to long term outlook for mining production and infrastructure investment
WesTrac and Coates Opportunities being created through new mining projects planned by major miners and growing pipeline
Hire continuing to of government infrastructure projects
capture opportunity Leading market positions held by WesTrac and Coates Hire expected to strengthen through initiatives
and deliver market- within each business
leading positions Growth in FY20 earnings expected through continued mining parts demand, growing new equipment
orders, continued level of infrastructure activity in NSW / VIC and growth in WA equipment hire market
Expanded Beach capital program with FY20 guidance range of $750-850m to drive production and
reserves growth through Cooper, Otway and Waitsia projects
Energy
Beach FY20 production guidance of 27-29 Mmboe, EBITDA of $1.25-1.4bn and DD&A $17-18/boe
Crux dual-track process underway with flexibility to select the most value-accretive shareholder outcome
Media EBIT growth FY20 EBIT of $190 to $200 million (including impact of AASB 16)
driven by cost focus Content-led growth strategy while maintaining focus on cost discipline and net debt reduction
Group Outlook
Opportunities for growth in our Industrial Services and Energy businesses as they continue to benefit from
Focus on three key
the strong medium to long term outlook for mining production, infrastructure investment, East Coast gas
growth areas
demand and other domestic LNG export opportunities
Investment income will be lower due to sell-down of listed portfolio, and contribution from media
investments expected to decline
Group EBIT guidance
FY20 underlying EBIT growth is expected in the mid to high single digits against FY19 underlying EBIT
including the impact of AASB 16, subject to there being no material adverse changes in trading conditionsFull Year Results Presentation
Seven Group Holdings 29
21 August 2019
GROUP OVERVIEW DISCLAIMER
Basis of preparation of slides
• Included in this presentation is data prepared by the management of Seven Group Holdings Limited (“SGH”) and other associated entities and investments.
This data is included for information purposes only and has not been subject to the same level of review by the company as the financial statements, so is merely provided for
indicative purposes. The company and its employees do not warrant the data and disclaim any liability flowing from the use of this data by any party.
• SGH does not accept any liability to any person, organisation or entity for any loss or damage suffered as a result of reliance on this document. All statements other than
statements of historical fact are, or may be deemed to be, forward-looking statements, and are subject to variation. All forward-looking statements in this document reflect the
current expectations concerning future results and events. Any forward-looking statements contained or implied, either within this document or verbally, involve known and
unknown risks, uncertainties and other factors (including economic and market conditions, changes in operating conditions, currency fluctuations, political events, labour
relations, availability and cost of labour, materials and equipment) that may cause actual results, performance or achievements to differ materially from the anticipated results,
performance or achievements, expressed, projected or implied by any forward-looking statements.
• Unless otherwise indicated, all references to estimates, targets and forecasts and derivations of the same in this material are references to estimates, targets and forecasts by
SGH. Management estimates, targets and forecasts are based on views held only at the date of this material, and actual events and results may be materially different from
them. SGH does not undertake to revise the material to reflect any future events or circumstances.
• Period-on-period changes that are greater than 100%, less than (100)% or change between positive and negative are omitted for presentation purposes.
Non-IFRS Financial Information
• SGH results comply with International Financial Reporting Standards (“IFRS”). The underlying segment performance is presented in Note 2 to the financial statements for the
period and excludes Significant Items comprising impairment of equity accounted investees, investments and non-current assets, fair value movement of derivatives, net gains
on sale of investments and equity accounted investees, restructuring and redundancy costs, share of results from equity accounted investees attributable to Significant Items,
loss on sale of investments and derivative financial instruments, acquisition transaction costs, significant items in other income, remeasurement of tax exposures and unusual
tax expense impacts. Significant Items are detailed in Note 3 to the financial statements and Slide 9 of this presentation.
• This presentation includes certain non-IFRS measures including Underlying Net Profit After Tax (excluding Significant Items), total revenue and other income, Segment EBIT
margin and Segment EBITDA margin. These measures are used internally by management to assess the performance of the business, make decisions on the allocation of
resources and assess operational management. Non-IFRS measures have not been subject to audit or review.
• This presentation includes references to continuing and discontinued operations.You can also read


