Nexans 2019 Half Year Results - London, 24th July 2019

Page created by Kelly Yang
 
CONTINUE READING
Nexans 2019 Half Year Results - London, 24th July 2019
Nexans
                         2019 Half Year Results

London, 24th July 2019
Nexans 2019 Half Year Results - London, 24th July 2019
Safe Harbor
This presentation contains forward-looking statements which are subject to various expected or unexpected risks and uncertainties that could have a material impact on the Company's future performance.

o    The uncertain economic and political environments in the United States and Europe, with the risk of growth being slowed by potential major changes in US trade policy on one side of the Atlantic and the possible consequences of Brexit on the other.

o    The impact of protectionist trade policies (such as those implemented by the current US government), as well as growing pressure to increase local content requirements.

o    Geopolitical instability, particularly in certain countries or regions such as Qatar, Libya and Lebanon and the Persian/ Arabian Gulf.

o    Political and economic uncertainty in Brazil and in Turkey, which is affecting the building market and major infrastructure projects as well as creating exchange rate volatility and an increased risk of customer default.

o    A marked drop in non-ferrous metal prices resulting in the impairment of Core exposure, not having an impact on cash or operating margin, but impacting net income.

o    The impact of growing inflationary pressure, particularly on commodities prices (resins, steel,) and labor costs, which could affect competitiveness depending on the extent to which they can be passed on to customers in selling prices.

o    The sustainability of high growth rates and/or market penetration in segments related to datacenters, to the development of renewable energy (wind and solar farms, interconnectors, etc.) and to transport.

o    The rapidity and extent of market take up of LAN cables and systems in the USA and the Group’s capacity to seize opportunities relating to the very fast development of data centers.

o    The risk that the sustained growth expected on the North American automotive markets and on the global electric vehicle market does not materialize.

o    Fluctuating oil and gas prices, which are leading Oil & Gas sector customers to revise their exploration and production capex programs at short notice. The considerable uncertainty about the implementation of these customers’ capex programs also creates uncertainty
     about the confirmation of cable orders booked by the Oil & Gas segment.

o    The risk of the award or entry into force of submarine and land cables contracts being delayed or advanced, which could interfere with schedules or give rise to low or exceptionally high capacity utilization rates in a given year.

o    Inherent risks related to (i) carrying out major turnkey projects for submarine high-voltage cables, which will be exacerbated in the coming years as this business becomes increasingly concentrated and centered on a small number of large- scale projects (Nordlink,
     NSL, East Anglia One, Hornsea 2 and DolWin6, which will be our first contract to supply and install HVDC extruded insulation cables), (ii) the high capacity utilization rates of the plants involved, and (iii) the projects’ geographic location and the political, social and
     economic environments in the countries concerned (Venezuela, Philippines).

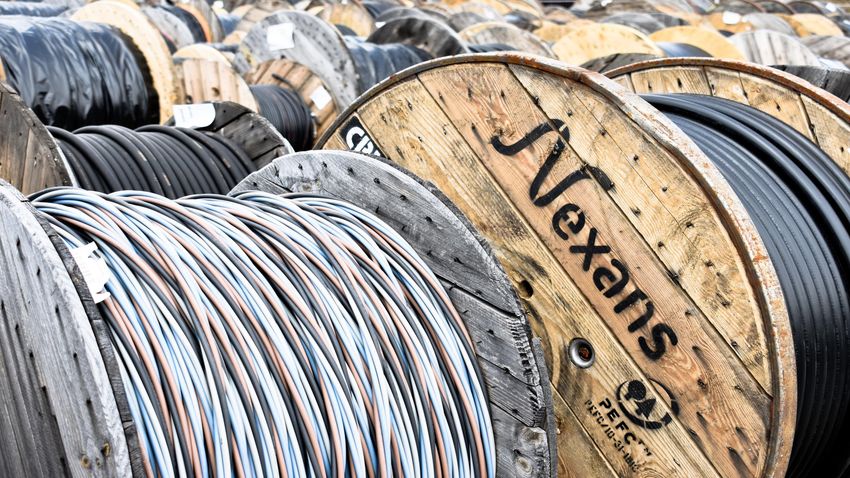
o    The inherent risks associated with major capital projects, particularly the risk of completion delays. These risks notably concern the construction of a new submarine cable laying ship and the extension of the Goose Creek plant in North America to increase the
     production of submarine high voltage cables, two projects that will be instrumental in ensuring that we fulfill our 2021 objectives.

o    The transformation and reorganization plan announced in the land high voltage and submarine medium voltage activity could lead to delays in implementation, customer deliveries and/or generate additional costs that would question a rapid return to balance.

Without major operational impacts, the two following uncertainties may have an impact on the financial statements:

o    Sudden changes in metal prices that may affect customers’ buying habits in the short term;

o    The impact of foreign exchange fluctuations on the translation of the financial statements of the Group’s subsidiaries located outside the euro zone.

INVESTOR RELATIONS:
Michel GÉDÉON      +33 1 78 15 05 41                           michel.gedeon@nexans.com
Marième DIOP       +33 1 78 15 05 40                           marieme.diop@nexans.com
Nexans 2019 Half Year Results - London, 24th July 2019
AGENDA

                       1. Highlights

                       2. Key Financials

                       3. Achievements & Progress

                       4. Deals Signed

                       5. Appendices

3 I      2019 Half Year Results
Nexans 2019 Half Year Results - London, 24th July 2019
1

HIGHLIGHTS

Christopher Guérin
CEO
Nexans 2019 Half Year Results - London, 24th July 2019
1

    First Half 2019: Solid Performance

            Market          A positive market dynamic
                            Supporting our top line

                       Growth
                                       5% organic growth
                                       Group sales reaching 3.432 billion €

                        Financials
                                        195 M€ EBITDA
                                        19% improvement vs. last year at comparable data

                      Transformation   Transformation plan in line with expectations
                                       A positive impact estimate of 48 M€

            Forward         A narrowed guidance for FY 2019 results
             view
                            At 360-390 M€ EBITDA before IFRS 16

    5 I                                                      2019 Half Year Results
Nexans 2019 Half Year Results - London, 24th July 2019
Performance Half Year 2019
Business view

               BUILDING &                                            HIGH                                    INDUSTRY                    TELECOM
              TERRITORIES                                          VOLTAGE                                 & SOLUTIONS                    & DATA
                                                                  & PROJECTS

Solid momentum for Building                    Lower volumes (phasing) and                  Positive trend in Aerospace,    Sound momentum under the effect
and recovery for Utilities                     improved margins in submarine HV             Mining and Renewable energy     of recovery in LAN and strong
                                                                                                                            demand in Optical Fiber Cables
EBITDA(*) at 81 M€ (8.8%(**))                  Land HV’s restructuring in progress          EBITDA(*) at 56 M€ (9.3%(**))
versus 52 M€ in H1’18                                                                       versus 45 M€ in H1’18           EBITDA(*) at 27 M€ (9.8%(**))
                                               EBITDA(*) at 33 M€ (10.2%(**))                                               versus 22 M€ in H1’18
                                               versus 36 M€ in H1’18

 (*) Excluding IFRS 16 impacts   ( **) EBITDA on Sales at constant metal prices

6 I                                                                               2019 Half Year Results
Nexans 2019 Half Year Results - London, 24th July 2019
Key Figures                                                                                                                                                                                                                    HIGHLIGHTS

+5.0% Organic Growth                                                                                                      EBITDA
Sales at constant metal prices in M€                                                                                                                                                                                         EBITDA in M€
                                                                                                                                                                   +19% like for like
                                                       +5.0%                                     2,311 M€
                                                                                                                                                                                                                   195 M€(*)
                                                                                                                                                                             172 M€                                              IFRS16
                                                                                                                                         153 M€                                                                                  impact

      2,201 M€                                                                                                                                                                                                       181

       June’ 18                 FX             Organic growth                Scope               June’ 19                                 H1’18                               H2’18                                 H1’19

ROCE and Working Capital                                                                                                  Net Debt evolution

                   ROCE(**)                                                       OWC/Sales(***)                                                                                                                             Net Debt in M€
                                                                            13.2%                      12.4%                                                                                                       709 M€
                                                                                                                                                                                                                                 IFRS16
                                                                                        10.7%                                                                                                                                    impact
      9.2%        9.0%          9.2%

                                                                                                                                         534 M€                                                                    587 M€
                                                                                                                                                                             330 M€

 June’18        Dec’18        June’19                                      June’18      Dec’18        June’19                           June’18                              Dec’18                                June’19

 (*) Corresponding to an Operating Margin of 113 M€ (incl. 1 M€ IFRS 16 impact)     (**) 12 month OM on end of period Capital Employed, restated for Antitrust provision and IFRS 16 – 8.8% incl. IFRS 16 impact
 (***) Operating Working Capital / (Q4 Sales at actual metal price x 4)

7 I                                                                                                   2019 Half Year Results
Nexans 2019 Half Year Results - London, 24th July 2019
EBITDA Half Year 2019                                                                                                                                    HIGHLIGHTS

Strong improvement versus 2018

        153                                               + 19%                                                         181                       195
                                                                                              29
                                                                                              28

                                                                                                          (18)                         15

                                                                            12

                  (1)                                       14

                            (30)
                                            22

      June 2018   FX &    PCS & labor   Cost reduction Transformation   Value Growth     Conjunctural     2018        June 2019      IFRS 16     June 2019
                  Scope     inflation     initiatives   Plan SHIFT        Initiatives      Growth        One-offs   (excl. IFRS16)             (incl. IFRS16)

                                                                                        Profit drivers               Cash tanks                   Value Burners

8 I                                                                2019 Half Year Results
Nexans 2019 Half Year Results - London, 24th July 2019
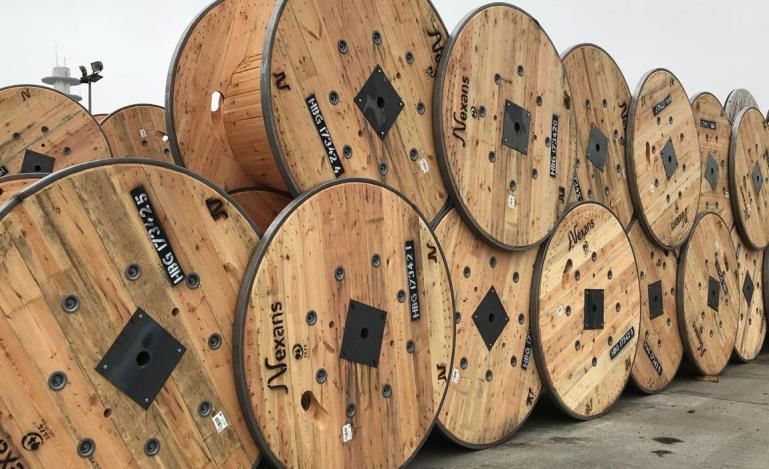
Building & Territories                                                                                                                             HIGHLIGHTS

Initial tangible results of SHIFT
Sales at constant metal: 910 M€                             Business Update

 Organic growth         +2.9%     +6.1%   +7.5%                    Overall on a good dynamic on volume and pricing
                                                                   SHIFT modules started in Q4’18 bringing ~14 M€ positive impact

                                                                1
  Sales                                                                                        Launched in Accessories business, Korea, Brazil and China
                                                                      Cost reduction
                                                                                                with first return in Q2’19
                         846      896     910                         initiatives
                                                                                               Payback not yet at full run rate

                                                                2                              Deployed in Chile, Brazil, Columbia, Peru, Lebanon, Turkey
                        H1’18     H2’18   H1’19                       Transformation            and in North America with tangible first results on H1’19
                                                                      plan (SHIFT)             Positive price effect on building business thanks to pricing
                                                                                                actions of transformation streams
EBITDA: 81 M€
                                                                3
                                  7.5%    8.8%                        Organic Growth
                                                                                               Building: +8.2% organic growth
                                                                      & Value Growth
  % of Sales                                                                                   Utilities: +6.8% organic growth
                                                                      initiatives
                        6.2%
                                                                4
                                           81                                                  In line with the forecasted impact except for the negative
  EBITDA                           67                                 Inflation
                         52                                                                     impact of SEK/EUR FX rate

                                                                    On track / Good trend              Not started / Neutral                Late / Bad trend
                        H1’18     H2’18   H1’19

9 I                                             2019 Half Year Results
Nexans 2019 Half Year Results - London, 24th July 2019
High Voltage & Projects                                                                                                                                        HIGHLIGHTS

Improved margins despite lower volumes
Sales at constant metal: 324 M€                                        Business Update

 Organic growth        -19.6%                  -23.1%   -6.0%                 Subsea: Flawless execution while improving industrial competitiveness
                                                                              Land: Transformation plan underway and site closure in Germany

                                                                           1
  Sales                                                                                                    Land: Hannover site closure announced for December
                                                                                 Cost reduction
                                                                                                            2019 and in China to be effective in H2’19
                         348                    335     324                      initiatives
                                                                                                           Subsea activities show industrial improvement in Q2’19

                                                                           2
                        H1’18                  H2’18    H1’19                    Transformation            Land: EBITDA improving while still negative. In Europe
                                                                                 plan (SHIFT)               benefits are expected in H2’19

EBITDA: 33 M€ (excl. 4 M€ of IFRS 16 impact)
                                                                           3                               Subsea: -2.5% organic growth due to project phasing
                       10.4%                            10.2%                    Organic Growth
                                                                                                            & vessel maintenance in Q1’19
                                               9.4%                              & Value Growth
  % of Sales                                                                                               Land: -15.9 % organic growth due to production delays in
                                                                                 initiatives
                                                                                                            Germany, planned capacity shutdowns and orders selectivity

                                                                           4
  EBITDA
                         36                     32       33                                                In line with the forecasted impact
                                                                                 Inflation

                                                                               On track / Good trend              Not started / Neutral                  Late / Bad trend
                        H1’18                  H2’18    H1’19

10 I                                                       2019 Half Year Results
Telecom & Data                                                                                                                                      HIGHLIGHTS

Volumes and margins benefiting from cost reduction and SHIFT initiatives
Sales at constant metal: 270 M€                             Business Update

 Organic growth         -4.2%     +0.7%   +7.7%                    Strong demand for optical fiber cables and accessories
                                                                   Dynamic trend in LAN US and special Telecom cables

                                                                1
  Sales                                                                                         Good dynamic in industrial performance improvement and
                                                                      Cost reduction
                                                                                                 fixed cost reduction plans, especially on LAN and subsea
                         249      247     270                         initiatives
                                                                                                 telecom

                                                                2
                        H1’18     H2’18   H1’19                       Transformation            Start of SHIFT module in North American activities
                                                                      plan (SHIFT)               as planned

EBITDA: 27 M€
                                                                3                               Strong demand (double digit growth) for optical fiber
                                  9.1%    9.8%                        Organic Growth
                                                                                                 business and accessories in Europe
                        8.8%                                          & Value Growth
  % of Sales                                                                                    Special telecom: activity positively affected by business
                                                                      initiatives
                                                                                                 upturn and new contracts

                                                                4
                                           27                                                   No more shortage of fiber
  EBITDA                 22        22                                 Inflation                 Start of downward price trend in raw materials (optical
                                                                                                 fiber) due to worldwide overcapacity

                                                                    On track / Good trend              Not started / Neutral                 Late / Bad trend
                        H1’18     H2’18   H1’19

11 I                                            2019 Half Year Results
Industry & Solutions                                                                                                                                             HIGHLIGHTS

Sound profitability with limited organic growth
Sales at constant metal: 600 M€                                       Business Update

 Organic growth         +1.1%               +4.4%   +2.2%                    Growth pushed up by non-harnesses activities
                                                                             Profitable growth and significant efforts on fixed costs reductions

                                                                          1
  Sales                                                                                                     Strong dynamic in fixed costs reduction
                                                                                Cost reduction
                         589                        600                         initiatives                 Industrial competitiveness plan still to ramp up
                                            570

                                                                          2                                Start of SHIFT module in North American, Chinese
                        H1’18               H2’18   H1’19                       Transformation              and Korean activities as planned
                                                                                plan (SHIFT)               Overall positive price trends, offsetting the raw materials
                                                                                                            cost increase
EBITDA: 56 M€ (excl. 1 M€ IFRS 16 impact)
                                                                          3
                                                    9.3%                        Organic Growth             Positive trend on Aerospace, Mining, Rolling Stock and
                                                                                & Value Growth              US Harnesses activities
  % of Sales            7.7%                7.2%                                initiatives                Moderate slowdown of Automation

                                                                          4
                                                     56                         Pricing & costing          In line with the forecasted impact
  EBITDA                 45                  41                                 trends

                                                                              On track / Good trend                Not started / Neutral                  Late / Bad trend
                        H1’18               H2’18   H1’19

12 I                                                      2019 Half Year Results
2

KEY FINANCIALS

Jean-Christophe Juillard
CFO
Income Statement (1/2)
                                                                                                                                                                             Other
                                                                                                                                                                                     KEY FINANCIALS

Key figures                                                                                                      LTM EBITDA evolution in M€

                                                                                                                                                                                              367
In M€                                                                   June 2018               June 2019 (**)
                                                                                                                   354                                                     (15)        15
Sales at current metal prices                                                 3,282                     3,432                                                        24
                                                                                                                               (4)
Sales at constant metal prices                                                2,201                     2,311                                           (21)
                                                                                                                                                                8
Margin on variable costs                                                         680                      712                                     44
                                                                                                                                        (38)
margin rate (*)                                                              30.9%                     30.8%

EBITDA                                                                           153                      195

EBITDA rate (*)                                                                7.0%                      8.4%                                                                                  367

Operating margin                                                                  82                      113

Operating Margin rate (*)                                                      3.7%                      4.9%

  o     Organic Growth = +5%
          o Projects: -6%
          o Products: +7%
  o     EBITDA Margin = +90 bps on a comparable basis (excl. IFRS 16)                                             LTM June    FX &    Inflation   B&T   HV&P   T&D   I&S   Other     IFRS 16 LTM June
                                                                                                                    2018      Scope                                                            2019

(*) Margin on Sales at constant metal prices   (**) Including IFRS impact of +15 M€ on EBITDA

14 I                                                                                                 2019 Half Year Results
Income Statement (2/2)                                                                                               KEY FINANCIALS

Key figures                                           From Operating Margin to Operating Income
                                                                 113
In M€                        June 2018   June 2019

Operating margin                   82         113                113

Operating income                   91         (54)                            (182)

Financial charge                  (31)        (31)
                                                                                                                           (54)
Income before tax                  59         (85)                                             10             5
                                                                                                                           -54
                                                               Operating   Reorganization Proceeds from     Other        Operating
Income tax                        (23)        (27)              margin         costs        disposals                     income

Net income from operations         36        (113)

Net income Group share             40        (116)         o     Reorganization plan announced in January 2019
                                                                   o Now finalized reorganization process
                                                                   o Mainly relates to social costs in France, Germany and Belgium

15 I                                      2019 Half Year Results
Net debt evolution                                                                                                                                                                                 KEY FINANCIALS

Net Debt last 12 month evolution in M€

                                                                                                                                                                                                       709
                                                                                     +43 M€
                                                                                                                                                                                          132
                                                                                                                                                                           577
       534                                                                      77               (65)                35                 (1)                (2)
                                                                 (16)

                         (243)                258

      June’18            OCF(*)             CAPEX             Disposals     Restructuring   Operating         Non         Equity                       FX & Other         June’19        IFRS 16       June’19
                                                              of assets       cash-out    Working Capital Operating WC Operations(**)                                  (excl. IFRS 16)             (incl. IFRS 16)

  o     Exceptional level of Capex
          o Aurora vessel + Goose Creek 114 M€

  o     Restructuring for European plan and Transformation costs

  o     OWC reduction driven by HV & Projects

(*) Operation Cash Flow = Cash effect of EBITDA – Financial & Tax charges            (**) Dividend payments (16 M€), employees shareholding (-13 M€) and M&A (-4 M€)

16 I                                                                                            2019 Half Year Results
Working capital                                                                                                                                     KEY FINANCIALS

OWC on Sales - excluding Projects                                                               OWC 12 month evolution

Evolution of Operating Working Capital excluding High Voltage & Project activities(*)                                    (65 M€) improvement
                             15.6%                        14.6%              14.2%          Série

        OWC/Sales

                                                                                            Série
 Operating Working
            Capital

                             June’17                      June’18           June’19                 June 2018    Submarine     Land High   Cables    June 2019
                                                                                                                High Voltage    Voltage

  o    Increase of Cables OWC on the back of stronger volume partially offset by better OWC%
  o    More favorable cash curve position for Submarine High Voltage despite consumption of down payments received over Q4’18
  o    Strong focus on Land HV to align OWC with the volume of business

(*) June 2017 restated to exclude Special Telecom’s OWC

17 I                                                                                2019 Half Year Results
ROCE(*)                                                                                                                                                                   KEY FINANCIALS

Group ROCE in %                                                                                                      ROCE excluding High Voltage & Projects (in %)

              10.3%                                                                                                                                                    8.7%
                                                                                                                                  8.3%
                                                        9.2%                                      9.2%                                                 7.8%

            June 2017                               June 2018                                June 2019                        June 2017             June 2018        June 2019

ROCE 12 month evolution (in %, excluding High Voltage & Projects)

                                                                                                                                              (0.3%)                   8.7%
                                                                                                                1.2%
                    7.8%
                                                                     0.0%

                June 2018                                       FX & Scope                                 Operating Margin               Capital Employed           June 2019

(*) 12 month OM on end of period Capital Employed, restated for Antitrust provision and IFRS 16

18 I                                                                                                     2019 Half Year Results
Key capital structure KPIs                                                                                                                           KEY FINANCIALS

                                                                                                                                                IFRS
Interest Charge over EBITDA                                                                                                                   impacted

                                                              14%                14%                             14%
                    Interest / EBITDA                                                                                                            10%

                      Interest Charge

                                                            Dec 2017           June 2018                        Dec 2018                       June 2019
Net Debt and Gearing ratios
Covenant at 120% (post IFRS 16)                                                                                                                  57%
                                                                                 38%
                             Gearing                          23%                                                24%

                             Net Debt
                                                            Dec 2017           June 2018                        Dec 2018                       June 2019
Leverage ratios
 Covenant at 3.2 X EBITDA (post IFRS 16)
                                                                                 1.2x                            1.3x                            1.4x
                           Leverage(*)
                                                              0.9x

                            Net Debt

                                                                               June 2018                        Dec 2018                       June 2019

                                   o     S&P rating: BB negative outlook                    o   Strong liquidity covering future refinancing needs
 (*) Average net debt of December 2018 and June 2019 / LTM EBITDA

19 I                                                                       2019 Half Year Results
Strong liquidity covering future debt refinancing needs
Net Debt breakdown (incl. IFRS 16)                                                        Liquidity and debt redemption schedule
                                                                                            In M€

In M€                                                                      June 2019
                                                                                                                                                                        1,173
Gross Debt                                                                     1,173
                                                                                                                                                              123
                                                                                                        Undrawn
                                                                                                        facility
                                                                                                                                                     200
Cash and cash equivalents                                                      (464)                    committed up
                                                                                                        to 2023
                                                                                              600
                                                                                                                                             325
Net Debt                                                                        709

                                                                                                                                     250
                                                                                                        Cash
                                                                                                        & cash
                                                                                              464       equivalents
 IFRS 16 impacts                                                                                                          275

  o     Increase of debt by 126 M€ on transition date (mostly from real                       Total                      Local        2021    2023    2024   IFRS 16      Total
        estate contracts), balance of 123 M€ as of June 2019                                Available                  borrowings    Bond    Bond    Bond              Gross Debt
                                                                                            Liquidity                  & others(*)   3.25%   3.75%   2.75%
  o     Impact as of June 2019: 15 M€ EBITDA, not material on OM
        and net result
 (*) Including IFRS restatements on ordinary bonds and excluding IFRS 16

20 I                                                                          2019 Half Year Results
2019 objectives                                                                                                                                                                                              HIGHLIGHTS

EBITDA guidance improved from [350-390] M€ to [360-390] M€
In M€                                                                                                                                                             In % at constant perimeter

                                              360-390 M€                                                                                                                                             9.0-11.0%
            325 M€
                                                                                                                                                                                   9.0%

                                                                                  o FY’19 FCF expected negative due to
                                                                                    restructuring outflow
                                                                                        o End of year net debt in the region of 600 M€
                                                                                           after IFRS

                                                                                  o FY’19 Net income expected negative due to
                                                                                    specific restructuring
                                                                                        o FY’19 Net income in the region of -110 M€

               2018                                 2019E                                                                                                                          2018                2019E

                             EBITDA                                                                                                                                                  ROCE(**) before taxes

 (*) Operating Margin before depreciation and amortization. Yearly depreciation and amortization amounting to approximately 150 M€, Operating Margin can be computed accordingly
 (**) Return on Capital Employed: 12 month OM on end of period Capital Employed (Current assets and Property, plant and equipment and intangible assets)

21 I                                                                                                    2019 Half Year Results
3

ACHIEVEMENTS
& PROGRESS
Christopher Guérin
CEO
Transformation plan : significant progress                                                                                                                           ACHIEVEMENTS & PROGRESS

                            EBITDA(*)
                            in M€
                                                                                                                                                                             500
                                                                     325

                                                                    FY18                                          FY19E                          FY20P                      FY21P

                             Transformation Plan                                                                           FY19                              FY20                   FY21

 Actions
 financial                   Organic growth & value growth init.                                           FY19                                       FY20                          FY21

 impact
 (Cumulated %
 of 2021 Run                 Cost reduction initiatives                                                                                  FY19                FY20                   FY21

 Rate)

                             Price cost squeeze & labor inflation                                                                 FY19                       FY20                   FY21

                                                                                                    0%                     25%                  50%                 75%             100%

(*) Depreciation amounting to approximately 140M€ in 2018 and 150M€ beyond, Operating Margin can be computed accordingly

       Actual results                                               Expected results for the year

23 I                                                                                                     2019 Half Year Results
Transformation plan : significant progress                                                                                                                  ACHIEVEMENTS & PROGRESS

                               Restructuring : Announcement on 24th January 2019; all the main                Progress vs. 2019 ambition

 A1- Restructuring project     milestones have been reached so far, implementation starting in Q3 2019
                                                                                                              0%                           100%   1,200 Initiatives tracked on weekly pace
                               up to Q4 2020

                               Indirect cost reductions have had a significant impact on H1 results.          Progress vs. 2019 ambition

 A2- Indirect Cost reduction   The focus of this workstream will move in H2 to structural actions
                                                                                                              0%                           100%

                               such as maintenance or IS/IT value for money improvement.

 A3- Manufacturing & OWC       OWC improvement plan has started delivering results,                           Progress vs. 2019 ambition

                               about 2 years of industrial productivity pipeline has been identified in H1.
                                                                                                              0%                           100%
 performance
                               The focus will now be put on the implementation of these levers.

                                                                                                              Progress vs. 2019 ambition

 A4- Capex reengineering       The group CAPEX process has been fully reengineered to increase                0%                           100%

                               selectivity, focus and ROI follow up.

                                                                                                              Progress vs. 2019 ambition

                               Since Q4 2018, twelve (12) SHIFT modules have been deployed
 B- SHIFT Transformation
                                                                                                              0%                           100%

                               and start delivering visible results on EBITDA and OWC.

24 I                                                                         2019 Half Year Results
TRANSFORM OUR POSITIONING                    New value proposition supported by Services & Solutions under deployment
Change Playfield to grow value

                                          Building                        High Voltage                      Telecom                    Industry
                                        & Territories                      & Projects                        & Data                   & Solutions
                                 o   Building                       o Renewables (Wind offshore)   o Data transmission         o   Transportation
                                 o   Smart Cities / Smart Grids     o Interconnections               (submarine fiber, FTTx)   o   Automation
                                 o   E-mobility                     o Land high voltage            o Telecom network           o   Renewables (Wind onshore & Solar)
                                 o   Local infrastructure           o Smart solutions              o Hyperscale data centers   o   Resources
                                 o   Decentralized energy systems                                  o LAN cabling solutions     o   High-tech
                                 o   Rural electrification

        2018                                                                                                                                                2030

 25 I                                                                 2019 Half Year Results
High Voltage & Projects
We are purposely building a resilient and profitable backlog with limited risks
 A backlog above 1.2B € and a 90% load ratio for 2019-20                                               Preparing for next deals to come, with robust pipeline ahead

  Nexans Submarine projects under execution                                                              A selection Future subsea interconnection projects

                                                                                                         Cable
                                                                                                         Installation                                                                                     Capacity
               2019                              2020                       2021                         start year     Name                                                Countries                     MW
                                                                                                         2020           Greenlink                                           United Kingdom-Ireland              500
                                                                                                         2020           Canary Islands                                      Spain-Spain                         120
                                                                                                         2020           Shetland HVDC Link                                  United Kingdom-United Kingdom       600
   o   NordLink                       o   North Sea Link         o North Sea Link                        2021           NorthConnect                                        United Kingdom-Norway             1400
   o   North Sea Link                 o   Mindanao Vizayas       o Dolwin 6                              2021           NeuConnect                                          United Kingdom-Germany            1400
   o   Mindanao Vizayas               o   Mallorca Menorca                                               2021           Slovenia-Italy                                      Slovenia-Italy                    1000
   o   Mallorca Menorca               o   Lavrion Syros                                                  2021           Gridlink                                            United Kingdom-France             1400
   o   Lavrion Syros                  o   Hornsea 2                                                      2021           Cross Shannon Cable                                 Ireland-Ireland
   o                                                                                                     2021           Channel Islands: Guernsey-France (GF1)              Guernsey-France                     100
       Fensforden                     o   Dolwin 6
                                                                                                         2022           Western Isles Link                                  United Kingdom-United Kingdom       600
   o   East Anglia 01                 o   Balsfjord
                                                                                                         2022           Balearic Islands                                    Spain-Spain                          53
   o   Hornsea 2
                                                                                                         2022           Crete-Attica                                        Greece-Greece                     1000
                                                                                                         2023           ELMED (Italy-Tunisia)                               Italy-Tunisia                       600
                                                                                                         2023           Biscay Gulf                                         France-Spain                      2000
                                                                                                         2023           Balearic Islands: Spain-Mallorca Second Link Spain-Spain                              1000
                                                                                                         2023           Cyclades Phase D                                    Greece-Greece
                                                                                                         2024           South Aegean: Levitha-Korakia (Crete)               Greece-Greece                       800
                                                                                                         2024           Celtic Interconnector                               Ireland-France                      700
                                                                                                         2024           South Aegean                                        Greece-Greece                       200
                                                                                                         2024           Hansa Powerbridge 1                                 Sweden-Germany                      700
  0%     30%      60%    90%     0%        30%      60%   90%   0%    30%      60%   90%                 2024           Marinus Link                                        Australia-Australia               1200
                                                                                                         2025           Adriatic HVDC link                                  Italy-Italy
                                                                                                         2026           Italian HVDC tri-terminal link (Sardinia to Sicily) Italy-Italy
                        Our capacity / load ratio on Subsea cables                                       2026           Italian HVDC tri-terminal link (Sicily to Mainland) Italy-Italy

26 I                                                                                   2019 Half Year Results
High Voltage & Projects
Leader in project execution
                                                                                          Uses extensively digital
                                                                                     simulations, advanced analytics
                                                                                      tools and robust project model
                                                                                            with control gates.
                                                                                                                       SUBSEA DECISION MODELLING TOOL
           Nexans offers an adequate balance between cable related                                                     A Nexans tool
           risk vs. cost on its projects to warrant seamless execution.
           Our process combines an end to end continuous consideration
           and evaluation of risk likeliness & severity alongside the different
           phases of the project with early stage collaboration with client's
           engineering teams to mitigate risks at three stages:
                                                                                                                       New Project modelisation tool for subsea project
                                                                                                                       to determine the best Fit contract in :
                                                                                                                       Financials terms, Risk, Technical modelisation,
            1                                                                                                          Capacity yield management, supported by Market
                During upstream phase, for example trough seabed
                assessment, locating UXO (UnExploded Ordinance)
                                                                                                                       intelligence.

            2
                During design & manufacturing phase, trough best in class
                manufacturing quality norms & methods and test facilities

            3
                                                                                                                        Taking the right decision through modelisation
                During installation phase, focusing both on mechanical
                damages and workmanship mistakes usual root causes

27 I                                                                         2019 Half Year Results
4

DEALS SIGNED
Nexans brings Energy to Life                                                                                                DEALS SIGNED

 Building & Territories                                             High Voltage & Projects
 NEXANS INTRODUCES A NEW ASSET MANAGEMENT                           WINDFLOAT ATLANTIC: NEXANS TO SUPPLY TURBINE
 SERVICE FOR DISTRIBUTION SYSTEM OPERATORS                          CABLES & ACCESSORIES FOR THE WORLD’S FIRST
 (DSOS)                                                             FLOATING OFFSHORE WIND FARM OPERATING AT 66 KV

                     The solution can deliver TOTEX (CAPEX +         Nexans will supply turbine cables,
                     OPEX) savings                                   outer-cone T-connectors as well as
                     up to 10-15 percent on mid- and long-term       pre-terminated WINDLINK® cables
                     strategies.                                     for the MHI Vestas V164-8.4 MW turbines.

 Industry & Solutions                                               Telecom & Data
 NEXANS COMPLETES HIGH VOLTAGE CABLE PROJECT                        NEXANS SIMPLIFIES DATA CENTRE NETWORK MONITORING
 TO CONNECT THE 88 MEGAWATT (MW) KYPE MUIR WIND                     AND SCALE-UP WITH THE LAUNCH OF LANSENSE AIM AND
 FARM TO SCOTLAND’S POWER GRID                                      NEW HIGH-DENSITY COPPER & FIBRE SOLUTIONS

                                                                                                   The Group presented its cutting-edge
                                                                                                   LANmark® ENSPACE ultra high
                                                                                                   density fibre solution and Slimflex
                                                                                                   solution aimed at minimising footprint
                                                                                                   and maximising scalability.

29 I                                                    2019 Half Year Results
Nexans brings Energy to Life
Innovation
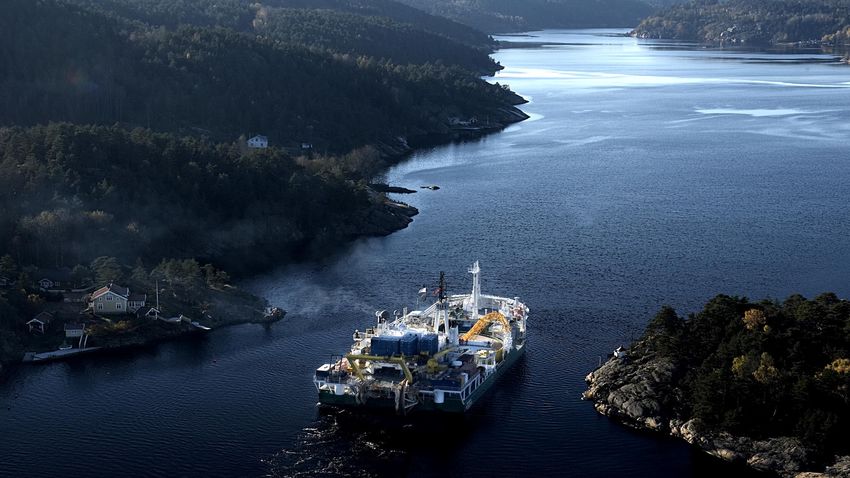
NEXANS EXPANDS ITS CONNECTED DRUMS SERVICE TO NEW GLOBAL MARKETS

     Nexans technology, the first in the market,             Nexans has expanded Connected Drums’ service
  enables DSO customers to know the exact location          offer to new international markets, including the UK,
   of their cable drums, minimising the risk of lost or       Switzerland, Germany, Chile, France and Belgium.
                     stolen assets.                          A fleet of over 1200 connected drums have been
                                                                             deployed globally.

30 I                                               2019 Half Year Results
5

APPENDICES
Nexans, a global cable solution provider                                                                                                  APPENDICES

End markets                                                           Sales by business segments

                       o   Building
                       o   Smart Cities / Smart Grids
         Building      o   E-mobility
       & Territories   o   Local infrastructure
                       o   Decentralized energy systems
                       o   Rural electrification                                                           10%
                                                                                        19%
                       o Offshore wind farms
                       o Interconnections
       High Voltage                                                                                                             High Voltage & Projects
                       o Land high voltage
        & Projects     o Smart solutions for O&G
                                                                                                                          21%   Industry & Solutions
                         (DEH, subsea heating cables)
                                                                                   9%       €3.4 bn Sales*                      Building & Territories
                                                                                               in H1’19                         Telecom & Data
                       o Data transmission                                                                                      Others
                         (submarine fiber, FTTx)
         Telecom
                       o Telecom network
          & Data       o Hyperscale data centers
                       o LAN cabling solutions
                                                                                                 41%
                       o   Transportation
                       o   Automation
        Industry
                       o   Renewables                                                   * Sales at current metal prices
       & Solutions     o   Resources (O&G, Mining)
                       o   High-tech (nuclear, medical)

32 I                                                      2019 Half Year Results
Sales and profitability by segment (excl. IFRS 16)                                                                  APPENDICES

                                           June 2018                                             June 2019

                                            EBITDA
 In M€                    Sales   EBITDA               OM         OM %          Sales   EBITDA   EBITDA %    OM      OM %
                                              %

 Building & Territories   846       52       6.2%      28         3.3%          910       81       8.8%      57      6.2%

 High Voltage
                          348       36       10.4%     16         4.7%          324       33       10.2%     18      5.5%
 & Projects

 Telecom & Data           249       22       8.8%      16         6.6%          270       27       9.8%      21      7.7%

 Industry & Solutions     589       45       7.7%      28         4.7%          600       56       9.3%      38      6.4%

 Other                    169      (2)        n/a      (7)         n/a          205      (15)       n/a      (21)     n/a

 TOTAL GROUP              2,201    153       7.0%      82         3.7%          2,311    181       7.8%      112     4.8%

33 I                                                   2019 Half Year Results
Impact of foreign exchange and consolidation scope                                                         APPENDICES

 Sales at constant metal prices, in M€   June 2018               FX           Organic growth   Scope   June 2019

 Building & Territories                     846                  0                 64           0        910

 High Voltage & Projects                    348                 (3)                (21)         (0)      324

 Telecom & Data                             249                  2                 19           0        270

 Industry & Solutions                       589                  3                 13           (4)      600

 Other                                      169                  3                 34           0        205

 TOTAL GROUP                               2,201                 5                 109          (4)      2,311

34 I                                                 2019 Half Year Results
Sales by quarter by segment                                                                          Sequential Growth
                                                                                                     Sales at constant metal in M€
                                                                                                                                      APPENDICES

Building & Territories                                               High Voltage & Projects

             450         441      454     455     455                                                                        +57.9%
                                                                                  +52.9%
   396
           +13.5%
                                                                                   211                                         199
                                                                                             177
                                                                                                         158
                                 +2.1%                                   137                                        126
                         -1.5%           -0.2%   +0.2%
                                                                                                                  -20.1%
  -6.7%
                                                                                                       -10.4%
                                                                                            -16.0%
  Q1’18     Q2’18        Q3’18   Q4’18   Q1’19   Q2’19
                                                                       -39.0%
                                                                        Q1’18      Q2’18    Q3’18       Q4’18      Q1’19      Q2’19

Telecom & Data                                                       Industry & Solutions

                                          132     139                    291       298       288                    296        304
             127                  127                                                                    283
   121                   120

                                                                       +5.9%                                       +5.4%
            +4.9%        -5.3%   +5.0%           +5.5%                            +2.3%                                       +2.7%
                                         +3.4%
                                                                                            -3.3%       -2.0%
 -2.1%

  Q1’18     Q2’18        Q3’18   Q4’18   Q1’19   Q2’19                  Q1’18      Q2’18    Q3’18       Q4’18      Q1’19      Q2’19

35 I                                                     2019 Half Year Results
Financial highlights                                                                                                                                      APPENDICES

                                                                                    EBITDA (in M€ and as % of sales          Net income/(Loss) attributable
Sales at current metal prices (in M€)   Sales at constant metal prices (in M€)      at constant metal prices) – excl. IFRS16 to the owners of the parent (in M€)

                 6,370 6,490             4,604 4,431 4,571 4,409                                        9.0%
 6,239                                                                                        8.5%                                                 125
         5,814                                                                       7.2%
                                                                                                        411
                                                                                              375               7.4%                      61
                                                                                     333                        325                                       14
                                3,432                                     2,311                                         7.8%
                                                                                                                        181

                                                                                                                                                                 -116
                                                                                                                                 -194
  2015   2016    2017    2018    June    2015    2016    2017    2018      June      2015     2016      2017    2018    June     2015    2016      2017   2018   June
                                 2019                                      2019                                         2019                                     2019

Operational Cash Flow (in M€)           Net Capital expenditure (in M€)             Equity (in M€)                              Net Debt (in M€)
                 277                      170            161                                  1,469 1,468                                                        587
                                                                 156                                            1,367
         224                                                                          1,227                             1,254
                                                 135
  191                                                                      121
                         153                                                                                                                       332    330
                                 138
                                                                                                                                  201    211

  2015   2016    2017    2018    June    2015    2016    2017    2018      June       2015       2016    2017    2018    June    2015    2016      2017   2018   June
                                 2019                                      2019                                          2019                                    2019
                                                                                                                                                                 (excl.IFRS 16)

36 I                                                                    2019 Half Year Results
Income statement: gross margin and indirect costs evolution                                                                                                                     APPENDICES

Gross Margin evolution
                                                                                                                                                                               30.8%
                                                                                                                                                               21
         30.9%                                                                                                                        12
                                   0
                                                        (19)                                                  14
                                                                                    4

       June 2018                 FX &           PCS & labor inflation   Cost reduction initiatives   Transformation Plan    Value Growth Initiatives   Conjunctural Growth   June 2019
                                 Scope                                                                     SHIFT
Indirect costs evolution

                                                  11
         527                 2
                                                                        (18)
                                                                                                                                             11                     (15)
                                                                                                 0                      0                                                       517

       June 2018           FX &          PCS & labor inflation    Cost reduction        Transformation Plan        Value Growth     Conjunctural Growth         IFRS 16       June 2019
                           Scope                                    initiatives               SHIFT                  Initiatives

37 I                                                                                2019 Half Year Results
Income statement: financial charge breakdown                            APPENDICES

Financial charge

In M€                                                       June 2018   June 2019

Cost of debt                                                     (22)        (19)

Net foreign exchange gain (loss)                                   0          (6)

Interest on Pension                                               (3)         (3)

Others                                                            (6)         (3)

Financial charge                                                 (31)        (31)

38 I                               2019 Half Year Results
Balance sheet: general overview                                                        APPENDICES

In M€                                                                  December 2018   June 2019

                                                                               1,608       1,814
Fixed assets and other non-current assets
                                                                                 243         241
Of which goodwill
                                                                                   -         121
Of which IFRS 16 tangibles

Deferred tax assets                                                             162         162

Non-current assets                                                             1,770       1,976

Working Capital                                                                 556         758

Total to finance                                                               2,327       2,734

Net financial debt                                                              330         709
Of which IFRS 16 net debt                                                         -         123

Reserves                                                                        510         649
Of which: - restructuring                                                        34         170
          - pension & jubilee                                                   363         363

Deferred tax liabilities                                                        109         116
Derivative liability non current                                                 11           6
Shareholders’ equity and minority interests                                    1,367       1,254

Total financing                                                                2,327       2,734

39 I                                          2019 Half Year Results
Balance sheet: net debt breakdown                                                                       APPENDICES

Net Debt breakdown

In M€                                                                                  December 2018   June 2019
Long-term ordinary bonds                                                                         771        772

Other long-term borrowings(*)                                                                      7         58

Short-term OCEANE convertible bonds                                                              269           -

Short-term borrowings and short-term accrued interest not yet due(*)                             169        193

Short-term bank loans and overdrafts                                                              15         28

Gross Debt*                                                                                    1,231       1,050

Cash and cash equivalents                                                                      (901)       (464)

Net Debt excluding lease liabilities                                                             330        587

Lease liabilities                                                                                  -        123

Net Debt                                                                                         330        709

(*) Excluding lease liabilities

40 I                                                          2019 Half Year Results
You can also read