Q2 '19 Results Accelerating Deleverage August 2nd, 2019 - Luigi Gubitosi Giovanni Ronca - Telecom Italia

Page created by Elsie Navarro
 
CONTINUE READING
Q2 '19 Results Accelerating Deleverage August 2nd, 2019 - Luigi Gubitosi Giovanni Ronca - Telecom Italia
TIM Group

Q2 ’19 Results
Accelerating Deleverage
August 2nd, 2019

Luigi Gubitosi
Giovanni Ronca
Q2 '19 Results Accelerating Deleverage August 2nd, 2019 - Luigi Gubitosi Giovanni Ronca - Telecom Italia
Safe Harbour

This presentation contains statements that constitute forward looking statements regarding the                          Such forward looking statements are not guarantees of future performance and involve risks and
intent, belief or current expectations of future growth in the different business lines and the global                  uncertainties, and actual results may differ materially from those projected or implied in the
business, financial results and other aspects of the activities and situation relating to the TIM Group.                forward looking statements as a result of various factors.

The 2Q'19 and 1H'19 financial and operating data have been extracted or derived, with the exception of some
data, from the TIM Group Half-year Condensed Consolidated Financial Statements as of and for the six months         Alternative Performance Measures

ended 30 June 2019, which has been prepared in accordance with International Financial Reporting Standards
                                                                                                                    The TIM Group, in addition to the conventional financial performance measures established by IFRS,
issued by the International Accounting Standards Board and endorsed by the European Union (designated as
                                                                                                                    uses certain alternative performance measures in order to present a better understanding of the
"IFRS"). Please note that the limited review by the external auditors (E&Y) on the TIM Group Half-year Condensed
                                                                                                                    trend of operations and financial condition. In particular, such alternative performance measures
Consolidated Financial Statements at 30 June 2019 has not yet been completed.
                                                                                                                    include: EBITDA, EBIT, Organic change and impact of non recurring items on revenue, EBITDA and
The accounting policies and consolidation principles adopted in the preparation of the TIM Group Half-year
                                                                                                                    EBIT; EBITDA margin and EBIT margin and net financial debt. Moreover, following the adoption of
Condensed Consolidated Financial Statements as of and for the six months ended 30 June 2019 are the same as
                                                                                                                    IFRS 16, the TIM Group provides the following further financial indicators:
those adopted in the TIM Group Annual Audited Consolidated Financial Statements as of 31 December 2018, to
which reference can be made, except for the adoption of the new accounting principle (IFRS 16 - Lease), adopted     ▪    EBITDA adjusted After Lease ("EBITDA-AL"), which is calculated by adjusting Organic EBITDA, net
starting from 1 January 2019. In particular, TIM adopts IFRS 16, using the simplified retrospective approach,            of non-recurring items, of the amounts related to the accounting treatment of finance lease
without restatement of prior period comparatives. The implementation of the new standard has not been fully              contracts in accordance with IAS 17 (applied until the end of 2018) and IFRS 16 (applied from
completed; the impact of the adoption of IFRS 16 is unaudited and may be subject to change until the publication
                                                                                                                         2019);
of TIM’s 2019 Annual Report. It should be noted that, starting from 1 January 2018, the TIM Group adopted IFRS
15 (Revenues from contracts with customers) and IFRS 9 (Financial instruments).                                     ▪    Adjusted Net Financial Debt After Lease, which is calculated by excluding from the adjusted net
                                                                                                                         financial deb the liabilities related to the accounting treatment of finance lease contracts in
To enable the year-on-year comparison of the economic and financial performance for the first half of 2019, “IFRS
9/15” income statement figures, prepared in accordance with the previous accounting standards applied (IAS 17            accordance with IAS 17 (applied until the end of 2018) and IFRS 16 (applied from 2019).
and related Interpretations) are provided, for the purposes of the distinction between operating leases and
                                                                                                                    Such alternative performance measures are unaudited.
financial leases and the consequent accounting treatment of lease liabilities

                                                                                                                                                                                                                           1
Q2 '19 Results Accelerating Deleverage August 2nd, 2019 - Luigi Gubitosi Giovanni Ronca - Telecom Italia
Q2 ’19 Results

1      Highlights

2      Main Trends and Financial Update

3      Closing Remarks

4      Q&A

                                          Q2 ’19 Results
                                                           2
Q2 '19 Results Accelerating Deleverage August 2nd, 2019 - Luigi Gubitosi Giovanni Ronca - Telecom Italia
Highlights
Plan execution at full speed
                                                                         What happened in Q2                                                         KPIs
    Accelerating deleverage                                                 ▪ Agreement with Labour Unions on “Expansion Contract” from late          +17 months expansion
                                                                              August, first company in Italy to use the new law                      contract financial impact
                                                                                                                                                      similar to “solidarietà”
                                                                            ▪ First waves of exits: 1,581 headcounts exits in H1 including 1,266
                                                                                                                                                             on top of
                                                                              on 1 July; second round in December
                                                                                                                                                        ~37% of 2021 cost
         Revamp culture                                                     ▪ Accelerating re-skilling and inclusion, e.g. engagement survey             cutting(1) secured
         and organization
     Discipline, focus and simplicity
                                                                             ▪ 5G launched and ramping up to bring value through premiumness         Human ARPU            € / line / month

                                                                             ▪ OpenSignal award confirms TIM’s top of the class Mobile network          13.0       12.4           12.5
   Revamp domestic business                                                  ▪ Mobile ARPU stabilized for TIM; market prices up (new clients & CB)
      value and quality positioning,                                         ▪ “Fix the fixed”: BB net adds back to growth; comprehensive plan
        modernization, efficiency                                                                                                                      Q4 '18     Q1 '19           Q2
                                                                               under way to improve KPIs

                                                                            ▪ Revenue reacceleration despite competitive and macro dynamics          Q2 ’19 EBITDA +6.3% YoY
      Further develop Brazil                                                ▪ Infrastructure sharing and other projects; MOU signed with Vivo
  ride growth waves and efficiency plan
                                                                                                                                                      New Brazilian tax asset
                                                                            ▪ New R$ 3.4 Bn tax asset: final judgment provides right to              R$ 3.4 Bn or €0.8bn to be
                                                                              compensate past excess operating tax payments from future taxes            used in 3/4 years

             Deleverage                                                                                                                                 Net Debt reduced
                                                                             ▪ Net Debt further decrease driven by strong OFCF generation
           and focus on ROIC                                                                                                                          -€349m Q2, -€539m H1
                                                                             ▪ Working capital outflow strongly reduced
                                                                                                                                                       EqFCF generation
                                                                             ▪ Equity Free Cash Flow generation trebled vs. 2018 in H1 2019
                                                                                                                                                      €570m Q2, €786m H1
               (1)   Planned cost cutting: -8% P/L view, -14% cash-view on addressable costs (€5.1bn) in 2021                                                   Q2 ’19 Results
                                                                                                                                                                                              3
Highlights
Strategic initiatives update

                                                                            ▪ Agreements signed on July 26th (1)
                                                                            ▪ TIM and Vodafone will jointly control the new INWIT through equal stakes (37.5% each,
                                                                              with the option of reducing to 25%) and will enter into a three-year lock-up agreement
  Network sharing partnership
     TIM-Vodafone Italia                                                    ▪ TIM expects >€150m synergies p.a.: >€80m p.a. direct synergies on top of €75m pro-quota
                                                                              share (37.5%) of estimated synergies (€200m) for New INWIT in terms of annual
                                                                              improvement in EBITDA by 2026 stemming from the deal
                                                                            ▪ The transaction will allow TIM to cut debt by more than €1.4bn over time

     Potential partnership                                                  ▪ Work in progress with financial advisors, contacts with Open Fiber shareholders protected
        in fiber roll-out                                                     by NDA announced on June 20th
                                                                            ▪ Options presented to TIM Board
                                                                            ▪ Board confirmed the mandate to the CEO to continue negotiations with OF shareholders

                                                                            ▪ Partnership with consumer credit player to enhance credit management effectiveness,
  Consumer credit partnership                                                 support sales and exploit cross selling opportunities
                                                                            ▪ Short list defined, partner to be selected by October 2019

                                                                            ▪ TIMVISION: moving from content production to content aggregation
  Transformational strategy in                                              ▪ Settled long time dispute with Sky, which will allow to bundle with TIMVISION NowTV
      content aggregation                                                     (ticket Sport) that includes several sports like Serie A TIM matches
                                                                            ▪ Distribution agreements with Amazon, Discovery, Mediaset, Netflix and others

             (1)   The transaction is subject to approval by INWIT’s non-controlling shareholders                                                            Q2 ’19 Results
                                                                                                                                                                              4
Q2 ’19 Results

1      Highlights

2      Main Trends and Financial Update

3      Closing Remarks

4      Q&A

                                          Q2 ’19 Results
                                                           5
Q2 ’19 Main Results                                                                                                                                                                     All figures based on IFRS
Deleverage accelerating in Q2; €786m Equity FCF in 6 months                                                                                                                            9/15 accounting standards
                                                                                                                                                                                       and on a comparable base
Organic data (1), €m

                                                     Q2 ’18                      Q2 ’19

                                                                                              Growth
                                                                                           ex Sparkle (2)
                                       Group          4,250        -2.5%         4,143        -0.4%                         ▪    Service revenues excluding Sparkle -0.4% YoY, with
      SERVICE                                                                                                                    Domestic -1.2% and Brazil +2.4%
                                   Domestic            3,358        -3.8%         3,232       -1.2%
      REVENUES
                                       Brazil                      +2.4%
                                                                                                                            ▪    EBITDA -2.6%, with Domestic at -4.4% and Brazil +6.3%
                                                        899                       922
                                                                                                                                 YoY. EBITDA margin +0.6p.p. to 42.2% in Q2
                                                      1,958        -2.6%         1,907

                                                       1,618        -4.4%         1,546
      EBITDA
                                                        342        +6.3%          364
                                  % on revenues        41.6%                      42.2%                                     Second quarter showing continuous improvement in cash-
                                                                                                                            generation:

                                                      1,028        +0.5%         1,033                                      ▪    Net Debt at €24,731m, with a reduction of -€349m from
      EBITDA-                                                                                                                    previous quarter and -€539m from FY’18
                                                        913         -2.8%         887
      CAPEX
                                                        118        +24.9%         149
                                                                                                                            ▪    Equity FCF trebled YoY in H1                                     3x

                                         FY '18                                      25,270

      NET DEBT(3)                        Q1 '19                                  25,080                                           EQUITY FREE
                                                                                                                                  CASH-FLOW
                                         Q2 '19                                                                                                                 Q1       Q2       H1         Q1        Q2          H1
                                                                        24,731
                                                                                                                                                                        2018                           2019

                       (1) Excluding exchange rate fluctuations & non recurring items. CAPEX excluding license                                                                                    Q2 ’19 Results
                       (2) Total service revenues growth excluding Sparkle’s International Wholesale revenues, without any impact on EBITDA. Sparkle’s EBITDA growing +17% YoY in Q2                                    6
                       (3) Adjusted Net Debt
Q2 ’19 Domestic Mobile
ARPU growing QoQ, churn better. First signs of improvement in human calling CB
                                           Mobile KPIs                                                                                                            Mobile Revenues
                                                                                                                             Organic data, €m

         TIM ARPU                                                    Market MNP
                                                                                                                                                     1,321
                (human)        € / line / month                                                     Mln                                                              -15.9%
                                                                  43%                                                                                  277                          1,111
  13.6                                                                       8%                                                                                      Service                     Handsets &
         13.5                                          -11%                           -16% -36%                                                                                      168
                  13.0                                                                                                                               1,044                                       Handsets
                                       12.5                                                                                                                           -9.6%
                            12.4                                                                                                                                                     943         Bundle
                                                                  5.7                                                                                  942            Retail                     -8.7%
                                                       4.0                   3.8           2.9                                                                                       830
                                                                                                    2.6                                                                                          underlying
                                                                                                                                                                     Wholesale                   growth1
 Q2 '18 Q3         Q4 Q1 '19 Q2                      Q2' 18       Q3         Q4      Q1' 19         Q2
                                                                                                                                                      102                           114
                                                                                                                                                    Q2 '18                       Q2 '19

          Churn rate                                            Customer Base
                                                                      k, Rounded numbers                                      ▪ ARPU growing 1% QoQ (consumer ARPU +2.1% QoQ). Both new and
                                                                                                                                actual clients ARPU returning to growth thanks to price increases,
                                                           31,748           -86            31,662                               selective repricing and upselling
                                                                          Not                                                 ▪ MNP further cooling down
         7.6%                                                9,492       Human              9,706
  6.0%            6.2%                                                    +214                                                ▪ Churn improving
                            5.2%
                                      4.3%                               Human                                                ▪ Kena net adds halving again QoQ (~50k net adds in Q2)
                                                                          -300
                                                           22,256          Calling   21,956                                   ▪ Customer base stable compared to Q1 thanks to M2M and reduced
                                                                           human                                                churn on calling lines. Human lines were impacted by anniversary of
                                                                        -230 vs -289                                            Q2 2018 aggressive promos pre-empting/responding to Iliad.
                                                                            in Q1                                               Market stability improving with exception of low end
 Q2 '18 Q3         Q4 Q1 '19 Q2                             Q1 '19                         Q2 '19
                                                                                                                              ▪ Lower sales of handsets with improved marginality

                 (1)   Underlying YoY growth rate: excluding mobile termination rates reduction and accounting adjustments for pre-paid cards mismatch in Q2’18                             Q2 ’19 Results
                                                                                                                                                                                                              7
Q2 ’19 Domestic Mobile
5G launched in July consistently with quality approach and ROIC enhancing priority
                                New services                                                                 Coverage
               Business                              Consumer
                                                                                     Full national coverage
                                                                                             By 2025

                                                                                         4 Years ahead
   ▪   Private wireless networks        ▪     Multivideo 4k
                                                                                       of previous plan thanks to
   ▪   Smart City                       ▪     Cloud gaming
                                                                                      Inwit, Vodafone partnership
   ▪   Smart Manufacturing              ▪     eTourism

                                                                                5G
   ▪   Automotive                       ▪     Immersive sport experience

                      Premium price offering                                                    Infrastructure sharing
           4G                   5G
                                                                                                                             Towers
                +150%                                 Mobile prices are on an        Passive
                                     49.99€
                                                     upward trend since year         sharing                                            CAPEX
            +50%                                     end 2018, with new TIM’s                       ~ 11k towers    ~ 11k towers
                                                                                                                                          and
                      29.99€                          5G offering raising the                                                            OPEX
          19.99€
                                                         bar from 3Q’ 19                                                                Savings
                                                                                      Active
           40GB        50GB          100GB                                           sharing     TIM on Vodafone’s  Vodafone on
         150 Mbps      2 Gbps        2 Gbps                                                          antennas      TIM’s antennas

                                                                   ROIC enhancing approach
                                                                                                                                      Q2 ’19 Results
                                                                                                                                                       8
Q2 ’19 Domestic Mobile
TIM - Vodafone partnership ticks all boxes and generates > €150m synergies p.a.

                                   FASTER 5G                             WIDER 5G                        ENHANCED
                                   ROLL-OUT                              COVERAGE                        4G/5G CAPACITY
  OPERATING
   BENEFITS              Planned coverage achieved 4           5G full national coverage               Sharing 4G nodes
                                years ahead                        reached by 2025

                             TIM’s direct cash flow benefits                   Access to INWIT’s improved cash generation
                                                                                   Additional EBITDA
                             Cumulated
                              10 years                 >€ 800m                     run rate at INWIT          ~€ 200m
                                                                                        @ 2026
  FINANCIAL
   BENEFITS
                         Cash flow benefits                                          TIM pro quota
                         (average per year)            >€ 80m                           (37.5%)                ~€ 75m

                                                                    >€ 150m

                                                                                                                   Q2 ’19 Results
                                                                                                                                    9
Q2 ’19 Domestic Wireline
Fixed service revenues +2.2% YoY excluding Sparkle (+1.8% in Q1)
                                                                                                Wireline Revenues
                                                                    Organic data, €m

                                                                                       2,597            -0.4%            2,586
  ▪ Retail down -0.5% due to:
                                                                                                       Service                            Equipment
     ▪ Consumer service revenues down -1.4% as line losses not                         2,462                             2,416
       fully offset by ARPU increase (lower help from activation                                        -1.9%
       fees vs. Q1)                                                                                +2.2% excl. Sparkle

     ▪ Business service revenues benefitting from premium pricing
       and unique distribution (+0.7%)
                                                                                       1,618                             1,610
     ▪ ICT services steady growth (+15.7% YoY)                                                         Retail
                                                                                                       -0.5%

  ▪ Domestic Wholesale up 11.4% thanks to strong commercial
    performance and new tariffs approved by AGCOM (1)

  ▪ Sparkle’s International Wholesale revenues down -29.4%                              510       Domestic Wholesale
                                                                                                                          568
    following strategy revision, with positive impact on EBITDA                                         +11.4%
    (+16.7% YoY growth in Q2) due to lower bad debt                                                 Int’l Wholesale
                                                                                        327                               231
                                                                                                        -29.4%
                                                                                       Q2 '18                            Q2 '19

            (1)   To be published                                                                                                 Q2 ’19 Results
                                                                                                                                                      10
Q2 ’19 Domestic Wireline
ARPU growth benefitting from FTTx conversion; still supported in Q2 by pricing dynamics
                                            Wireline KPIs
                                                                                                                   Migration to fiber continues: 6.3m lines reached, +5.6% QoQ and
                                                                                                  Lines x 1,000    +45% YoY although Q2 focus was on migrating voice only to ADSL
            Total Accesses (1)
                                                                        FTTx Accesses                             ▪ Retail line losses were 346k in Q2 ’19, due to higher clean-up
      17,969               -360         17,609
                                                                                                                    activity vs. Q1 (stricter disconnection policy discipline to optimize
                                                                         5,961 +336            6,297                credit management introduced in Q1)
                           Retail
       9,876                              9,530                                                                   ▪ Broadband net adds back to growth, thanks to push on voice only
                            -346
                                                                         3,345        +83      3,428                customers
                                                                         2,616 +253 2,869                         ▪ Wholesale lines see continuous migration to fiber (+253k VULA)
                         Wholesale                                                                                  offsetting disconnections on lower ARPU copper lines (-249k ULL,
           8,093                          8,079
                              -14                                       Q1 '19                 Q2 '19               down QoQ) with strong benefit on revenues (VULA priced >50%
                                                                                                                    above ULL)
       Q1 '19                            Q2 '19

   Broadband net adds                                                          ARPU                                ▪   ARPU consumer at 35.7 €/month, growing 8.3% YoY.
                 lines x 1,000                                             € / line / month

                                                                               35.5     35.6   35.7 Consumer
                                                                                                                       Continuous growth of broadband ARPU (+17.2% yoy) driven by
                                                                33.0    34.9
                                           60            32.6
                                                                                                     +8.3%YoY
                                                                                                                       2018 repricing and upselling of “beyond connectivity” services
                                                                                                    Broadband      ▪   Market discipline 2019: competitors reducing price gap vs. TIM’s
                                                                               28.0     29.0   29.6 +17.2% YoY
                                                         24.9   25.2    27.1                                           premium positioning: repricing of existing client base in July and
                                                                                                                       August by main competitors
  Q2 '18    Q3           Q4    Q1 '19     Q2           Q1 '18 Q2        Q3     Q4 Q1 '19 Q2

                   (1)    On TIM infrastructure, retail VoIP excluded                                                                                                      Q2 ’19 Results
                                                                                                                                                                                            11
Q2 ’19 Domestic Wireline
Fix the fixed: pulling all levers

                                                        ▪   Premium positioning: the best technology at the max speed
                                                        ▪   Modular offering with valuable adds-on: security, entertainment, smart home,
                                                            assistance, voice designed for upselling
   New         TIM SUPER
 offering                                               ▪   1st Year in promo and 2nd year price increase “embedded”
                                                        ▪   ARPU from 2nd year, +14/17% vs previous offering
                                                        ▪   Bad-debt-proof: bank account direct debit or €100 deposit

                    ▪ Back to positive net BB adds in Q2 (+60k)                                   ▪ TIM Flexy: value for money offer targeting
   Broadband                                                               Geo-marketing            2nd homes
                    ▪ Pushing migration of voice only customers to
      push                                                                   approach
                      broadband                                                                   ▪ Local promos in selected cities
                   AGCOM access market analysis envisages:                                        ▪ New FWA offer in Q3-Q4 in municipalities
                                                                                 FWA
    Expected       ▪ Withdrawal of the ban for network technicians                                  with high market potential and no fiber
                                                                                launch              coverage
 improvement in      to sell to TIM retail customers, leading to
   regulatory        additional staff for upselling services and
                                                                             Distribution         ▪ Improving key technical and commercial
   framework         products to the current TIM customer base
                                                                              processes             processes with the aim of enhancing
                   ▪ Withdrawal of ex ante test on NGA flagship               tightened             customer satisfaction and reducing churn
 and incremental     products
                                                                           Strong push on
   sales force     ▪ Reduction of the notice period from 30 to 20             premium
                     days on offers that remain subject to replicability       content
                     test ex ante

                                                                                                                                      Q2 ’19 Results
                                                                                                                                                       12
Q2 ’19 Domestic Wireline
TIMVISION content strategy: a new football/sports proposition

                                 kit Sport                                Distribution through set-top box

                                    ticket sport

              7                                           5

                                                                                                            Co-marketing Agreement
                           OTHER SPORTS
                   F1, MotoGP, Tennis (Wimbledon, ATP
                  Masters 1000), Basket FIBA 2019 World
                        Cup, Golf, Rugby, Athletics
          2
                                                                      Streaming of free-to-air channels (including some Champions League
                                                                                       matches) plus 7 days “catch-up TV”
                    Bundle NowTv + TIMVISION

                                Content strategy to increase fixed arpu and decrease churn rate
                                                                                                                              Q2 ’19 Results
              #   Number of matches per matchday                                                                                               13
Q2 ’19 Domestic OPEX
Cost reduction moving forward, focus remains on cash impact
                                                                                                                                                  OPEX
  OPEX on a reduction path at €2,023m, down €129m YoY
                                                                                                          Organic data, €m
  (-6%)                                                                                                                                                                  Net of deferred
  Net of deferred costs, on a cash view, the reduction                                                                                   Q2 ’18            Q2 ’19            costs (1)
  reaches €204m (-9% YoY)
                                                                                                               OPEX                       2,152    -6%      2,023           -9%       -205
                                                                                                                                                  (-129)

  ▪   Interconnection & equipment: benefiting from new                                                          Interconnection            377
      strategy for Sparkle and for lower mobile subsidies                                                                                         -28%       273           -28%       -104

  ▪   Commercial: commissioning costs rationalized (-31%                                                        Equipment
                                                                                                                                          391     -29%       277           -29%       -113
      fall YoY), caring optimization through digital channels
                                                                                                                CoGS
  ▪   Industrial: increased productivity in assurance and                                                                                  98                122
                                                                                                                                                  24%                      +24%        +24
      lower energy consumption. However higher YoY
                                                                                                                Commercial                                   399
      energy cost negotiated in 2018 weigh €15m in Q2                                                                                      397     1%                       -8%        -35
  ▪   G&A: lower cost of utilities and consulting                                                               Industrial
                                                                                                                                          242     14%        277            +1%         +4
  ▪   Labour: limited reduction due to one off release of
      provisions for unused holidays (€23m) adding to lower                                                     G&A                       124      -7%       116
                                                                                                                                                                            -8%        -15
      capitalization                                                                                                         (2)
                                                                                                                Labour
  ▪   Other: Q2 2018 benefited from liability reversal and                                                                                548      -1%       544            -1%         -6
      rebates (~€35m)                                                                                           Other                                               15
                                                                                                                                   -26                                                 +41

             (1)   Net of deferred costs, total OPEX amounts to € 2,284m in Q2’18 and € 2,079m in Q2’19                                                                    Q2 ’19 Results
             (2)   Net of capitalized labour cost                                                                                                                                            14
Q2 ’19 TIM Brasil
TIM Brasil improves performance amid external challenges
Organic data, R$m, Rounded numbers

                                                    Q2 ’18                Q2 ’19

                                                                                               Improvement in top line thanks to fixed and postpaid, with
                                   Total             3,968       +2.4%    4,063                efficiency plan guaranteeing solid growth and margin expansion
     SERVICE                                                                                   despite though competition and adverse macro
     REVENUES
                                  Mobile                 3,768   +1.9%    3,839

                                                                                               ▪   Service revenues up 2.4%, with MSR +1.9% YoY and FSR +
                                                                                                   11.8% YoY driven by TIM Live ARPU and CB increase
     EBITDA                                              1,508   +6.3%    1,603                ▪   EBITDA growing solidly 6.3% YoY to reach R$ 1.6 bln in Q2.
                                                                                                   EBITDA margin now standing at 37.6% (+1.4 p.p.)

                                                                                               ▪   Solid network development: FTTH coverage grew 3.8 times in
                                                                                                   a year, reaching 1.6 mln households(1)
     EBITDA-                                                                                   ▪   MOU with Vivo and use of 5G technologies to increase assets
                                                          527    +24.9%    658
     CAPEX                                                                                         efficiency

         TIM Live Revs                                                        TIM Live CB                            Postpaid Net Adds           Mobile ARPU
                                                TIM Live ARPU                                  FTTH coverage
          R$ 115 mln                                                             topped
         >30% growth
                                                   R$ 78.0
                                                                              500k clients
                                                                                                > 1.560k HH (1)         +748k in Q2                R$ 23.2
                                                  +7.8% YoY                                        reached             (CB: 21.3 Mln)             +5.8% YoY
        for 10 quarters                                                    with ~20% in FTTH

                    (1)   Addressable HH ready to sell                                                                                             Q2 ’19 Results
                                                                                                                                                                    15
Q2 ’19 TIM Brasil
TIM Brasil’s new TAX asset: R$3.4 Bn implying c. €0.8bn debt reduction in 3/4 years

      Apr. 2017                            Q4’ 18                               Q2’ 19                          Q3’ 19
   Leading case:
   Favorable decision                  R$ 353m                             R$ 2,876m                           R$ 189m                    R$ 3,418m (1)
                                   Booked after final                    Booked after final                 Final court decision.        Gross tax credits
                                    court decision:                       court decision:                      To be booked:
                                       TIM NE                                TIM CEL                              TIM CEL

                                                                                                                                    To be used in ~3/4 years (2)
   In 2017 Brazilian Supreme Court stated that ICMS (State Tax) cannot be
                                                                                                                                    Now booked in NWC it will
   included in the calculation basis of PIS and COFINS (Federal Tax).                                                               gradually improve net debt
                                                                                                                                            when used
   PIS/COFINS are levied on revenues and the Supreme Court stated that
   ICMS cannot be considered a revenue.

            (1)   Monetary correction recognition will increase until the compensation of the tax credits                                                Q2 ’19 Results
            (2)   In 2018, company paid ~R$ 880m of PIS/COFINS                                                                                                            16
H1 ’19 TIM Group
Net Debt reduction accelerating: -€539m in H1, o/w -€349m in Q2
€m; (-) = Cash generated, (+) = Cash absorbed, excluding call-outs

                                EBITDA                                          1,792
                                CAPEX                                           (607)                           EBITDA                            2,273
                                ΔWC & Others                                    (644)                           CAPEX                             (874)
                                Operating Free Cash Flow                            541                         ΔWC & Others                      (450)
                                                                                                                Operating Free Cash Flow           949

                                                                                                                       -349
                                                                                                                                           -539

         FY ’18            OFCF           Financial            Cash        Dividends &     Other    Q1 ’19     OFCF    Financial   Cash     Dividends &    Other   H1 ’19
        Net Debt                          Expenses             Taxes        Change in     Impacts   Net Debt           Expenses    Taxes     Change in    Impacts Net Debt
                                                                              Equity                                                           Equity
          FY ’17                                                                                                                   -167                                 H1 ’18

          25,308             17                 335                  24        --          (147)     25,537    (903)      330        13           211      (47)          25,141
    Δ       (38)           (558)                (39)                 (5)      +25          +158       (457)    (46)       (16)      (10)          +5       +114           -410

                                                                                                                                                                  Q2 ’19 Results
                                                                                                                                                                                   17
H1 ’19 TIM Group
CAPEX and Net Operating Working Capital under control
                              CAPEX                                              Net Operating Working Capital
  Organic data, €m                                                                        H1 ’18                               H1 ’19
             Group     930                                                                  Non     Op.WC net
                                -6.0%       874                             €m
             Brazil     224      -3.7%       215                                         recurring non recurring
                                                                                 Op.WC     items      items
         Domestic       705      -6.5%       659
                                                               GROUP
                      Q2 ’18               Q2 ’19

   Group recurring NWC improving €608m yoy                                                                            +608
                                                                                                                   o/w +42 in Q2
   ▪    Domestic improving €762m YoY in H1 and €42m
        in Q2 driven by lower inventories (+€104m), VAT
        impact from split payment in Q1 ’18 (+€282m),
        change from billing in advance to billing in arrears   DOMESTIC
        in Q1 ’18 (+€182m) and higher trade payables
        (+€100m)
                                                                                                                      +762
   ▪    TIM Brasil worsening €167m YoY mainly driven by                                                            o/w +41 in Q2
        higher trade receivables for costumer base
        repositioning (more post paid)

   NWC improving €156m YoY including one offs                  TIM BRASIL
   ▪    Domestic provisions help NWC €278m YoY
                                                                                                                       -167
   ▪    Brazilian tax credit inflates NWC €662m YoY
        (€610m net of Brazilian provisions)                                                                        o/w -13 in Q2

                                                                                                                                   Q2 ’19 Results
                                                                                                                                                    18
Q2 ’19 TIM Group
Liquidity margin – After Lease view – Cost of debt ~3.7%, -0.1pp QoQ, -0.3pp YTD
€m

                                                                                                                                                                                                                           (2)
                                                                                                                                                                                             10,303            25,139

                Cost of debt: ~3.7%
                                                                                                                                                                                              10,200

                                                                                                                                                                      3,499
                                                                                                                                                                                               103              21,081
                                                                                                                                                2,771                  3,318
                                                                                                                                                                        181
                                                                                                                         4,187                  2,418
         7,703 (1)                                   Covered until 2021                                                                          353
          2,703                                                                                                           3,085
                                                                                                   1,928
                                                                                                                          1,102
                                                                            1,910                   564
                                                                                                   1,364
         5,000                                                                                                                                                                                                   4,058
                                                       541                   1,496
                                                       541                    414
             1 margin
     Liquidity                                    Within 2019               FY 2020               FY 2021                FY 2022               FY 2023                FY 2024               Beyond 2024    Total M/L Term
      Liquidity                                                                                                                                                                                                 Debt
       Margin
                                                                                                                               Debt Maturities

                       Cash & cash                              Undrawn portions of
                                                                                                                     Bonds                                   Loans
                       equivalent                               committed bank lines

              (1)   Includes € 490 mln repurchase agreements that will expire within August 2019
              (2)   €25,139m is the nominal amount of outstanding medium-long term debt. By adding the balance of IAS adjustments and fair value valuations (€514m) and current financial                 Q2 ’19 Results
                    liabilities (€831m), the gross debt figure of €26,484m is reached                                                                                                                                            19
Q2 ’19 TIM Group
Net Income +19.8% yoy
Reported data, €m, Rounded numbers

                                                                             Domestic provisions                      (244)

                                                                             Brasil (ICMS exclusion from PIS/COFINS    610
                                                                             tax base, net of Brazilian provisions)

      Q2 ‘19

                          EBITDA        Non       EBITDA    Depreciation &   EBIT      Net Interest       Taxes       Net Income   Minorities       Net Income
                          Organic    recurring   Reported    amortization                & Net                           ante                        Reported
                                       items                   & Other                  Income/                       Minorities
                                                                                         Equity

      Q2 ‘18               1,958       (26)       1,940        (1,066)       874           (361)          (141)           372         (39)                 333

          D                 (51)       +392        +333          (21)        +312           +41            (153)         +200         (134)                +66

                                                                                                                                                Q2 ’19 Results
                                                                                                                                                                 20
Q2 ’19 TIM Group
After Lease view shows slightly better trends yoy
                                   EBITDA After Lease                                                                         Net Debt After Lease
                                         Group                                                                                       Group
€m, organic                                                                                          €m, reported
                                                                            (-2.6%)                                                                          (539)
                                               (-1.4%)                                                                                   (504)
   1,958         (107)                                                                                 25,270       (1,948)                                 1,913     24,731
                                    1,851                 1,826            81              1,907                              23,322             22,818

    Q2 ’18 Depreciation Q2 ’18                             Q2 ‘19 Depreciation Q2 ‘19                  Net Debt      IAS17    Net Debt           Net Debt   IAS17     Net Debt
   EBITDA / Financial   EBITDA                            EBITDA / Financial EBITDA                     FY ’18                  AL                 AL                  H1 ’19
            expenses                                               expenses
             (IAS 17)     AL                                AL      (IAS 17)                                                   FY ’18             H1 ’19

                                            Domestic
€m, organic
                                                                             (-4.4%)                     Under the After Lease view, results show slight
                                                (-3.3%)
                                                                                                         improvements vs. the IFRS 9/15 view:
   1,618           (91)             1,527
                                                          1,477            69              1,546
                                                                                                         ▪   Group EBITDA-AL –1.4% YoY
                                                                                                         ▪   Domestic EBITDA-AL –3.3% YoY
                                                                                                         ▪   Group Net Debt AL at €22,818m with a reduction of
                                                                                            Q2 ‘19
    Q2 ‘18       Depreciation /
              Financial expenses
                                     Q2 ‘18                 Q2 ‘19       Depreciation /
                                                                      Financial expenses
                                                                                           EBITDA
                                                                                                             €504m from December 2018
   EBITDA          (IAS 17)        EBITDA-AL              EBITDA-AL        (IAS 17)

                                                                                                                                                             Q2 ’19 Results
                                                                                                                                                                                 21
Q2 ’19 Results

1      Highlights

2      Main Trends and Financial Update

3      Closing Remarks

4      Q&A

                                          Q2 ’19 Results
                                                           22
Q2 ’19 TIM Group
Key Take-aways

        ▪    We are delivering on time and de-levering fast

        ▪    Return on invested capital remains our key priority

        ▪    Organic action remains focused on:
                    • Revenues stabilization
                    • Cost cutting, including risk
                    • Stopping NWC outflows
                    • Invested capital optimisation

        ▪    We are committed to provide additional upside through more inorganic action

        ▪    Guidance unchanged

                                                                                     Q2 ’19 Results
                                                                                                      23
Outlook
Guidance IFRS 9/15 and After Lease unchanged

                                                                Group                                                             Domestic                                                           Brasil
   YoY growth rates
                                                 2019                           2020-’21                               2019                          2020-’21                               2019                   2020-’21

 Organic                                  Low single digit                  Low single digit                    Low single digit                                                                               Mid single digit
                                                                                                                                                  Almost stable                 +3% - +5% (YoY)
 Service revenues                           decrease                           growth                             decrease1                                                                                        growth

                                                                                                                   Low to Mid                                                       Mid to High            EBITDA margin
 Organic                                  Low single digit                  Low single digit                                                      Low single digit
                                                                                                                   single digit                                                     single digit             ≥ 39% in ‘20
 EBITDA-AL                                  decrease                           growth
                                                                                                                    decrease
                                                                                                                                                     growth
                                                                                                                                                                                   growth (YoY)          ≥ 40% pre IFRS 9/15

                                                                                                                         ~EUR 2.9 bn / Year                                                   ~R$ 12 bn cumulated
 CAPEX                                                               --
                                                                                                                     ~EUR 3 bn / Year pre IFRS 9/15                                          ~R$ 12.5 bn pre IFRS 9/15

                                                     Cumulated ~EUR 3.5 bn
 Eq FCF                                    To be enhanced through inorganic actions                                                        --                                                           --
                                                    presently not included

 Adjusted                                         ~EUR 20.5 bn by 2021                                                                     --                                                           --
 Net Debt AL                                    ~EUR 22 bn pre IFRS 9/15 (2)

              (1) Domestic revenue growth excluding Sparkle’s zero-low margin voice traffic business stopped (no impact on EBITDA; Sparkle EBITDA actually grew 18% YoY in H1)                               Q2 ’19 Results
              (2) Guidance provided last February under old principles includes debt reduction from finance leases reimbursement, which remains but is not visible in an After Lease view                                         24
              - Figures @ avg. Exchange Rate of 4.31 Reais/Euro
Q2 ’19 Results

1      Highlights

2      Main Trends and Financial Update

3      Closing Remarks

4      Q&A

                                          Q2 ’19 Results
                                                           25
Annex

        26
Annex
Liquidity margin – IFSR 9/15 view – Cost of debt -0.1pp QoQ, -0.4pp YTD
€m

                                 Cost of debt: ~4.0%*                                                                                                                                           (2)
                                                                                                                                                                  11,428            27,035
                                                                  * Without IFRS 16

                                                                                                                                                                   10,200

                                                                                                                                                  3,625             103              21,081
                                                                                                                                                                   1,125
                                                                                                                               2,901               3,318
                                                                                                                                                    181
                  (1)                                                                                      4,315               2,418                127
          7,703                                Covered until 2021                                                               353
                                                                                                            3,085               131
          2,703                                                                        2,083
                                                                                                            1,102
                                                                    2,068                564
                                                                                        1,364                                                                                         4,058
          5,000                                  614                                                         128
                                                                     1,496               154
                                                  540        74       414                                                                                                             1,896
     Liquidity margin                         Within 2019
                                                                      158
                                                                    FY 2020            FY 2021             FY 2022            FY 2023             FY 2024        Beyond 2024    Total M/L Term
        Liquidity                                                                                                                                                                    Debt
         Margin
                                                                                                                Debt Maturities

                        Cash & cash                      Undrawn portions of
                                                                                                       Bonds                              Loans                     Leases
                        equivalent                       committed bank lines

                  (1) Includes € 490 mln repurchase agreements that will expire within August 2019                                                                             Q2 ’19 Results
                  (2) € 27,035m is the nominal amount of outstanding medium-long term debt. By adding the balance of IAS adjustments and fair value valuations                                        27
                      (€ 531m) and current financial liabilities (€ 831m), the gross debt figure of € 28,397m is reached
Annex
Well diversified and hedged debt
€m

                                                                                                                                                    Maturities and Risk Management
                 Lease liabilities
                      5,519                                          Banks & EIB
                                                                        4,862                                                                    Average m/l term maturity:
                                            17.2% 15.2%
                   Other                 1.4%
                                                                                                                                                7.7 years (bond 7.8 years only)*
                    445
                                                                              Bonds
                                                   66.2%                                                                              Fixed rate portion on medium-long term
                                                                              21,177
                                                                                                                                              debt approximately 70%

          Gross debt                                                                    32,003                                            Around 25% of outstanding bonds
          Financial Assets                                                              (3,675)                                         (nominal amount) denominated in USD
           of which C&CE and marketable securities                                        (2,704)
            - C & CE                                                                      (1,700)
                                                                                                                                             and GBP and is fully hedged
            - Marketable securities                                                       (1,004)
               - Government Securities                                                      (567)
               - Other                                                                      (437)

          Net financial position (with IFRS 16)                                        28,328                                               Cost of debt: ~4.0%* including
          Net finance leases (IFRS 16)                                                    (3,597)                                              cost of finance leasing
          Net financial position                                                      24,731                                                                                     * Without IFRS 16

N.B. The figures are net of the adjustment due to the fair value measurement of derivatives and related financial liabilities/assets, as follows:
- the impact on Gross Financial Debt is equal to € 1,975m (of which € 327 m on bonds);
- the impact on Financial Assets is equal to € 1,279m.
Therefore, the Net Financial Indebtedness is adjusted by € 696m
                    N.B. The difference between total financial assets (€ 3,675m) and C&CE and marketable securities (€ 2,704m) is equal to € 971m and refers to positive MTM
                    derivatives (accrued interests and exchange rate) for € 798m, financial receivables for lease for € 113m and other credits for € 59m                             Q2 ’19 Results
                                                                                                                                                                                                      28
Annex
Change in financial reporting: a reminder of key impacts

                                                              Reporting 2018                                    New Reporting                                               Unità di misura (100
                                                                                                                                                           1    New revenues
                                                         Pre            D          Post       DNewRevs
                                                                                              DNewRep                                           "After          reporting
              2018FY € Bn                             IFRS 9/15                  IFRS 9/15
                                                                                              Reporting
                                                                                                DIFRS16
                                                                                                           IFRS 16     D IFRS16       D IAS17                                            1000
                                                                     IFRS 9/15
                                                                                               D IFRS 16                                        lease"          no impact on total
                                                                                                  1                                                             revenues
                             Domestic                         15.2     -0.2           15.0                     15.0                                15.0
                                o/w Services                  13.8     -0.2            13.7      -0.3           13.4                                13.4
     REVENUES
                             Brasil                           4.0      -0.0            3.9                      3.9                                 3.9    2o   IFRS16 impacts OPEX
                             Group                            19.1     -0.2           18.9
                                                                                                   2
                                                                                                               18.9                                18.9         (operating leases
                                                                                                                                  3
                                                                                                                                                                removed) and Net
                             Domestic                          6.6     -0.3            6.4      +0.4            6.7      -0.4          -0.3         6.0
       EBITDA                                                                                                                                                   Debt (operating leases
                             Brasil                            1.5     -0.0            1.5      +0.3            1.8      -0.3          -0.1         1.4
       organic                                                                                                                                                  liabilities added)
                             Group                             8.1     -0.3            7.8      +0.7            8.5      -0.7          -0.4         7.4

                             Domestic                          6.2     -0.3            6.0      +0.4            6.4      -0.4          -0.3         5.6    3o   For “After Lease”
       EBITDA                                                                                                                                                   view, both IAS17 and
                             Brasil                            1.5     -0.0            1.5      +0.3            1.8      -0.3          -0.1         1.4
       reported                                                                                                                                                 IFRS16 effects are
                             Group                             7.7     -0.3            7.4      +0.7            8.1      -0.7          -0.4         7.0
                                                                                                                                                                removed and all
                             Domestic                          3.2     -0.1            3.1                      3.1                                  3.1
                                                                                                                                                                leases reclassified as
      CAPEX
                             Brasil                            0.9     -0.0            0.9                      0.9                                 0.9
                                                                                                                                                                OPEX.
    ex spectrum
                             Group                             4.2     -0.1            4.0                      4.0                                 4.0
                                                                                                                                                                Net Debt is net of all
      Net Debt               Net Debt                         25.3                    25.3      +3.6           28.9      -3.6          -1.9        23.3         lease liabilities
        (Group)              Debt / EBITDA                    3.1x                     3.2x                     3.4x                                3.1x

(1) Equipment in the new reporting includes Handsets bundle

                                                                                                                                                                         Q2 ’19 Results
                                                                                                                                                                                          29
Annex
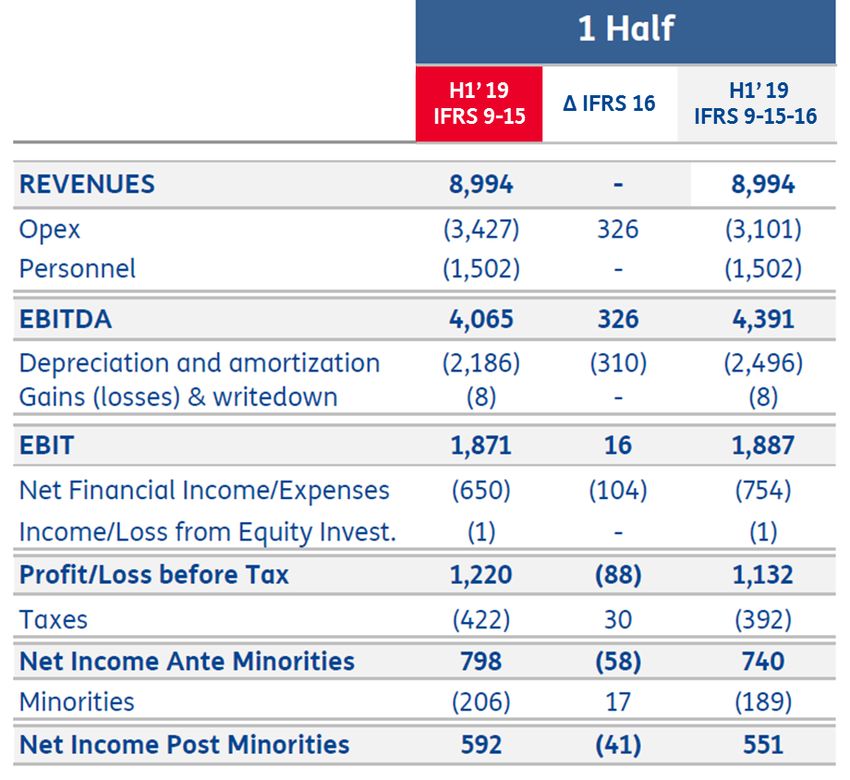
TIM Group - Main Results (IFRS 16)
Reported, €m

                             Revenues                   Service Revenues                          EBITDA
                                Δ                                 Δ                                 Δ
                   H1’ 19               H1’ 19        H1’ 19              H1’ 19        H1’ 19              H1’ 19
                              IFRS                              IFRS                              IFRS
                 IFRS 9-15           IFRS 9-15-16   IFRS 9-15          IFRS 9-15-16   IFRS 9-15          IFRS 9-15-16
                               16                                16                                16

     TIM Group    8,994        -        8,994        8,227       -        8,227        4,065      326       4,391
     Domestic     7,069        -        7,069        6,386       -        6,386        2,749      180       2,929
        Brazil    1,946        -        1,946        1,862       -        1,862        1,321      146       1,467

                                Δ                                 Δ                                 Δ
                   Q2 ’19               Q2 ’19        Q2 ’19              Q2 ’19        Q2 ’19              Q2 ’19
                              IFRS                              IFRS                              IFRS
                 IFRS 9-15           IFRS 9-15-16   IFRS 9-15          IFRS 9-15-16   IFRS 9-15          IFRS 9-15-16
                               16                                16                                16

     TIM Group    4,523        -        4,523        4,142       -        4,142        2,273      172       2,445
     Domestic     3,567        -        3,567        3,231       -        3,231        1,302       93       1,395
        Brazil     967         -         967          922        -         922          974        80       1,054

                                                                                                            Q2 ’19 Results
                                                                                                                             30
Annex
After Lease view shows slightly better trends – H1 view
                                   EBITDA After Lease                                                                         Net Debt After Lease
                                         Group                                                                                       Group
€m, organic                                                                                          €m, reported
                                                                            (-2.3%)                                                                          (539)
                                               (-1.6%)                                                                                   (504)
   3,823         (205)                                                                                 25,270       (1,948)                                 1,913     24,731
                                    3,618                 3,560           173              3,733                              23,322             22,818

    H1 ’18 Depreciation H1 ’18                             H1 ‘19 Depreciation H1 ‘19                  Net Debt      IAS17    Net Debt           Net Debt   IAS17     Net Debt
   EBITDA / Financial   EBITDA                            EBITDA / Financial EBITDA                     FY ’18                  AL                 AL                  H1 ’19
            expenses                                               expenses
             (IAS 17)     AL                                AL      (IAS 17)                                                   FY ’18             H1 ’19

                                            Domestic
€m, organic
                                                                             (-4.2%)
                                                (-3.4%)                                                Under the After Lease metric, results show slight
   3,160          (171)                                                                                improvements vs. the IFRS 9/15 view:
                                    2,989                                                  3,027
                                                          2,888           139
                                                                                                       ▪    Group EBITDA-AL -1.6% YoY
                                                                                                       ▪    Domestic EBITDA-AL -3.4% YoY
                                                                                                       ▪    Group Net Debt AL at €22,818m with a reduction of
    H1 ‘18       Depreciation /      H1 ‘18                 H1 ‘19       Depreciation /     H1 ‘19
   EBITDA
              Financial expenses
                   (IAS 17)        EBITDA-AL              EBITDA-AL
                                                                      Financial expenses
                                                                           (IAS 17)
                                                                                           EBITDA           €504m from December 2018

                                                                                                                                                             Q2 ’19 Results
                                                                                                                                                                                 31
Annex
TIM Group – P&L (IFRS 16)
Reported, €m

                            Q2 ’19 Results
                                             32
Annex
Liquidity margin – IFRS 16 view – Cost of debt -0.1pp QoQ
€m, IAS 17 included

         33000                                                                                                                                                                                         (2)
                                                                                                                                                                           12,847            30,625

         28000
                                          Cost of debt: ~4.3%*
                                                                  * Including cost of all leases
                                                                                                                                                                            10,200
         23000

                                                                                                                                                                             103              21,081
                                                                                                                                                               3,916        2,544
         18000

                                                                                                                                            3,240              3,318
                                                                                                                                                                181
         13000                                                                                                                              2,418               417
                                                                                                                         4,679
                                                                                                                                             353
                                   (1)                                                                                                       469
                          7,703                                 Covered until 2021                                       3,085
          8000
                                                                                                      2,486              1,102                                                                 4,058
                           2,703                                                                       564
                                                                                       2,554          1,364               492
          3000            5,000                                  903              1,496                558                                                                                     5,486
                                                                                   414
                                                                 540          362
                                                                                   644
         -2000        Liquidity
                      Liquidity margin                       Within 2019              FY 2020        FY 2021            FY 2022             FY 2023            FY 2024    Beyond 2024    Total M/L Term
                                                                                                                                                                                              Debt
                       Margin
                                                                                                                         Debt Maturities

                               Cash & cash                        Undrawn portions of
                                                                                                                Bonds                              Loans                   Finance Leases
                               equivalent                         committed bank lines

                           (1) Includes € 490 m repurchase agreements that will expire within August 2019                                                                            Q2 ’19 Results
                           (2) € 30,625m is the nominal amount of outstanding medium-long term debt. By adding the balance of IAS adjustments and fair value valuations                                      33
                               (€ 547m) and current financial liabilities (€ 831m), the gross debt figure of € 32,003m is reached
For further questions please contact the IR Team

                                  Investor Relations Contact Details

              Phone                                                                   Contact details for all
                                                  E-mail                              IR representatives:
        +39 06 3688 1
                                  Investor_relations@telecomitalia.it         www.telecomitalia.com/ircontacts
        +39 02 8595 1

                                                                                    TIM
             IR Webpage                        TIM Twitter
                                                                                    Slideshare
www.telecomitalia.com/investors   www.twitter.com/TIMNewsroom           www.slideshare.net/telecomitaliacorporate

                                                                                                                    34
You can also read