Revolutionizing the way sleep disorders are diagnosed and managed - Investor Presentation August 13, 2020 - Investor Relations

Page created by Martha Doyle
 
CONTINUE READING
Revolutionizing the way sleep disorders are diagnosed and managed - Investor Presentation August 13, 2020 - Investor Relations
Revolutionizing the way
sleep disorders are
diagnosed and managed

Investor Presentation
August 13, 2020
Revolutionizing the way sleep disorders are diagnosed and managed - Investor Presentation August 13, 2020 - Investor Relations
Disclaimer

Itamar Medical Ltd. (the "Company") is furnishing this presentation and any information given during this presentation, solely for the consideration of eligible investors who have the
knowledge and experience in financial and business matters and the capability to conduct their own due diligence investigation in connection with the investment outlined herein.
Prospective investors are urged to conduct an independent evaluation of the Company.

This presentation does not constitute an offer or a solicitation to participate in any investment in the Company. This presentation does not constitute an offer to sell, or the solicitation
of an offer to buy, any of the securities of the Company in the United States or Israel. The offering of the Company’s securities (including all underlying securities thereof) has not
been, nor will it be, registered under the United States Securities Act of 1933, as amended (the “1933 Act”), any state securities laws, or Israeli securities laws and such securities
may not be offered or sold within the United States, or to, or for the account or benefit of, U.S. persons, except pursuant to an effective registration statement under the 1933 Act or
an applicable exemption from the U.S. registration requirements.

The statements in this presentation should not be regarded as a basis for an investment decision of any kind, or as recommendation or opinion, or a substitute for investor discretion.

Forward Looking Statements
This presentation contains forward-looking statements within the meaning of the "safe harbor" provisions of applicable securities laws. Statements preceded by, followed by, or that
otherwise include the words "believes", "expects", "anticipates", "intends", "estimates", "plans", and similar expressions or future or conditional verbs such as "will", "should", "would",
"may" and "could" are generally forward-looking in nature and not historical facts. For example, when we discuss growing appreciation within the cardiology community of the role of
WatchPAT, we are using forward-looking statements. Because such statements deal with future events, they are subject to various risks, uncertainties and assumptions, including
events and circumstances out of the Company's control and actual results, expressed or implied by such forward-looking statements, could differ materially from the Company's
current expectations. Factors that could cause or contribute to such differences include, but are not limited to, risks, uncertainties and assumptions discussed from time to time by the
Company in reports filed with, or furnished to, the Israel Securities Authority and the U.S. Securities and Exchange Commission. Except as otherwise required by law, the Company
undertakes no obligation to publicly release any revisions to these forward-looking statements to reflect events or circumstances after the date hereof or to reflect the occurrence of
unanticipated events.

The United States and Israeli securities laws prohibit any person who has material non-public information about a company ("Inside Information"), from purchasing or selling
securities of such company, or from communicating such information to any other person under circumstances in which it is reasonably foreseeable that such person is likely to
purchase or sell such securities. Statements in this presentation and in any information given during this presentation might be considered as Inside Information, in accordance with
the Securities Law. Therefore, any person aware of this presentation or of any information given during this presentation, may neither use, nor cause any third party to use, any
Inside Information or any other information provided in connection with the presentation, in contravention of the Securities Law or any such rules and regulations thereunder. The
Company, and its respective affiliates, employees and representatives expressly disclaim any and all liability relating to or resulting from the use of this presentation or any
information given during this presentation or such other information by a prospective investor or any of its affiliates or representatives.

* The contents of any website or hyperlinks mentioned in this presentation are for informational purposes and the contents thereof are not part of this presentation.

                                                                                                                                                                                                2
Revolutionizing the way sleep disorders are diagnosed and managed - Investor Presentation August 13, 2020 - Investor Relations
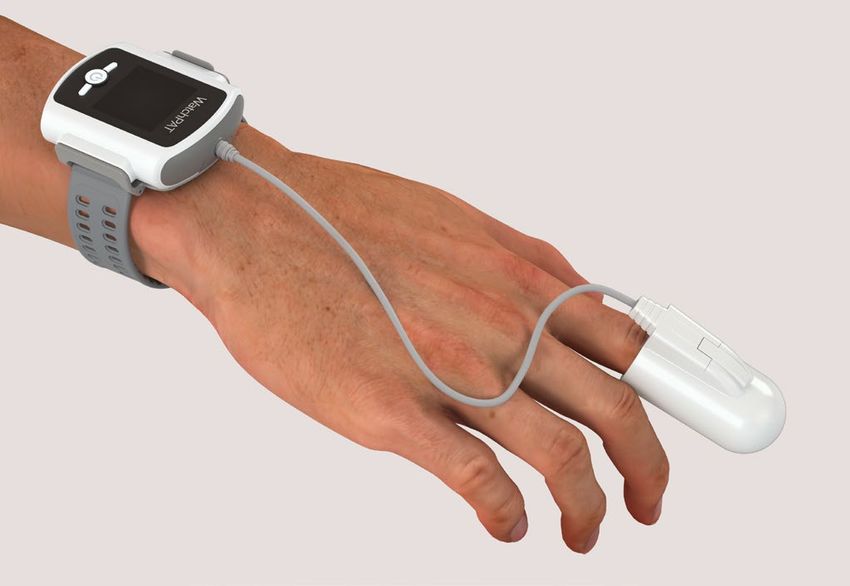
Investment Highlights

  DISRUPTIVE HOME-                              LARGE OPPORTUNITY                                 MULTIPLE GROWTH                  COMPELLING
  BASED SOLUTIONS                                    TO HELP                                         CATALYSTS                  FINANCIAL PROFILE

 Digital health platform with                   26% of adults worldwide                         Migration to home-based care   Public company on the TASE
                                                                       1
 home sleep apnea test                          suffer from sleep apnea                         and broader telehealth         since 2007
 (“HSAT”) solutions                                                                             adoption, accelerated by
                                                5M Tests in US market,                          recent events                  ADR shares traded on
 FDA approved and CE                            comprised of both PSG and                                                      NASDAQ since 2019
 Marked devices with                            home sleep apnea tests                          Expand access to cardiology,
 established CPT code                                                                           core sleep, and direct to      Consistent revenue growth:
                                                Multiple trends are propelling                  consumer channels              revenue of $31M in 2019 and
 Peripheral Arterial Tonometry                  the market, such as obesity                                                    revenue of $24M in 2018
 (PAT) incorporated in AASM’s                   and Cardiovascular Diseases                     International expansion
 2017 practice guidelines                                                                                                      $45M in cash & cash
                                                                                                                               equivalents2

         1. Increased Prevalence of Sleep-Disordered Breathing in Adults-American Journal of Epidemiology
         2. As of June 30, 2020                                                                                                                              3
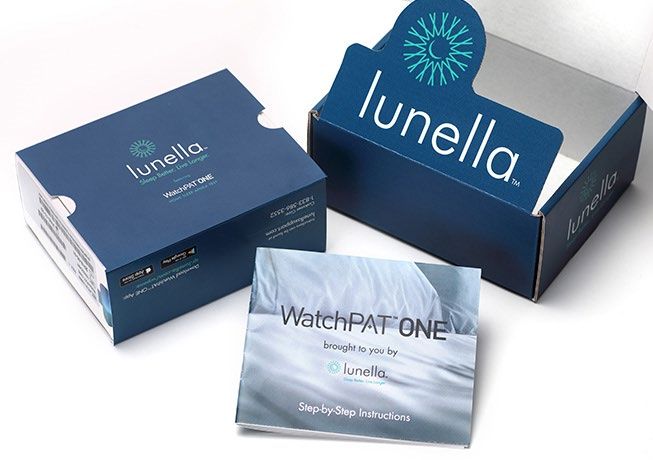
Revolutionizing the way sleep disorders are diagnosed and managed - Investor Presentation August 13, 2020 - Investor Relations
Vision and Mission

Our vision is become the world leader in sleep apnea management solutions
with a focus on additional care pathways

 Our Mission: to address the 80% undiagnosed and untreated Obstructive Sleep
 Apnea (OSA) patients through our digital health platform

                                                                               4
Revolutionizing the way sleep disorders are diagnosed and managed - Investor Presentation August 13, 2020 - Investor Relations
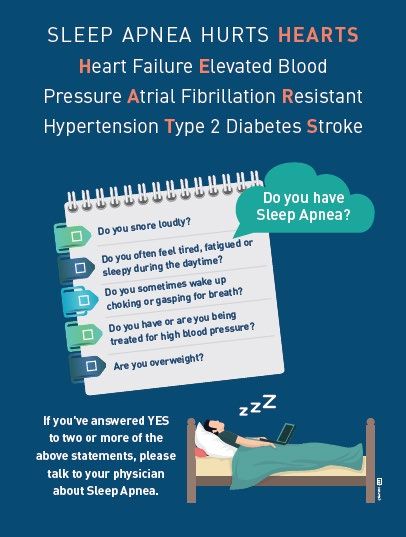
Sleep Apnea Impacts Many Adults Worldwide

26%1 of adults worldwide, including 54M2
in the US alone, suffer from sleep apnea                                                                    OBSTRUCTIVE SLEEP APNEA (OSA)
                                                                                                                  COMBORBIDITIES
About 80% of adults in the US are
undiagnosed                                                                                       Drug resistant hypertension                                                                 83%

   2x             Increased risk of stroke3
                                                                                                        Congestive heart failure                                                         76%

                                                                                                                                  Stroke                                                72%

   2x             Risk of death from sudden
                  cardiac arrest4                                                                                        Arrhythmias                                           58%

   5x             Risk of death from cardiovascular
                  disease5
                                                                                                                     Atrial fibrillation                                  49%

                                                                                                         Ischemic heart disease                                     38%

  42%             Increased risk of recurrence of
                  atrial fibrillation following ablation6

      1.   Increased Prevalence of Sleep-Disordered Breathing in Adults-American Journal of Epidemiology
      2.   "Estimation of the global prevalence and burden of obstructive sleep apnoea: a literature-based analysis” Lancet Respir Med 2019; 7: 687–98
      3.   Obstructive Sleep Apnea–Hypopnea and Incident Stroke-The Sleep Heart Health Study, Redline et al, American Journal of Respiratory and Critical Care Medicine Vol 182 2010;
      4.   Obstructive Sleep Apnea and the Risk of Sudden Cardiac Death Gami et al, J Am Coll Cardiol 2013:
      5.   Sleep Disordered Breathing and Mortality: Eighteen-Year Follow-up of the Wisconsin Sleep Cohort, young et al, SLEEP, Vol. 31, No. 8, 2008
      6.   Effect of Obstructive Sleep Apnea Treatment on Atrial Fibrillation Recurrence Shukla, Chinitz JACC Clinical Electrophysiology Vol 1 ,No 1-2 , 2015                                       5
Revolutionizing the way sleep disorders are diagnosed and managed - Investor Presentation August 13, 2020 - Investor Relations
Multiple Trends Propelling the Market

     Source: Sleep Apnea Types, Mechanisms, and Clinical Cardiovascular Consequences, Javaheri,et al, JACC VOL. 69, NO. 7, 2017 841-58
                                                                                                                                         6
Revolutionizing the way sleep disorders are diagnosed and managed - Investor Presentation August 13, 2020 - Investor Relations
For Most Untreated Patients, the Journey is Cumbersome

  Traditionally, we estimate 65% of sleep tests
  have been conducted in sleep labs
                                                                                            1. There are potentially 54M patients each year that
                                                                                               require a visit or follow-up with one of ~5,000 board-
                                                                                               certified sleep physicians in the US1, or over 10,000
                                                                                               patients per physician.
                                                                                            2. Sleep experts typically recommend
                                                                                               Polysomnography (PSG) at a sleep lab, but not
                                                                                               everyone chooses to comply
                                                                                            3. Once the sleep test is interpreted, they may
                                                                                               prescribe CPAP during a follow-up consultation

                                                                                                                                    multiple locations:
                                                                                                                Sleep patient
                                                                                                                                 inconvenient and high
                                                                                                                 journey is       cost ($3,500-$8,700)2
                                                                                                                lengthy (~3
                                                                                                                  months)

       1. “The Past Is Prologue: The Future of Sleep Medicine” J Clin Sleep Med. 2017 Jan 15; 13(1): 127–135.
       2. Based on CMS 2018 claims data                                                                                                                   7
Revolutionizing the way sleep disorders are diagnosed and managed - Investor Presentation August 13, 2020 - Investor Relations
Our Solution to Help Undiagnosed and Untreated Patients
                                             CloudPAT
                                             Interpretation;
                                             Online Consult.
               Home Sleep Apnea
                 Test (“HSAT”)                                 RX

                                                                    Partnerships
                                                                    DME & Smart
                                                                    remote setup

     Prescription
                                                                             SleepPath
                                                                               On-going
                                                                               compliance
                                                                               monitoring

                     Sleep Patient Journey Reduced to 1-2 Weeks

                                                                                            8
Revolutionizing the way sleep disorders are diagnosed and managed - Investor Presentation August 13, 2020 - Investor Relations
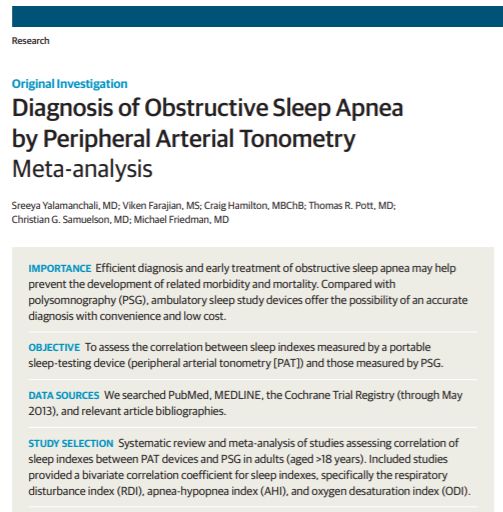
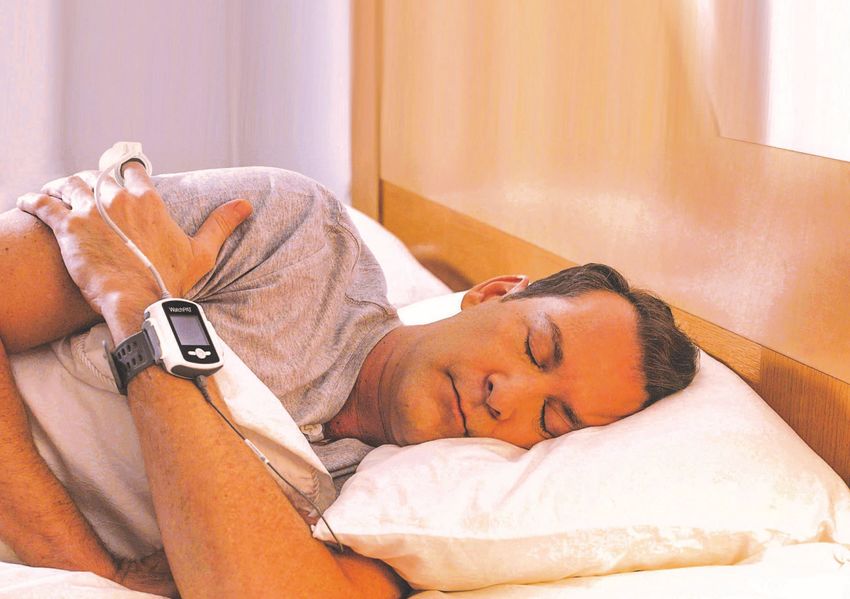
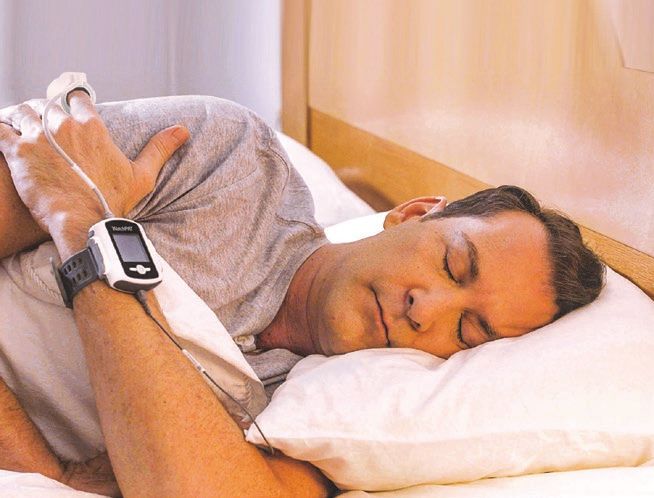
Home Sleep Apnea Test Devices
PAT™ (Peripheral Arterial Tonometry) with proprietary algorithm and True Sleep Time

                                  WatchPAT™ 300                       WatchPAT™ ONE
                                     (reusable)                       (Fully disposable)
   Measures Sleep
 Across 7 Parameters:
    1. PAT™
    2. Oximetry
    3. Actigraphy
    4. Heart Rate
    5. Body Position
                                 Compatible with disposable and    Same WatchPAT accuracy and
    6. Snoring Intensity         rechargeable AAA batteries        reliability
    7. Chest Motion              15 second download time           NO charging required
                                 Detachable design for easier      NO cleaning or return shipping
                                 cleaning                          required

                                                                                                    9
Revolutionizing the way sleep disorders are diagnosed and managed - Investor Presentation August 13, 2020 - Investor Relations
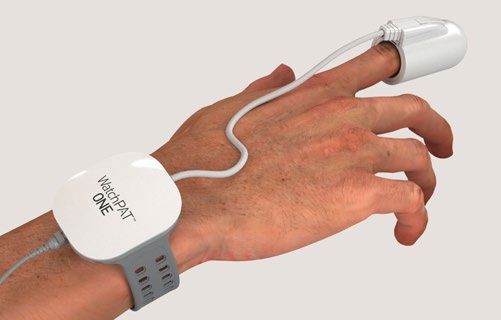
CloudPATTM Differentiated Features
A cloud-based solution for convenient sleep diagnosis and HIPAA-compliant patient data transfers

  Within one minute1 of the sleep study,                                                     SleePath™ dashboard can be used by
  data is uploaded and scored to identify                                                    physicians to track their patients’ sleep apnea
  types of apnea events on either zzzPAT                                                     management pathway and compliance
  (local software) or CloudPAT

                                            In contrast to in-lab PSG, validated automated
                                            reports require sleep technician’s review
                                            ranging from little to none

          1. With WatchPAT ONE
                                                                                                                                               10
CloudPATTM Digital Health Architecture

                            WatchPAT
                              ONE
                             Backend
                                                                                    RPAT Smart Client

              Patient                                    AWS
              portal                                     (SOC2)
                                 Interpretation
                                 marketplace

                                                                  HIPPA
                                                                  Compliant
                                                  CloudPAT
                                                                              CPAP Compliance
                                                                               Data Server(s)
       Customer EMRs
       API (HL7/FHIR)
                                                             Secure

                                                                                      Online
                                                                                      consultations
                                DME
                        Referrals/integrations

                                                                                                        11
$7B Estimated Market Opportunity to Help Adults with OSA

               $2.7B                                                                  $2.6B                                                           $1.9B
       United States                                                                   Europe                                                         APAC

    54M Adults with OSA in                                               66M Adults with OSA in                                                 77M Adults with OSA in
          the US1                                                              Europe1                                                             the Asia-Pacific1

     Source:
     1. "Estimation of the global prevalence and burden of obstructive sleep apnoea: a literature-based analysis” Lancet Respir Med 2019; 7: 687–98
     Note: Estimated market opportunity assumptions exclude specific countries within Europe and Asia-Pacific                                                            12
Competitive Landscape
We view many HSAT “competitors” as potential partners, given their interest in utilizing HSATs to
generate core CPAP and DME sales

                          In-Lab PSG                                            Screeners                                        Home Sleep Apnea Test Options
                                                                                    Pulse                                      Air Flow-Based
                                                                                   Oximetry                                        Systems

                        7 Parameters                                          1-2 Parameters:                                4-5 Parameters:      8+ Parameters
PARAMETERS
 MEASURED               + sleep stages,                                       saturation, motion                             AHI, RDI, snoring,   + sleep stages,
                        + true sleep time                                                                                    position             + true sleep time

 COMPLETION
                                    80%                                                                                                                  98%
    RATE

                                                                             Simplicity / Comfort
              * “US and European Sleep Disorder Diagnostic Devices Market“, Frost & Sullivan ; M9AC-54 February 2014
              ** “Comparison of Apnea Hypopnea Index (AHI) Using Recording Time vs. Sleep Time”; Schutte-Rodin; SLEEP Volume 37, 2014                                 13
Our Clinically Validated and Differentiated WatchPAT Technology

                                                                                                 In 2017, AASM began official recognizing PAT
                                                                                                 technology in its guidelines for clinical practice2

  WatchPAT has been clinical validated with an 89%
  documented correlation to in-lab PSG tests1

         1.   Yalamanchali S, Farajian V, Hamilton C, Pott TR, Samuelson CG, Friedman M. Diagnosis of obstructive sleep apnea by peripheral arterial tonometry: meta-analysis. JAMA Otolaryngol. Head
              Neck Surg. December 2013;139(12):1343-1350
         2.   J Clin Sleep Med. 2017 Mar 15; 13(3): 479–504                                                                                                                                             14
Established CPT Codes and Reimbursement
The 2020 update, issued by CMS in November 2019, represents year 2 of a four-year plan to reevaluate
payment in home sleep apnea testing devices; anticipate similar reductions in 2021

Rates for HSAT devices that do not have sleep time technology have been declining more rapidly

                      CPT                                          2020      2019    %
                     CODE    MODIFIDER       DESCRIPTION        FINAL RATE PAYMENT CHANGE
                                              Combined
                               Global                            $168.90   $172.63   -2%    In cardiology market,
                                               Services
                              Technical       Provision of                                  cardiologists / IDTF
     WatchPAT        95800                                       $126.32   $129.38   -2%    bill for technical
                             Component      Equipment & Staff
                             Professional      Supervision,                                 component whereas
                                                                  $42.59   $43.25    -2%    Interpreting
                             Component        Interpretation
                                               Combined                                     Physician bills for
                               Global                            $119.10   $140.55   -15%   professional
   HSAT devices                                 Services
  that do not have            Technical       Provision of                                  component
                     95806                                        $72.90   $89.74    -19%
     sleep time              Component      Equipment & Staff
    technology               Professional      Supervision,
                                                                  $46.20   $50.82    -9%
                             Component        Interpretation

                                                                                                                    15
COVID-19 Update:                                                                                    Recommendations Impact
The AASM began issuing its “COVID-19 Mitigation Strategies for Sleep Clinics and Labs” in March and
has subsequently updated it for reopening

        AASM MITIGATION STRATEGIES                                                                      ITAMAR COMMENTARY ON IMPACT

      SLEEP CLINIC & LAB STRATEGIES
                                                                                              • WatchPAT ONE is the only commercially
 • Postpone and reschedule PSG for children and
   adults except in emergencies
                                                                                                available disposable HSAT device

 • Postpone and reschedule non-emergency, in-                                                 • Surge in demand for WatchPAT One is
   person appointments; conduct telemedicine                                                    tempered with softness in demand for multiuse
                                                                                                tests
         HSAT SERVICE PARAMETERS
                                                                                              • Onboarded an average of 21 new WatchPAT
 • Consider using single-use, fully disposable                                                  ONE customers per week from April 1 to May
   devices and/or components                                                                    22, 2020, compared to single digit onboarding
 • If using reusable devices, best to remove from                                               levels in Q1
   service for >72 hours and disinfect before use

        Source: https://aasm.org/covid-19-resources/covid-19-mitigation-strategies-sleep-clinics-labs
                                                                                                                                                16
Multiple Growth Drivers

                          +     CORE SLEEP
                                             DIRECT TO
                   CARDIOLOGY
                                             CONSUMER
 HOME-BASED CARE                                         ROW EXPANSION

       1              2             3           4              5

                                                                         17
US Telehealth Reimbursement and Home-Based Care Trends

                                  50 states and Washington DC provide reimbursement for some form of
                                  live video in Medicaid fee-for-service1

                                  42 states and DC have laws that govern private payer reimbursement
                                  of telehealth, some of which require reimbursement be equal to in-
                                  person coverage1

                                  In April 2020, CMS issued an interim rule to add 80+ telehealth
                                  services to its list of services covered by Medicare

                                  Effective January 2019, the bipartisan Budget Act authorized five
                                  telehealth expansions

     1.   “State Telehealth Laws and Reimbursement Policies” Public Health Institute / Center for Connected Health Policy. Spring 2020
                                                                                                                                         18
Shift to Home-Based Care
Survey results across 300 sleep centers published in July indicate volumes of 70% in HSATs versus 30% in lab1,
which has flipped from the pre-COVID ratio. Over the long term, while we expect sleep experts to continue to utilize
PSG, we also expect them to utilize HSATs more frequently than in the past.

          PRE COVID-19                                                                    COVID-19                                                      POST COVID-19
  Sleep Tests (in Millions) – US 2018                                      HSAT vs. PSG Volume Ratio                                             HSAT vs. PSG Volume Ratio2
                                                         22%
                                                         Itamar’s
                                                         market
                                                         share
                                       1.5                                           30%
                                                                                                                                                        50%         50%
           3.5
                                                                                                            70%

                                                                                           PSG          HSAT
                  PSG           HSAT                                                                                                                        PSG   HSAT

          1.   COVID-19 sleep center impact study. EnsoData. 2020. Available at https://www.ensodata.com/landing-pages/covid-19-sleep-center-impact-study
          2.   Company estimate
                                                                                                                                                                              19
Three-Pronged US Commercialization Strategy
       CHANNEL                                                 OPPORTUNITY                                                                     STRATEGY

                                                               2,500+ Sleep                                                - Direct Sales
                                                               Centers1                                                    - Partnerships (e.g. CPAP and
                                                                                                                             DME vendors)
     Core Sleep

                                                                                                                           - Direct Sales
                                                               13,678 Practice
                                                                                                                           - Partnerships (e.g. Cardiology
                                                               Sites2
                                                                                                                             Device and DME vendors)
     Cardiology

                                                               54M Americans with                                          - Partnerships (e.g. CPAP-
                                                               Undiagnosed OSA3                                              related vendors)
  Direct to Consumer

      1.   “AASM response to closing of Sleep HealthCenters facilities in New England and Arizona” AASM Press Release. January 27, 2013
      2.   “Nationwide Physician Specialties by State” IQVIA Market Insights Report. August 2019
      3.   “Americas Prevalence of OSA in Adults: Estimation Using Currently Available Data” Sleep, Volume 42, Issue Supplement_1, April 2019, Page A191     20
Business Models for Different Needs

                        Fixed fee per home sleep apnea test (“HSAT”)
    Test as a Service   WatchPAT One
         (TaaS)         Includes the disposable biosensor, hardware rental fees (as applicable) and
                        access to the CloudPAT™ platform for sleep report interpretation

                        WatchPAT™ devices, including WatchPAT 300
      Capital Sales
                        Finger-mounted probes

                        SleepPath™ care pathway module for cardiologists to monitor patient sleep
      Marketplace       apnea management status and compliance with CPAP therapeutic devices
       Services         Remote interpretation and consultation

                        WatchPAT™ Direct set of logistic support services including delivery of
    Delivery Services   device to the patient and the shipment back to service center
                        Turnkey solution

                                                                                                      21
Notable Partnerships

                                                             Digital DME for fast and seamless treatment
    Collaboration with Lunella, a subsidiary of SoClean,     integration
    in DTC channel
                                                             Therapeutic part of the Total Sleep Solution
    Digital platform for Prescription, Interpretation, On-   Offering
    line consult with Therapy recommendation
                                                             Turnkey solution for cardiology clinics from
                                                             screening to treatment including billing

                                                                                                            22
Quarterly Revenue and Non-IFRS Gross Margin Progression
                             $12.0M                                                                                                                                                 85.0%

                             $10.0M                                                                                                                       +48%*
                                                                                                                                                                                    80.0%
                                                                                                                                                                            +21%*
                                                                                                                                                                   +38%*
                                                                                                                                                 +33%*
                               $8.0M
                                                                                                                                       +21%*           +68%*
                                                                                                                                                                                    75.0%
                                                                                                                     +10%*                                             +31%*
                                                                                                +20%*    +15%*                 +12%*                           +42%*
                               $6.0M                                                                                                         +17%*
                                                                                      +30%*
                                                                                                     +24%*                           +18%*

                                                                                                              +10%*     +34%*
                                                                                                                                                                                    70.0%
                                                                                           +23%*
                               $4.0M
                                                                                 +23%*

                                                                                                                                                                                    65.0%
                               $2.0M

                                   -                                                                                                                                                60.0%
                             Q1/17                  Q2/17     Q3/17      Q4/17     Q1/18      Q2/18     Q3/18    Q4/18       Q1/19    Q2/19    Q3/19     Q4/19    Q1/20    Q2/20
    US and Canada WP Revenue $2.6M                  $3.4M     $3.8M      $4.0M     $3.2M      $4.2M     $4.9M    $4.4M       $4.3M    $5.0M    $5.8M     $7.3M    $6.1M    $6.6M
    Total Revenue            $4.3M                  $5.1M     $5.3M      $6.0M     $5.5M      $6.1M     $6.1M    $6.6M       $6.1M    $7.4M    $8.1M     $9.8M    $8.4M    $8.9M
    GM % - Non-IFRS          76.6%                  76.6%     76.8%      77.1%     78.2%      77.7%     75.2%    78.6%       78.2%    79.1%    78.6%     79.5%    76.8%    69.9%

       * Q over Q
       ** For IFRS gross margin and reconciliation between IFRS and Non-IFRS gross margin, please refer to page 32                                                                          23
Key Takeaways

                We are revolutionizing the way sleep disorders are diagnosed and managed
                with our home-based solutions and digital health platform

                We have a large market opportunity to help 26% of adults worldwide, and we
                have only 22% est. market share within the United States HSAT market

                We expect multiple growth drivers to add incremental value, ranging from
                international expansion to the shift to home-based care

                Our financial profile is compelling, with 29% y/y revenue growth as of
                2019 YE, high gross margins, and $45M in cash & cash equivalents

                                                                                             24
Appendix

           25
Management Team

       Gilad Glick                 Shy Basson                  Jeff Schmidt             Dan Shlezak                  Amit Shafrir
     President & CEO              CFO & US COO           SVP, Sales North America VP, Operations, Engineering    VP & General Manager
                                                                                          and R&D                 Cardiology Business

         Ira Prigat                 Efrat Litman              Moti Mikles                 Eilon Livne                 Shiri Shneorson
 President, Japan and China   VP, Advanced Research &    VP, Quality & Healthcare    VP, Sales & Channels         VP & General Manager,
                              Development & Regulatory         Compliance           Development EMEA & AP       Digital Health Business Unit

                                                                                                                                               26
Classification and Codes

                           27
WatchPAT™: Integrated Digital Health Platform To Diagnose and
Treat Sleep Apnea
                              A One-Stop Sleep Apnea Solution for Cardiologists
                                                                                                      Patient
               Systematic                   Diagnosis with
                                                                            Treatment               Compliance
              Screening with                  WatchPAT                                               Reporting
              Questionnaire
  • Patient awareness kits           •   WatchPAT Direct          •   Access to DMEs      •   Waiting List
       • Waiting room video          •   Interpretation through       Networks for CPAP         • WatchPAT
       • Waiting room                    CloudPAT                 •   Compliance                • Test result
           posters                       collaboration with           Programs                  • CPAP
       • Informative                     Sleep Physician          •   PAMs Distribution   •   Patient CPAP compliance
           brochure                                                                           rate
                                                                                          •   Sleep Apnea prevalence
                                                                                              rate

                                                                                                                        28
Revenues by Geography
                           $10.0M

                            $9.0M

                            $8.0M

                            $7.0M

                            $6.0M

                            $5.0M

                            $4.0M

                            $3.0M

                            $2.0M

                            $1.0M

                                -
                                       Q1.2018   Q2.2018   Q3.2018   Q4.2018   Q1.2019   Q2.2019   Q3.2019   Q4.2019   Q1.2020   Q2.2020
      Asia Pacific (excluding Japan)    $0.3M     $0.0M     $0.3M     $0.2M     $0.2M     $0.3M     $0.1M     $0.2M
      Pharma                            $0.1M                         $0.3M               $0.4M     $0.3M     $0.3M              $0.9M
      Europe, Israel and Others         $0.4M    $0.5M     $0.5M      $0.6M    $0.8M      $0.7M     $0.8M     $0.9M    $1.0M     $0.5M
      Japan                             $1.2M    $1.1M     $0.2M      $0.9M    $0.7M      $0.8M     $1.1M     $0.9M    $1.2M     $0.9M
      United States and Canada          $3.5M    $4.5M     $5.0M      $4.6M    $4.4M      $5.2M     $5.8M     $7.5M    $6.2M     $6.6M

                                                                                                                                           29
Quarterly Operating Loss - IFRS
    -

($0.5M)
                                                                                                                                       ($0.5M)

($1.0M)                                                                                                                     ($0.8M)
                                                                                         ($0.9M) ($0.9M) ($0.9M)                                                                      ($0.9M)
                                                                                                                                                                            ($1.0M)

($1.5M)                                                                      ($1.3M)                                                               ($1.3M)
                                                                  ($1.5M)
                                                                                                                                                                  ($1.7M)
($2.0M)
                               ($2.0M)                                                                                                                                                          ($2.0M)
                    ($2.1M)
                                                      ($2.2M)
($2.5M)                                   ($2.4M)

($3.0M)

                                                                                                                                                                                                          ($3.2M)
($3.5M)
          ($3.5M)

($4.0M)

          Q1/16     Q2/16       Q3/16      Q4/16       Q1/17       Q2/17      Q3/17       Q4/17       Q1/18      Q2/18       Q3/18      Q4/18       Q1/19         Q2/19     Q3/19     Q4/19     Q1/20     Q2/20

             * For IFRS operating and net loss and reconciliation between IFRS and Non-IFRS operating and net loss, please refer to pages 33 - 35, respectively
                                                                                                                                                                                                                    30
Quarterly Operating Loss – Non IFRS
      -

                                                                                                                   ($0.2M)                                                 ($0.2M)
                                                                                                            ($0.3M)
  ($0.5M)                                                                                            ($0.4M)
                                                                                       ($0.5M)($0.5M)                                                             ($0.5M)
                                                                            ($0.7M)
  ($1.0M)                                                                                                                                            ($0.9M)
                                                                 ($1.0M)                                                                      ($1.0M)

  ($1.5M)                                      ($1.4M)                                                                                                                              ($1.4M)
                                 ($1.5M)($1.5M)
                      ($1.7M)
  ($2.0M)

            ($2.2M)
  ($2.5M)                                                                                                                                                                                    ($2.4M)

  ($3.0M)

             Q1/16      Q2/16      Q3/16      Q4/16     Q1/17      Q2/17      Q3/17      Q4/17      Q1/18      Q2/18      Q3/18      Q4/18     Q1/19      Q2/19    Q3/19    Q4/19    Q1/20    Q2/20

            * For IFRS operating and net loss and reconciliation between IFRS and Non-IFRS operating and net loss, please refer to pages 33 - 35, respectively
                                                                                                                                                                                                       31
Use of Non-IFRS Measures &
 Reconciliation of IFRS to Non-IFRS Gross Margin
In addition to disclosing financial results prepared in accordance with International Financial Reporting Standards (IFRS) as issued by the International Accounting Standards Board (IASB), this
presentation contains Non-IFRS financial measures for gross margin, which are adjusted from results based on IFRS to exclude: (i) share-based payments; (ii) depreciation and amortization; (iii)
expenses relating to change in manpower.

Management believes that the Non-IFRS financial measures provided in this presentation are useful to investors’ understanding and assessment of the Company’s performance. Management uses both
IFRS and Non-IFRS measures when operating and evaluating the Company’s business internally and therefore decided to make these Non-IFRS adjustments available to investors. The presentation of
this Non-IFRS financial information is not intended to be considered in isolation or as a substitute for the financial information prepared and presented in accordance with IFRS. For further details, see a
reconciliation of operating loss and net loss on an IFRS basis to a Non-IFRS basis that is provided in the table below:

                                                                                                                                                                                                                32
Use of Non-IFRS Measures &
Reconciliation of IFRS to Non-IFRS Operating Loss (1 of 3)
In addition to disclosing financial results prepared in accordance with International Financial Reporting Standards (IFRS) as issued by the International Accounting Standards Board
(IASB), this presentation contains Non-IFRS financial measures for operating loss, which are adjusted from results based on IFRS to exclude: (i) share-based payments; (ii)
depreciation and amortization; (iii) change in provision for doubtful and bad debt; (iv) expenses relating to change in manpower.

Management believes that the Non-IFRS financial measures provided in this presentation are useful to investors’ understanding and assessment of the Company’s performance.
Management uses both IFRS and Non-IFRS measures when operating and evaluating the Company’s business internally and therefore decided to make these Non-IFRS adjustments
available to investors. The presentation of this Non-IFRS financial information is not intended to be considered in isolation or as a substitute for the financial information prepared and
presented in accordance with IFRS. For further details, see a reconciliation of operating loss and net loss on an IFRS basis to a Non-IFRS basis that is provided in the table below:

                                                                                      Q1           Q2            Q3           Q4            Q1           Q2
                                                                                     2019         2019          2019         2019          2020         2020

                    IFRS Operating Loss                                           ($1,295K) ($1,743K)         ($979K)      ($877K)      ($1,957K) ($3,218K)

                    IFRS Net Loss                                                 ($1,164K) ($1,958K) ($1,147K)            ($999K)      ($1,998K) ($3,242K)

                    Cost of Revenues

                    Share-based payment                                              $2K           $2K          $3K           $3K          $2K           $5K

                    Depreciation and amortization                                    $79K         $90K         $105K        $110K         $102K        $162K

                    Expenses relating to change in manpower                                 -            -             -            -             -     $27K

                    Total Cost of Revenues Reconciliations                           $81K         $92K         $108K        $113K         $104K        $194K

                                                                                                                                                                                              33
Use of Non-IFRS Measures &
Reconciliation of IFRS to Non-IFRS Operating Loss (2 of 3)
                                                                  Q1           Q2          Q3           Q4           Q1         Q2
            Selling and Marketing
                                                                 2019         2019        2019         2019         2020       2020

            Share-based payment                                          -   $169K       $129K         $85K        $119K       $80K

            Depreciation and amortization                        $28K         $30K        $14K         $52K         $31K       $37K

            Expenses relating to change in manpower                      -      -                 -           -            -   $63K

            Total Selling and Marketing Reconciliations          $28K        $199K       $143K        $137K        $150K       $180K

            Research and Development

            Share-based payment                                  $29K         $25K        $47K         $69K         $71K       $71K

            Depreciation and amortization                        $12K         $16K        $34K                -     $19K       $31K

            Expenses relating to change in manpower                      -   $115K                -           -       -        $18K

            Total Research and Development Reconciliations       $41K        $156K        $81K         $69K         $90K       $120K

            General and Administrative

            Share-based payment                                 $139K        $153K       $170K        $209K        $164K       $147K

            Depreciation and amortization                        $13K         $14K        $14K         $5K          $16K       $18K

            Change in provision for doubtful and bad debt       ($13K)       $207K        ($2K)       $157K         $32K       $126K

            Expenses relating to change in manpower                      -           -            -           -            -   $9K

            Total General and Administrative Reconciliations    $139K        $374K       $182K        $371K        $212K       $300K

             Non - IFRS Operating Loss                         ($1,006K)     ($922K)     ($465K)      ($187K)     ($1,401K) ($2,424K)
                                                                                                                                        34
Use of Non-IFRS Measures &
Reconciliation of IFRS to Non-IFRS Net Loss (3 of 3)

                                                           Q1        Q2         Q3          Q4           Q1         Q2
     Financial Income (Expenses), Net                     2019      2019       2019        2019         2020       2020

     Share-based payment                                  $6K        $6K       $6K         $7K          $6K        $6K

     Gain (Loss) from Reevaluation of Derivatives       ($364K)    ($78K)             -           -            -          -

     Financial Income (Expenses), Net Reconciliations   ($358K)    ($72K)      $6K         $7K          $6K        $6K
     Non - IFRS Net Loss                                ($1,233K) ($1,209K)   ($627K)     ($302K)     ($1,436K) ($2,442K)

                                                                                                                              35
36
You can also read