African Barrick Gold Bulyanhulu - Site Presentation March 2014
←
→
Page content transcription
If your browser does not render page correctly, please read the page content below
African Barrick Gold
 Bulyanhulu – Site Presentation
                       March 2014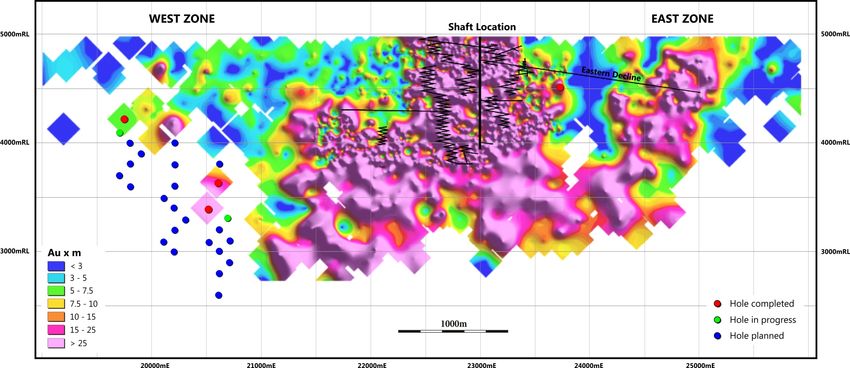
Contents

 1. Introduction                1

 2. Asset Overview              7

 3. Mining Overview             11

 4. Processing Overview         25

 5. Business Improvement        29

 6. Social Licence to Operate   33

 7. Cultural Transformation     36

 8. Summary                     38

                                     1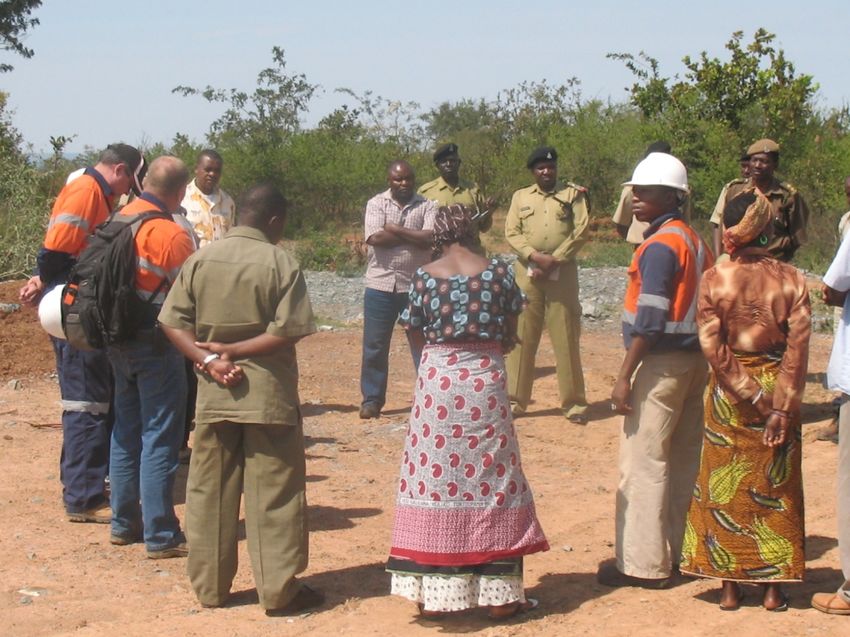
Biography

            Peter Burger joined ABG in 2011 and having been General
            Manager of Tulawaka and Buzwagi ahead of joining
            Bulyanhulu in October 2013.

            Prior to ABG, Peter has worked for a number of mining
            companies such as Anglo American and Acquarius Platinum
            in numerous managerial roles.

            Peter has over 20 years of operational experience and has
            worked at a range of underground operations. Peter is a
            mining engineer with a degree from the University of
            Johannesburg.

                                                                        2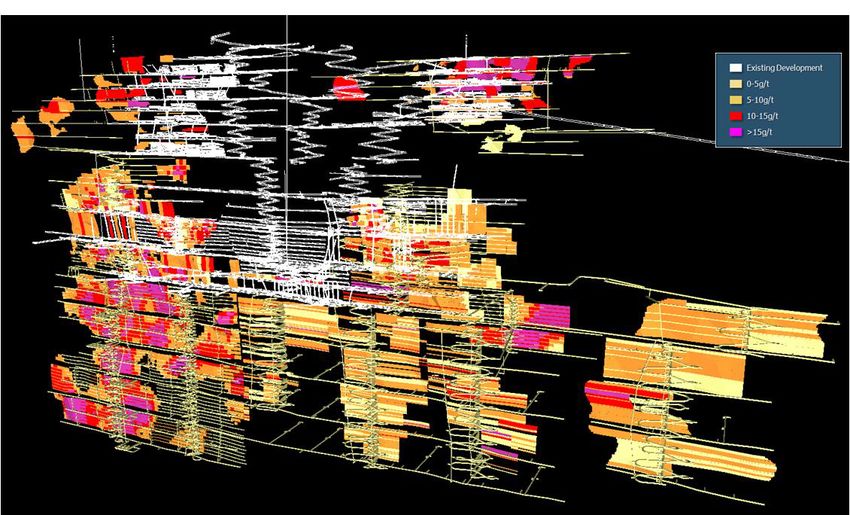
Location

           3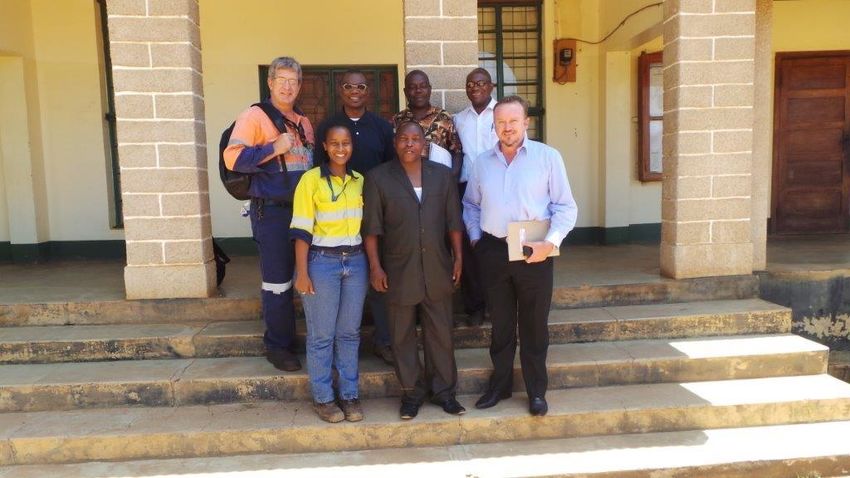
History
Asset Overview
High Grade, narrow vein, steeply dipping ore body
Underground gold mine owned and operated by Bulyanhulu Gold Mine Limited
Located in Kahama District, in the Shinyanga Region, North West Tanzania, 55km South of Lake Victoria
Access to Bulyanhulu is by road from Mwanza (155km) or Kahama (55km) and by air through own-operated
airstrip within the property
Well established mine site with administration office, a mill, laboratory, warehouse, clinic, security
installations, housing and other support structures
Majority of Tanzanian workforce is drawn from surrounding communities
Mine History
1983 to 1985: JV with
1976: Gold First 1994: Prospecting
Outo Kumpu and Kone 2001: Commencement
discovered at License granted to
Corp to conduct further of Production
Bulyanhulu Sutton Resources
drilling
1976 1980 1985 1992 1994 1999 2001 2011
1980 to 1982: First 1989 to 1992: Placer Dome JV 2011: Bulyanhulu celebrates
1999: Acquisition of Sutton
Exploration by State to manage the property and 10 years of operations and 3
Resources by Barrick
Mining Corporation conduct exploratory work million ounces of production
4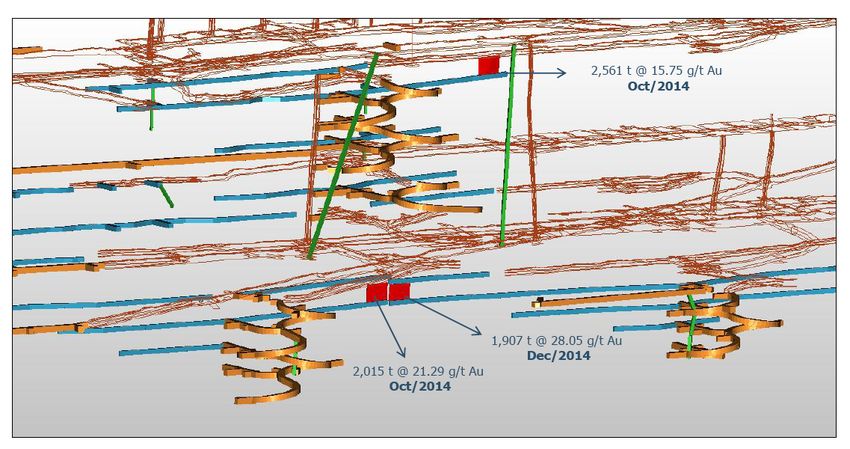
People
Who we are
BGML draws its human capital from various corners of
the world, with the majority sourced locally or within
Tanzania
Total current Bulyanhulu workforce:
− Tanzanians: 2,237
− International Staff: 159
− Contractors: 1,007
Facilities such as the health centre, underground
clinic, employee transportation and the Housing
Scheme are part of what is intended to make BGML
“an Employer of Choice”
5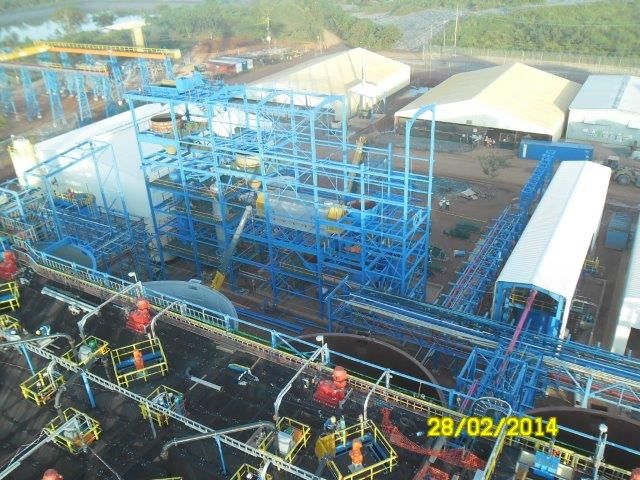
Safety incident frequency rates 2006 - 2013
TRIFR
LTIFR
Management Commitment – Visible Felt Leadership
Employee Involvement – “Stop and Fix”
Personal Accountability – Safety Standards
6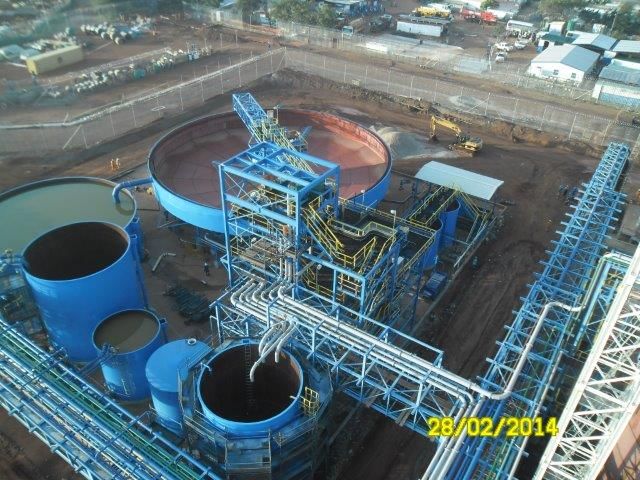
Contents

 1. Introduction                1

 2. Asset Overview              7

 3. Mining Overview             11

 4. Processing Overview         25

 5. Business Improvement        29

 6. Social Licence to Operate   33

 7. Cultural Transformation     36

 8. Summary                     38

                                     7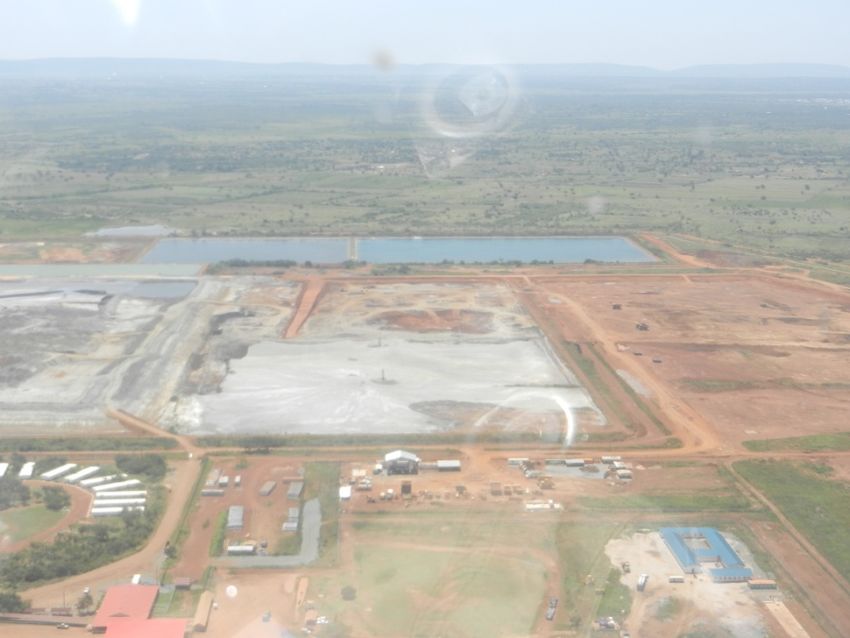
Geology

          8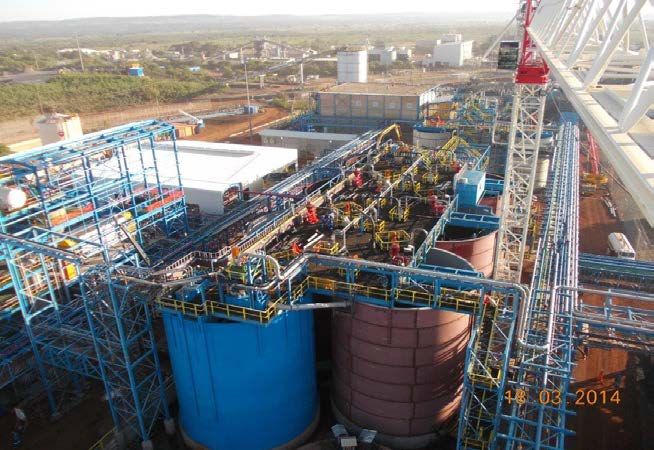
Geological cross-section

                Facing

    Pillow Basalts
                                         Gabbro

                         X                        Y

Mineralized Qtz vn

                             Argillite

                                                      9
Reef 1 long section: grade distribution
BGMDD0055W1
1.5m @ 2.27/t Au
BGMDD0054W1
1.29m @ 11.7g/t Au UX4700-07
1.04m @ 76.7g/t Au
BGMDD0054W2
4.5m @ 8.07g/t Au
incl. 1.5m @ 16.6g/t Au
10Contents
1. Introduction 1
2. Asset Overview 7
3. Mining Overview 11
4. Processing Overview 25
5. Business Improvement 29
6. Social Licence to Operate 33
7. Cultural Transformation 36
8. Summary 38
11Reserves and Resources
Mineral Reserve and Resources at 31st December 2013
2012 YE 2012 YE 2013YE 2013 YE
contained Mozs Grade contained Mozs Grade
Proven 0.266 10.01 0.149 11.40
Probable 10.613 11.38 9.238 9.50
Total Reserve 10.879 11.34 9.387 9.53
Measured - -
Indicated 3.320 9.68 3.502 8.44
Inferred 3.252 11.95 2.745 12.88
Total Resource 6.572 10.68 6.274 11.53
Historical Operating Metrics
2010 2011 2012 2013
Production (koz) 260 262 236 198
Cash Cost ($/oz) 539 610 803 875
All in Sustaining Cost ($/oz) n/a n/a 1245 1323
Head Gold Grades (g/t) 9.19 8.47 8.02 7.85
Capacity
Ore Production is currently ±3,300 tpd (~1.0 Mtpa)
Shaft capacity is ~1.7 Mtpa (waste and ore)
Mill capacity is currently ~1.1 Mtpa
LOM is currently 34 years
12Reasons for reserve grade drop
1 Reserve Gold Price: Gold
• Reserve 2012: US$ 1,500/Oz Price
• Reserve 2013: US$ 1,300/Oz (-13%)
2 Mining Method Changes
Increase in Dilution (Internal Dilution + Overbreak)
Reserve Dilution
Increase
(+28%)
3 Cost Changes (Gold Price – Cost)
4 Other contributions:
Additional Drilling in 2013 reduced grade in some areas
Mine Depletion
132012 Reserve
ORANGE : REEF 2 CENTRAL
PINK: UPPER WEST TONNES: 2,189,037@ 11.36g/t
TONNES: 1,639,361@ 10.80g/t Contained Ounces: 799,727
Contained Ounces: 569,380
CCF
LIGHT BLUE: UPPER CENTRAL
TONNES: 635,127@ 10.20g/t
Contained Ounces: 208,222
LH CCF
BLUE: DEEP WEST
TONNES: 6,834,932@ 14.53g/t
Contained Ounces: 3,193,857 RED: DEEP EAST
TONNES: 1,171,418@ 13.85g/t
Contained Ounces: 521,431
CCF
GREEN: DEEP CENTRAL
TONNES: 2,632,798@ 11.56g/t
Contained Ounces: 978,176
142013 Reserve
PINK: UPPER WEST 1.41g/t (-13%) ORANGE : REEF 2 CENTRAL
TONNES: 2,276,199@ 9.39g/t TONNES: 3,014,406@ 10.12g/t
1.24g/t (-11%)
Contained Ounces: 687,633 Contained Ounces: 980,670
CCF
LIGHT BLUE: UPPER CENTRAL
TONNES: 579,188@ 9.131g/t 1.07g/t (-10%)
Contained Ounces: 170,030
DnF
BLUE: DEEP WEST
TONNES: 9,278,161@ 11.50g/t
Contained Ounces: 3,431,269
3.03g/t (-21%) RED: DEEP EAST
TONNES: 2,338,100@ 7.76g/t
Contained Ounces: 583,708
6.09g/t (-44%)
LH
GREEN: DEEP CENTRAL
TONNES: 5,777,343@ 7.43g/t 4.13g/t (-36%)
Contained Ounces: 1,380,004
15Mining operations
Mining Overview
Underground mine with shaft and ramp access
Life of Mine plan average mining rate of 1 million tonnes
of ore mined per annum from two reefs
Mobile equipment fleet includes drill jumbos, scoops,
dump trucks, utility vehicles and handheld equipment
Owner Maintenance
Introducing contractors to undertake critical development
Split of Mining Methods Kt 2008 2009 2010 2011 2012 2013
100%
Ore Hoisted
80% (Kt) 756 967 960 1,048 959 872
Ore Dev't
60% Drift & Fill
40% CCF Waste Hoisted
Alimak (Kt) 372 524 559 556 507 475
20%
Long hole
0%
2013 2014 LOM
(Actual for 2013) 16LOM changes to achieve reserve grade
2013 LOM Plan
2013 LOM Plan had CCF Mining in Deep West, Deep Central and Deep East per previous LOM Plans
CCF targeted the Footwall and Hangingwall Veins with inefficient, labour intensive handheld, stoping with
minimal dilution
CCF = Higher Mined Grade but, higher labour requirements, low daily tonnage, requiring +/- 200 stopes
monthly to sustain LOM production in later years
2014 LOM Plan
2014 LOM Plan – No CCF Mining in the Deep areas
CCF converted to either Underhand Longhole Stoping in the Deep West or Mechanised Drift & Fill in the
Deep Central and Deep East Zones
Accelerated Development focused on the Deep West to open up more productive mechanised stopes
Mechanised Underhand Longhole Stoping employed in Deep West to bring in stopes earlier, and bring
ounces forward
Monthly stoping: Alimak – 4, Long Hole – 10, CCF - 12
172015 LOM – in progress
2014 - 2030
2030 - 2046
Contract miners engaged to accelerate waste development specifically on the main decline and ore drives
Underhand long hole mining will be used to ensure earlier production from stoping areas
Areas non-economical for long hole is being reviewed for drift and fill
Trial mine will be done in Upper East in 2014 for 1.5m wide long hole stopes
Re-focusing next 5 years to areas with high grade (West Deeps)
Grade control in place to reduce overbreak
Exploration plan to add ounces in Reef 1 and 2 (starting in 2014 in both reefs)
18Underhand Long Hole
19KPI review – reducing long hole overbreak
Improving trend in reducing overbreak What is being done?
45%
OVERBREAK TARGET Geology and Survey assessment every 2
40%
weeks
35%
Weekly discussion between BI, TS and Ops
30% Drill hole surveys to improve drilling
accuracy
25%
Long hole machines were brought back to
20% standard
15% Use right explosives – emulsion vs ANFO
10% Training of Long hole drillers
5% Reducing Alimak tonnes in the LOM
0%
Sep-12
Sep-13
Jan-12
Jan-13
Jan-14
Jul-12
Nov-12
Jul-13
Nov-13
Mar-12
Mar-13
May-12
May-13
20Upper East Zone
The Bulyanhulu Upper East Zone is approximately 2.5 km east of the main Bulyanhulu shaft
The Zone contains approximately 6.5 million ore tonnes at an average 9.05g/t containing
approximately 1.8 million gold ounces within Reef 1 and Reef 2 from surface to 1km depth
The mineralisation in the “Zone” is included in current reserves, but it was not scheduled for
mining until later in the mine life
However, following model and study reviews we may accelerate mining within the overall life of
mine
This would make use of an existing 1.8 km decline to this zone, which has been dewatered and
rehabilitated, and would look at developing a second access decline from a box-cut at surface
between Reefs 1 & 2 to allow flexibility in mining
The material mined from the Upper East Zone would initially use excess milling capacity in the
process plant, followed by debottlenecking of plant to increase capacity
We are conducting an updated feasibility study on this area to incorporate both Reef 1 and Reef
2 and are planning “early works” development of test stopes on Reef 1
Mining Methods proposed are:
− Reef 1 - Mechanised Drift & Fill
− Reef 2 - Underhand Longhole Stoping
21Upper East Zone Reefs 1 and 2
Existing Box Cut Shaft Paste Fill Hole Potential Box Cut
Upper East Reef 1&2
22Upper East
Next Steps
Feasibility and Board approval expected
in Q2 2014
Development expected to commence in
H2 2014
First gold in early 2015
2-3 year ramp up to full production
23Route to 350koz
Sources of Production Growth
400
350
350
60
300
40
Koz
250
52 250
200 290
198 250
150 198
100
2013A Grade & Existing U/G CIL Expansion Upper East 2015E exit
Productivity Mine (2015 rate
Improvements exit rate)
24Contents
1. Introduction 1
2. Asset Overview 7
3. Mining Overview 11
4. Processing Overview 25
5. Business Improvement 29
6. Social Licence to Operate 33
7. Cultural Transformation 36
8. Summary 38
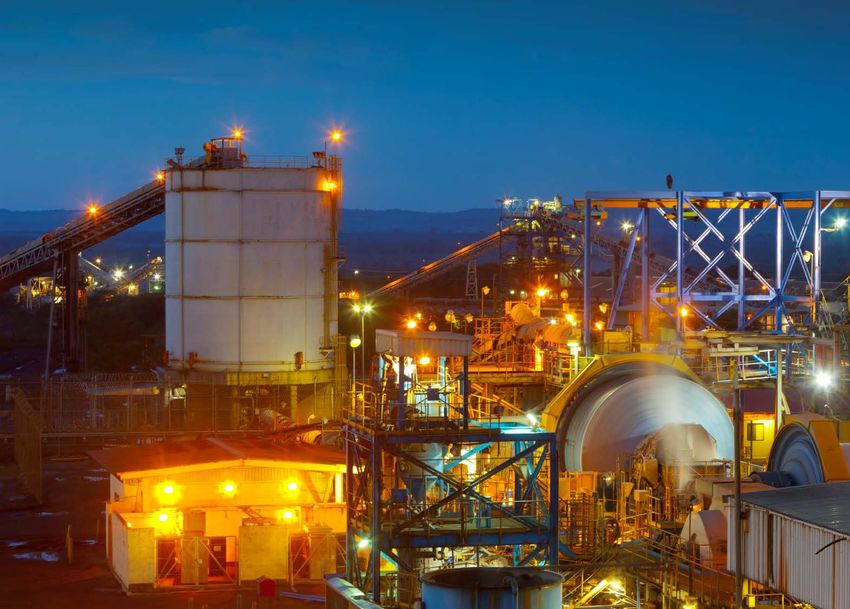
25Processing Operations
Processing Key Points
The following processes are utilised; Crushing,
Grinding, Gravity, Flotation, Carbon-In-Leach,
Thickening, Cyanide destruction, Filtration and Paste
Backfill
ICMI Cyanide code compliant
Bulyanhulu produces two saleable products: dore
and copper concentrate
Dore bars are produced from Gravity and CIL plants
Copper Concentrate is produced from the flotation
plant and sold to copper smelters mainly in China
and Japan
The concentrate requires processing in a copper
smelter with a gold refinery
26CIL Expansion Project
New Carbon In Leach (CIL) Plant 2.4 Mtpa
‒ 1.0 Mtpa ROM + 1.4 Mtpa Hydraulic Reclamation
‒ Including SMBS Detoxification
‒ New Tailings Storage Facility (TSF 4) and Return Water Dam (RWD)
Total cost of the project of $167 million (majority funded by debt facility)
Will add over 40koz per annum over the next 6 years and 10Koz per annum from rougher tailings for
the remaining LOM
‒ AISC for reclaimed tailings will be below $800 per ounce
‒ Will increase overall recoveries from 91% to 94%
27Site activity progress
Description Actual
Overall Completion 96.6%
Construction Progress 92.9%
Commissioning Progress 12%
Completion of Commissioning Q2 2014
28Contents
1. Introduction 1
2. Asset Overview 7
3. Mining Overview 11
4. Processing Overview 25
5. Business Improvement 29
6. Social Licence to Operate 33
7. Cultural Transformation 36
8. Summary 38
29Cost Savings
Progression of Total Site Costs Key 2014 cost savings initiatives:
350,000
Labour cost reduction – expat reduction focus &
improvement of controls regarding T&A
300,000
Maintenance – improved condition based monitoring
& root cause analysis processes
250,000
Mining Consumables – focused on tyre life
management program and underground support
200,000
supplier management
150,000
Processing Consumables – trialing of more cost
efficient grinding media in progress and optimisation
of gravity control processing
100,000
External services – focus has been centered around
contract management (rates and fixed cost reduction)
50,000
G&A – reduced travel and accommodation costs
together with improved camp service contact
-
2012A 2013A 2014E
management
-50,000
Grade control – focused on Alimak and Long Hole
grade control improvement programs
Labour Energy/Diesel
Consumables Maintenance
Contracted services G&A costs
Sales related costs Sustaining Capital
Activity/One-off cost adjustment Total Direct Costs - Absolute
Total Direct Costs - Activity adj
30Cost Savings: Workforce requirements
Split between
Overall Workforce
Plan* Underground vs Support Staff
* Excluding Upper East
31Business Improvement projects planned for 2014 and 2015
Integrated planning – improve co-ordination of planning between departments
Overall equipment effectiveness
Maintenance management system
Improved “live” dispatch system
Cultural and behavioural intervention
People / Organisation – installation of an Accountable Management System (AMS)
Safety culture – revamp of the mine safety culture “We care programme” in Q2 14
32Contents
1. Introduction 1
2. Asset Overview 7
3. Mining Overview 11
4. Processing Overview 25
5. Business Improvement 29
6. Social Licence to Operate 33
7. Cultural Transformation 36
8. Summary 38
33Community Relations
CSR Highlights
Involvement of communities in project appraisals
Health: Investment in a clinic in Bugarama, Kakola VCT and
support health programs at district level
Education: Schools and supporting facilities, support of IMTT
Utilities: Support road maintenance, electrification and
provision of water at various points
Pipeline to supply sufficient water to the community from
Lake Victoria
Employee Assistance: Support of the employees living in the
community through the housing scheme, the counseling
services and loans through BUIKA SACCOS
Enterprise development: Supporting commercialisation of
small ventures to supply Bulyanhulu
Sports and Culture: Support community in sports events
34Government Relations and Stakeholder Engagement
Conducted at Regional (Shinyanga), District (Msalala) and at
Village (14 villages of immediate impact) levels
Conducted with government, political, commercial, civil society
and community sectors , amongst others
Offers mine site’s social license to operate while addressing
top priority risks
Addresses key CR and BGML areas of interest - fulfillment of
Social Obligations, Grievance Management, Influx
Management, Trespassing and Illegal Mining Management,
Community Safety, Local Procurement (Alternative Livelihood
programs) and Local Employment
Work with various departments to attain goals – Security, HR,
Supply Chain, OH, Safety, Environment , among others
Informed by Stakeholder Perception Monitoring (last major
one undertaken in 2012, however, perception is gathered
periodically through various engagements)
35Contents
1. Introduction 1
2. Asset Overview 7
3. Mining Overview 11
4. Processing Overview 25
5. Business Improvement 29
6. Social Licence to Operate 33
7. Cultural Transformation 36
8. Summary 38
36Cultural Transformation Program
The Revolution Model, getting it right
Liberating the capability of our people
Increasing leadership and membership skills
Driving key behaviours throughout the
business to deliver our strategy
Our key people including all our leaders, Managing Culture: Cultural Change Curve
influencers, and key operational personal
both from ABG and our major contractors
Social process literacy and role clarity
37Contents
1. Introduction 1
2. Asset Overview 7
3. Mining Overview 11
4. Processing Overview 25
5. Business Improvement 29
6. Social Licence to Operate 33
7. Cultural Transformation 36
8. Summary 38
38Key priorities going forward
Improve on our excellent safety record
Re-engineer and right size the mine to deliver potential
Drive leadership transformation and accountability
Which will drive production of 350Koz at AISC of around $900 per ounce
by the end of 2015
39Disclaimer
Important Notice
This presentation has been provided to you for information purposes only. It does not constitute an offer, solicitation, invitation or inducement to purchase, subscribe or otherwise acquire or
to sell or otherwise dispose of any securities of African Barrick Gold plc ("ABG") or engage in any investment activity in connection with the capital of ABG in any jurisdiction. The information
or opinions contained in this presentation shall not form the basis of, or be relied on in connection with, or act as any inducement to enter into, any contract or commitment or investment
decision whatsoever in connection with ABG.
The information and opinions contained in this presentation are provided as of the date of this presentation and are subject to change without notice. ABG explicitly disclaims any
responsibility, obligation or undertaking to update or revise any information contained in this presentation after its date, whether as a result of new information, future events or otherwise.
No reliance may be placed for any purpose whatsoever on the information or opinions contained in this presentation or on its completeness and no liability whatsoever is accepted for any
loss howsoever arising from any use of this presentation or its contents.
Certain information, statements, beliefs and opinions in this presentation are forward looking. Forward-looking statements are statements that are not historical facts. These statements
include, without limitation, financial projections and estimates and their underlying assumptions, statements regarding plans, objectives and expectations with respect to future production,
operations, costs, products and services, and statements regarding future performance. Forward-looking statements are generally identified by the words "plans," "expect," "anticipates,"
"believes," "intends," "estimates" and other similar expressions. All forward-looking statements involve a number of risks, uncertainties and other factors. Although ABG’s management
believes that the expectations reflected in such forward-looking statements are reasonable, investors are cautioned that forward-looking information and statements are subject to various
risks and uncertainties, many of which are difficult to predict and generally beyond the control of ABG, that could cause actual results and developments to differ materially from those
expressed in, or implied or projected by, forward-looking information and statements contained in this presentation. Factors that could cause or contribute to differences between the actual
results, performance and achievements of ABG include, but are not limited to, political, economic and business conditions, industry trends, competition, fluctuations in the spot and forward
price of gold or certain other commodity prices, changes in regulation, currency fluctuations (including the US dollar, South African rand and Tanzanian shilling exchange rates), ABG’s ability
to successfully integrate future acquisitions, to recover its reserves or develop new reserves, including its ability to convert its resources into reserves and its mineral potential into resources
or reserves and to timely and successfully process its mineral reserves, trespass, theft and vandalism, changes in its business strategy, as well as risks and hazards associated with the
business of mineral exploration, development, mining and production. Accordingly, investors should not place reliance on forward-looking statements contained in this presentation. Any
forward-looking statements in this presentation speak only as of the date of this presentation and only reflect information available at the time of preparation. Subject to the requirements of
the Disclosure and Transparency Rules and the Listing Rules or applicable law, ABG explicitly disclaims any obligation or undertaking publicly to update or revise any forward-looking
statements contained in this presentation, whether as a result of new information, future events or otherwise.
No statements made in this presentation regarding expectations of future profits are profit forecasts or estimates, and no statements made in this presentation should be interpreted to mean
that ABG’s profits or earnings per share for any future period will necessarily match or exceed the historical published profits or earnings per share of ABG or any other level.
You are reminded that you have received this presentation subject to the disclaimer and important notices contained herein and on the basis that you are a person to whom this presentation
may be lawfully made and delivered in accordance with the laws of the jurisdiction in which you are located. You may not and are not authorised to: (i) reproduce or publish this
presentation; or (ii) distribute, disclose or pass on this presentation to any other person, in whole or in part, by any medium or in any form, whether electronically or otherwise. ANY
FORWARDING, DISTRIBUTION OR REPRODUCTION OF THIS PRESENTATION IN WHOLE OR IN PART IS UNAUTHORISED. FAILURE TO COMPLY WITH THIS NOTICE MAY RESULT IN A
VIOLATION OF APPLICABLE SECURITIES LAWS.
40You can also read