A TRACK RECORD OF CREATING VALUE - November 2018 - AWS
←
→
Page content transcription
If your browser does not render page correctly, please read the page content below
A TRACK RECORD OF CREATING VALUE
November 2018
Cautionary Notes

SSRM:NASDAQ/TSX       PAGE 2
Why SSR Mining?
A long-term track record of creating value
Investor Challenges SSRM Investment Catalysts
× Inconsistent operating performance Met guidance six consecutive years
× Declining reserves Track record of reserve growth
× Declining production Production growth +40% through 2021
× Single asset risk Diversified operating platform
× Country risk Favorable jurisdictions
× Poor corporate governance Peer-leading governance rating
× Value destructive M&A Track record of growing NAV/share
× Lack of suitable investment vehicles Dual listed, strong liquidity
× Dilution risk, inability to self-fund Consistent cash build to $475M
SSRM:NASDAQ/TSX PAGE 3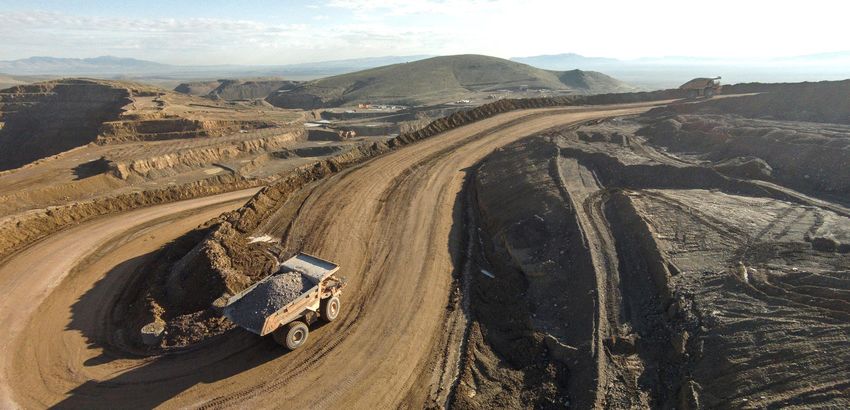
Track Record of Delivery
                                 Six-year history of meeting or exceeding guidance

                                         Reliable trend of delivering more                                                                                      …at lower cash costs with less
                                                      gold…                                                                                                               variability

                                         450                                                                                                                    1,200

                                         400                                                                                                                    1,100

                                                                                                                            Gold-Equivalent Cash Costs ($/oz)
     Gold-Equivalent Production (K oz)

                                                                                                                                                                1,000
                                         350

                                                                                                                                                                 900
                                         300

                                                                                                                                                                 800
                                         250
                                                                                                                                                                 700

                                         200
                                                                                                                                                                 600
                                                                     Production Guidance                                                                                                     Cash Cost Guidance
                                         150
                                                                                                                                                                 500
                                                                     Actual Production                                                                                                       Actual Cash Costs

                                         100                                                                                                                     400
                                               2012   2013   2014   2015          2016          2017                                                                    2012   2013   2014    2015       2016          2017

Notes: Gold Eq. ounces have been established using the realized silver price and the weighted average realized gold price at each of our operations in the respective years and applied to the recovered metal content of the gold
and silver ounces produced, as applicable. Realized metal prices and cash costs are non-GAAP financial measures. Please see "Cautionary Note Regarding Non-GAAP Measures” in this presentation.

 SSRM:NASDAQ/TSX                                                                                                                                                                                                       PAGE 4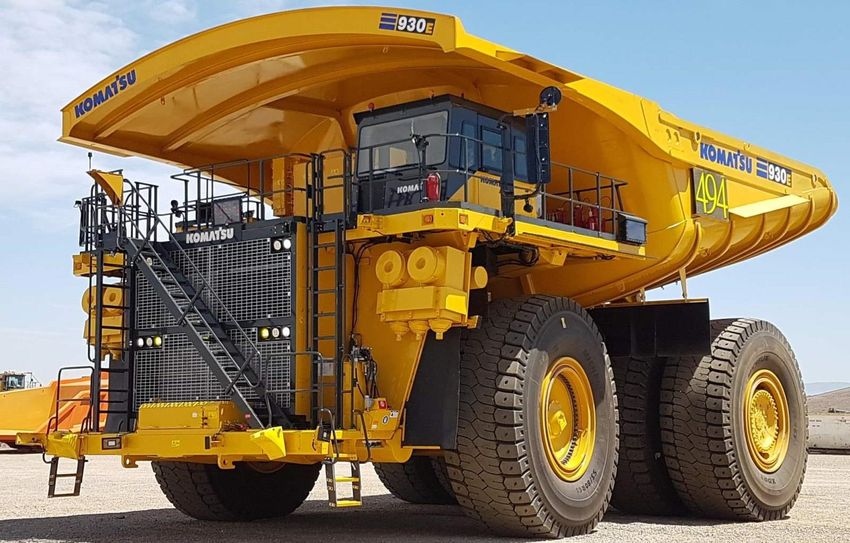
SSRM Q3 2018 Summary
Delivering Growth and Value for Shareholders
Q3
Units
2018
Increased gold equivalent production to Gold Sales oz 88,787
95,000 ounces at lower cash costs
Silver Sales Moz 0.6
Seabee record production of 27,831 Total Gold Equivalent Sales oz 96,760
oz of gold at record cash costs of Gold Equivalent Production oz 94,808
$447/oz gold Revenue $M $115.0
Income from Mine Operations $M $21.8
Marigold produced 58,459 oz of gold, Net Income $M $2.2
an 18% increase compared to Q2
Attributable Net Income $M $6.4
Basic Attributable EPS $ $0.05
Puna produced 666,000 oz of silver
Adjusted Attributable Net Income $M $10.8
Doubled operating cash flow and Adjusted Basic Attributable EPS $ $0.09
increased attributable earnings Cash Generated by Operating
$M $35.4
Activities
Notes: Cash costs is a non-GAAP financial measure. Please see "Cautionary Note Regarding Non-GAAP
Measures” in this presentation.
SSRM:NASDAQ/TSX PAGE 5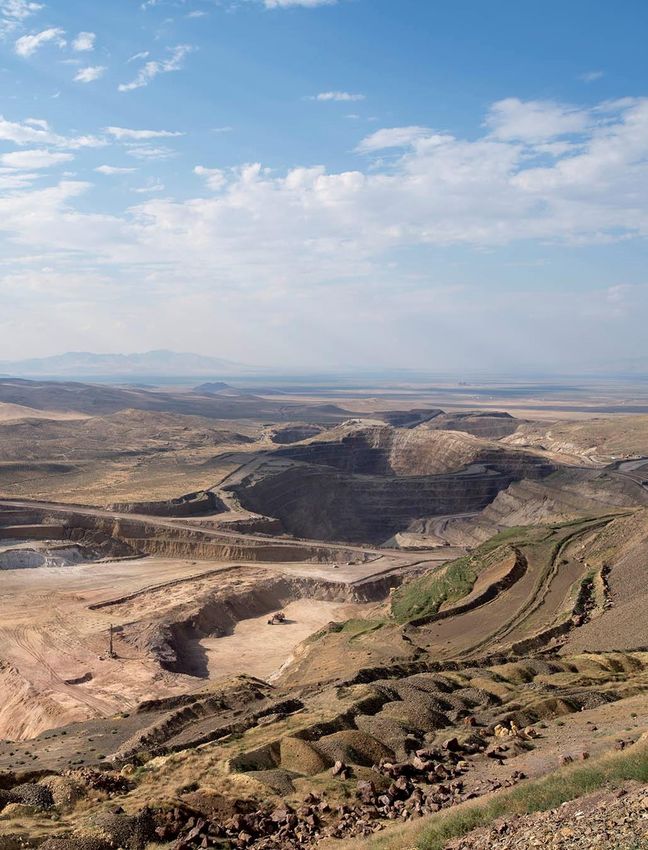
Enhanced 2018 Production and Cash Costs Guidance

                                            Marigold                                          Seabee                                             Puna                                     SSR Mining
                                                                                                                                            (75% interest)

                                                 Gold                                            Gold                                            Silver                                Gold Equivalent

    Production                        195K – 205K oz                                    90K – 95K oz                                   2.3M – 2.6M oz                                  315K – 335K oz

    Cash Costs                     $715/oz – $735/oz                                $535/oz – $560/oz                           $12.50/oz – $15.00/oz                                $690/oz – $730/oz
    (US$/oz)

 Mid-point Guidance                                          325,000 oz AuEq at lowered cash cost guidance of $710/oz in 2018
Notes: Puna Operations and SSR Mining figures are presented on an attributable basis. Puna Operations 2018 production guidance for lead and zinc is 1.1 to 1.5 million pounds and 6.7 to 7.5 million pounds, respectively, on a
75% basis. Gold equivalent production and cash costs are based on a 73:1 gold to silver ratio. Cash costs is a non-GAAP financial measure. Please see "Cautionary Note Regarding Non-GAAP Measures” in this presentation.

 SSRM:NASDAQ/TSX                                                                                                                                                                                                   PAGE 6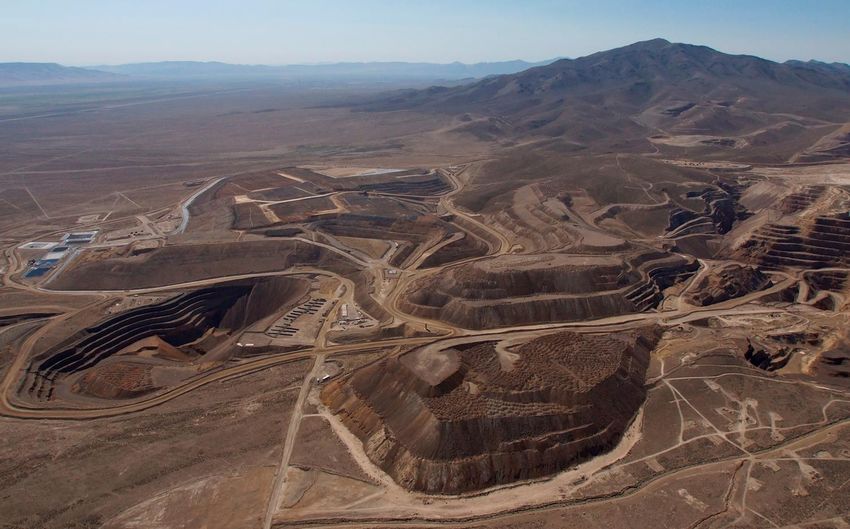
Track Record of Growth and Decreasing Costs

                                                         500                                                                                                                                    $1,200

                                                                                                                                                                                                $1,000
                                                         400

                                                                                                                                                                                                           Cash Cost ($/oz Gold-Equivalent)
                     Gold-Equivalent Production (k oz)

                                                                                                                                                                                                $800
                                                         300

                                                                                                                                                                                                $600

                                                         200
                                                                                                                                                                                                $400

                                                         100
                                                                                                                                                                                                $200

                                                          0                                                                                                                                     $0
                                                               2012A   2013A     2014A   2015A      2016A           2017A          2018E          2019E           2020E          2021E
                                                                               Puna          Marigold                      Seabee                        Cash Costs

        Strong Outlook                                                                +41% increase in annual AuEq production by 2021
Notes: Production and cash costs for 2017 reflect actual production and cash costs as reported in our news release dated February 22, 2018. Production and cash costs for 2018 reflect the mid-point of 2018 guidance as reported
in our news release dated November 8, 2018, and are presented on an attributable co-product basis. Production and cash costs for each of the 2019-2021 periods for each operation are based on the Marigold updated life of
mine reported in our news release dated June 18, 2018, the Seabee Gold Operation PEA as reported in our news release dated September 7, 2017 and the Puna Operations PFS as reported in our news release dated May 31,
2017. Puna Operations production reported on a 100% basis prior to formation of joint venture with Golden Arrow on May 31, 2017; subsequent to May 31, 2017, Puna Operations production is reported on a 75% basis. Gold
equivalent ounces have been established using the realized silver price and the weighted average realized gold price at each of our operations in the respective years and applied to the recovered metal content of the gold and
silver ounces produced, as applicable. Gold equivalent production and cash costs are calculated on a co-product basis, utilizing historical prices through 2017, 2018 guidance as reported in our news release dated January 15,
2018, and Mineral Reserve prices for 2019-2021. Realized metal prices and cash costs are non-GAAP financial measures. Please see "Cautionary Note Regarding Non-GAAP Measures” in this presentation.

 SSRM:NASDAQ/TSX                                                                                                                                                                                                                              PAGE 7
Track Record of Growing Net Asset Value Per Share

                                  $13

                                  $12

                                  $11                                                                                                                                                           +68%
         Net Asset Value ($/sh)

                                  $10

                                   $9

                                   $8

                                   $7

                                   $6                                                                                                                                                           -10%

                                   $5

                                   $4
                                    Dec-14   Jun-15              Dec-15               Jun-16              Dec-16               Jun-17               Dec-17              Jun-18

                                                                                 SSR Mining                       Peer Index

Notes: Peer index represents an equal weighted index, indexed to SSR Mining NAV per share beginning December 31, 2014 and ending November 15, 2018; peer index includes Coeur, Hecla, Tahoe Resources, OceanaGold,
Torex Gold, New Gold, B2 Gold, Detour Gold, Eldorado Gold and Fortuna. McEwen Mining data not applicable for inclusion in peer index. Source: Capital IQ.

                                                                                                                                                                                                        PAGE 8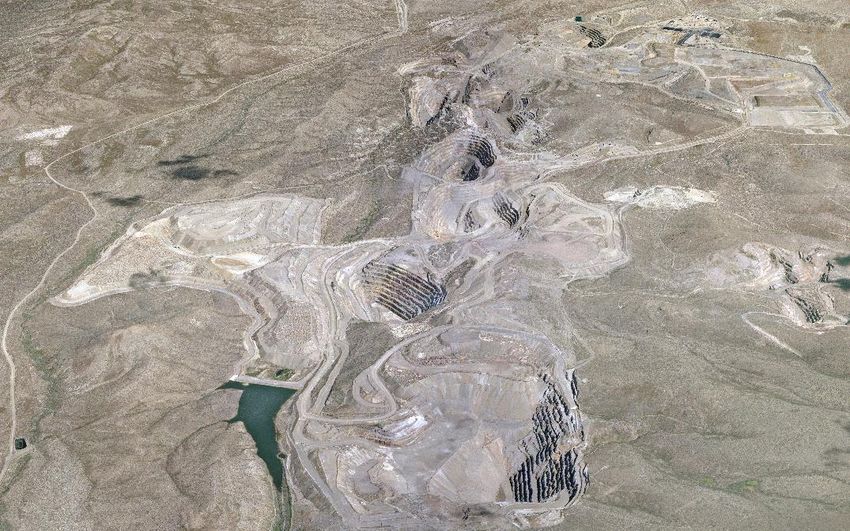
Highest Corporate Governance Rating Leads Peer Group
Depth of experience at senior management and Board level
Proven management team focused
on shareholder returns
Eight of nine Board members are
non-executive, including Chairman
Strong shareholder protections
through robust governance policies
Compensation structure aligned with
shareholder interests
Source: FactSet, ISS and BMO Capital Markets as of August 22, 2018.
SSRM:NASDAQ/TSX PAGE 9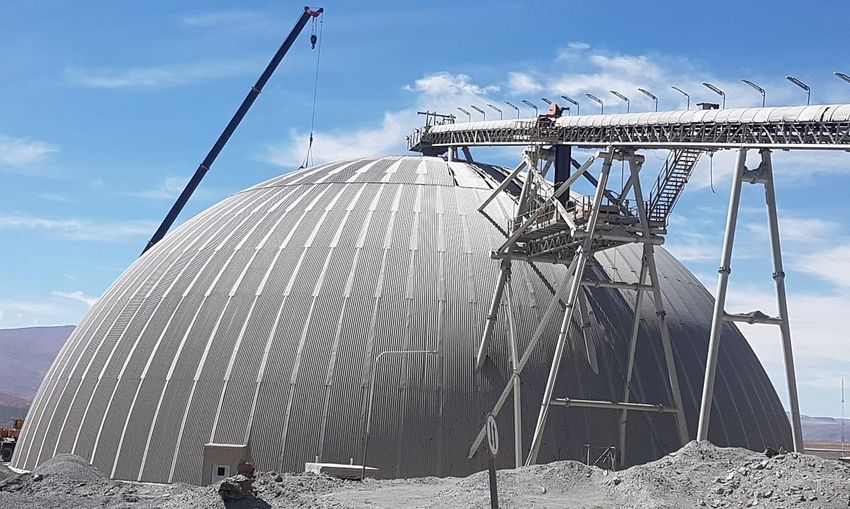
Marigold: Large Scale, Low-Cost Producer
Open pit, run-of-mine heap leach gold operation
2018 mid-point guidance of 200,000 ounces gold
YTD 2018 gold production of 150,855 ounces
Moved a record 21.3M tonnes in Q3 2018
Twin Creeks Goldstrike
~200,000 tonnes of material moved per day MARIGOLD Maverick
Springs
Phoenix
Strong safety and environmental practices Cortez
Carlin Trend
Excellent infrastructure Battle Mountain-
Eureka Trend
10-year Mineral Reserves life with potential to extend
(subject to the current EIS process)
Marigold
SSR Mining project
Significant exploration upside Other mines in area
Notes: Cash costs is a non-GAAP financial measure. Please see "Cautionary Note Regarding Non-GAAP Measures” in this presentation.
SSRM:NASDAQ/TSX PAGE 11Transformation: Increased Production and Lower Costs
Targeting +265,000 oz gold production by 2021
Pre-Acquisition Revised LOMP Expanded
Mine Plan 2015/2016 Reserves and Fleet
+150,000 oz Au +200,000 oz Au +265,000 oz Au by 2021
250
Gold Production (K oz)
200
150
100
50
0
2012A 2013A 2014A 2015A 2016A 2017A 2018E 2019E 2020E 2021E 2022E
Compelling Base Case Upside from Equipment Replacement Study in 2019
Notes: 2018 production reflects 2018 guidance as reported in our news release dated January 15, 2018. Production for each of the 2019-2022 periods is based on the Marigold updated life of mine plan as reported in our news
release dated June 18, 2018.
SSRM:NASDAQ/TSX PAGE 12Marigold Mineral Reserves and Resources Increased Y-o-Y
Mineral Reserves gold grade increased to 0.46 g/t
7
0.63
5.66
Gold Mineral Reserves and Mineral Resources
6
5
(million ounces)
4
0.36 3.19
2.84 (0.22) 0.21
3
2
1
0
2016 Depletion Model Exploration 2017 2017 M+I 2017
Reserves Assumptions Reserves Resources Inferred
Resources
Notes: Mineral Reserves are based on $1,250/oz gold price assumption. Mineral Reserves include 0.19 million ounces of leach pad inventory. Probable Mineral Reserves have a grade of 0.46 g/t. Mineral Reserves figures have
some rounding applied, and thus totals may not sum exactly. Measured and Indicated Mineral Resources are inclusive of Mineral Reserves. Mineral Resources include 0.19 million ounces of leach pad inventory. Mineral
Resources are based on $1,400/oz gold price assumption. Measured and Indicated Mineral Resources have a grade of 0.46 g/t. Inferred Mineral Resources have a grade of 0.41 g/t. Mineral Resources figures have some rounding
applied, and thus totals may not sum exactly. Please refer to “Cautionary Notes” and “Reserves and Resources: Notes to Table” in this presentation.
SSRM:NASDAQ/TSX PAGE 13Marigold: Exploration Success and Resource Conversion
8N
TZN
8S
8SX
N Red HideOut
Dot
North Leach
Pad
Red
Dot
MUD
Waste
Valmy
Mackay reserve
pit outline Current mining area
Basalt-Antler
SSRM:NASDAQ/TSX PAGE 14Marigold: Exploration Success and Resource Conversion
TZN 8D
8S
8SX
N Red HideOut
Dot
North Leach
Pad
A’
September 2017 Pit
Surface Original Surface
EOY 2017 Mackay
EOY 2017 Resource Pit EOY 2017 Gold grade model Reserve Pit
Shell
Gold Grade (g/t)
< 0.06
0.06 – 0.6
0.6 – 1.0
MRA6647 > 1.0
MRA6692 MRA6620
185.9 m at 1.23 g/t
71.6 m at 1.31 g/t 33.5 m at 2.28 g/t
Incl. 6.1 m at 8.83 g/t 75 meters
Incl. 19.8 m at 3.13 g/t Incl. 25.9 m at 2.90 g/t
Incl. 32.0 m at 3.63 g/t
Notes: Measured and Indicated Mineral Resources are inclusive of Mineral Reserves. Please refer to our news releases dated February 23, 2017, May 1, 2017, September 5, 2017, and November 6, 2018 for further details. See
also “Cautionary Notes” and “Reserves & Resources: Notes to Tables” in this presentation.
SSRM:NASDAQ/TSX PAGE 15Growth Options with Potential Resource Conversion
In 2019, evaluate mine fleet investment plan
Technical Report Red Dot Conversion
Scenario A: Scenario B: Scenario C:
2017 Reserve Expansion Extend Life
Material Movement Mtpa +80 +110 +80
Life of Mine (active mining) years +10 10 - 15 10 - 15
Resource Conversion yes/no No Yes Yes
Gold Production oz/yr +210,000 Up to 300,000 +210,000
Mining Cost $/tonne $1.50Marigold: Opportunities
Continue to deliver robust operating
margins
Additional hauling capacity and
equipment replacement study
Mine-life extension through
exploration at Valmy, East Basalt and
Red Dot
2018 exploration budget of $9M,
80% increase from 2017
Deep sulphide exploration
SSRM:NASDAQ/TSX PAGE 17SEABEE GOLD OPERATION HIGH-GRADE GOLD MINE
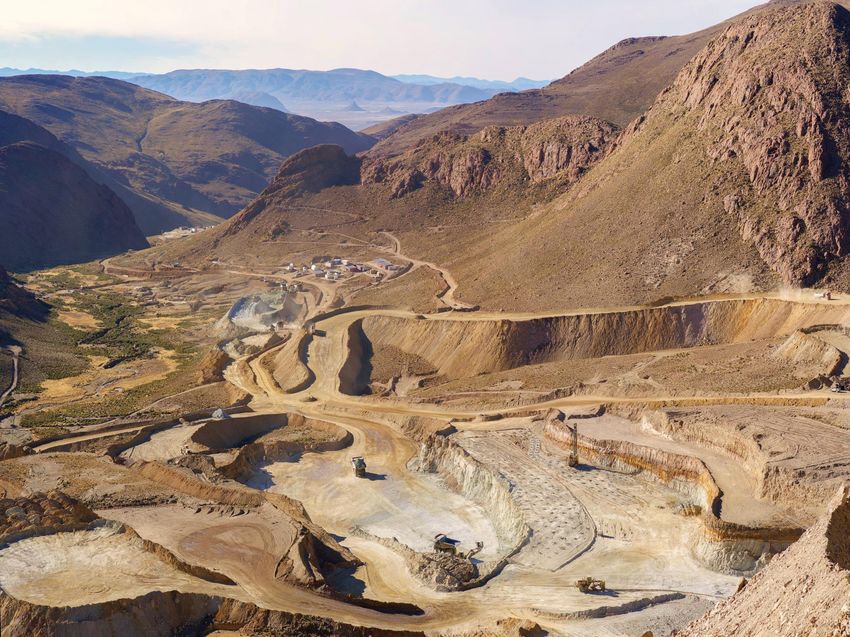
Seabee: Overview
High-margin underground operation in a stable jurisdiction
High-grade, underground mine in Saskatchewan, Canada
Strong safety and environmental practices
Large underexplored land position of +57,000 ha
2018 mid-point guidance improved to 92,500 ounces gold
YTD 2018 gold production of 75,130 ounces Seabee
Gold
Operation
Flin Flon
Record low cash costs of $447 per ounce in Q3 2018
Saskatoon
Produced a record 83,998 ounces of gold in 2017 at cash costs
of $602 per ounce
Notes: Cash costs is a non-GAAP financial measure. Please see "Cautionary Note Regarding Non-GAAP Measures” in this presentation.
SSRM:NASDAQ/TSX PAGE 19Seabee Mineral Reserves and Resources Increased Y-o-Y
Mineral Reserves gold grade increased to 9.9 g/t
1,400 674
1,200
1,000
Gold Mineral Reserves and Resources
800
(thousand ounces)
681
600
166 437
361 92
400
200
0
2016 Depletion Exploration 2017 2017 M+I 2017
Reserves Reserves Resources Inferred
Resources
Notes: Mineral Reserves are based on $1,250/oz gold price assumption. Proven and Probable Mineral Reserves have a grade of 9.88 g/t. Measured and Indicated Mineral Resources are inclusive of Mineral Reserves. Mineral
Resources are based on $1,400/oz gold price assumption. Measured and Indicated Mineral Resources have a grade of 10.74 g/t. Inferred Mineral Resources have a grade of 9.29 g/t. Mineral Reserves and Mineral Resources
figures have some rounding applied, and thus totals may not sum exactly. Please refer to “Cautionary Notes” and “Reserves and Resources: Notes to Table” in this presentation.
SSRM:NASDAQ/TSX PAGE 20On Track for Fifth Consecutive Annual Production Record
140 $1,200
Acquired
120
120 the Seabee Gold Operation
May 31, 2016 $1,000
108
$998
$954 100
100
93
$800
Cash Costs ($/oz gold)
84
77
Gold Production (k oz)
80 $757 75
$663 $600
63
$602
60 $548
$525 $540
50 $504
45
$442 $400
40
$200
20
0 $0
2012A 2013A 2014A 2015A 2016A 2017A 2018E 2019E 2020E 2021E
Notes: Production and cash costs for 2017 reflect actual production and cash costs as reported in our news release dated February 22, 2018. Production and cash costs for 2018 reflect the mid-point of 2018 guidance as
reported in our news release dated August 9, 2018. Production and cash costs for each of the 2019-2021 periods is based on the Seabee Gold Operation PEA as reported in our news release dated September 7, 2017. The
Seabee Gold Operation PEA is preliminary in nature and includes Inferred Mineral Resources that are considered too speculative geologically to have the economic considerations applied to them that would enable them to be
categorized as Mineral Reserves, and there is no certainty that the Seabee Gold Operation PEA will be realized. Cash costs is a non-GAAP financial measure. Please see "Cautionary Note Regarding Non-GAAP Measures” in
this presentation.
SSRM:NASDAQ/TSX PAGE 21Operational Excellence Driving Seabee Mill Improvements
Step-change tonnage improvements since acquisition
1,500
1,400
1,300
1,200
1,100
Mill Dry Tonnes per Day
1,000
900
800
700
600
500
400
Jan-16 Apr-16 Jul-16 Oct-16 Jan-17 Apr-17 Jul-17 Oct-17 Jan-18 Apr-18 Jul-18 Oct-18
SSRM:NASDAQ/TSX PAGE 22Seabee Exploration Update
Near-mine drilling at Santoy yielding significant results
Santoy Gap (9A, 9B, 9C) Santoy 8A
0m Elev
3.2m at 32.2g/t
(JOY-18-810)
2.6m at 27.5g/t
(JOY-18-807)
4.1m at 17.0g/t
(JOY-18-801)
4.8m at 12.0g/t
(JOY-18-799)
2.7m at 18.4g/t
(JOY-18-772) 10.7m at 3.7g/t
Santoy (JOY-18-831) (HW)
Gap HW
2.5m at 32.5g/t
3.7m at 8.2g/t (SUG-18-907)
(SUG-18-624) (HW)
3.7m at 20.5g/t
4.1m at 25.6g/t (SUG-18-909)
(SUG-18-622) (HW) 7.0m at 14.1g/t
(SUG-18-943)
7.0m at 12.2g/t
1.9m at 37.6g/t (SUG-18-913)
(SUG-17-058)
18.5m at 11.2g/t
(SUG-18-941)
1.9m at 200.9g/t
(JOY-13-690)
4.8m at 12.3g/t 6.3m at 12.5g/t
(SUG-18-612) (HW) (SUG-18-955)
800m Elev >20 Gram-meters, Exploration PeriodSantoy Gap Hanging Wall
Recent drilling confirms discovery near existing infrastructure
Note: Please see our news release dated November 6, 2018 for further details.
SSRM:NASDAQ/TSX PAGE 24Large, Contiguous Land Package
23,300 hectare land
package at Seabee
Carr target
CRJ target
Seabee Mine/mill Santoy 3 target
airstrip & camp
Santoy Mine
Fisher exploration
camp
34,000 hectare land package
at Fisher Project (option
agreement)
10 km
All weather road
Gold occurrence
Santoy shear zone
SSRM:NASDAQ/TSX PAGE 25Seabee: Opportunities
Deliver on PEA expansion case to 1,050 tpd
Drive Operational Excellence initiatives
Evaluate 1,200 tpd sustained mill throughput
80% increase in exploration to $9M in 2018
Santoy Gap Hanging Wall
Santoy 8A Seabee
Gold
Operation
Fisher extension Flin Flon
Saskatoon
Convert Inferred Resources to Measured
and Indicated
Note: The Seabee Gold Operation PEA is preliminary in nature and includes Inferred Mineral Resources that are
considered too speculative geologically to have the economic considerations applied to them that would enable them to be
categorized as Mineral Reserves, and there is no certainty that the Seabee Gold Operation PEA will be realized. Please
refer to our news release dated September 7, 2017 for further details.
SSRM:NASDAQ/TSX PAGE 26PUNA OPERATIONS LARGE-SCALE SILVER PRODUCER
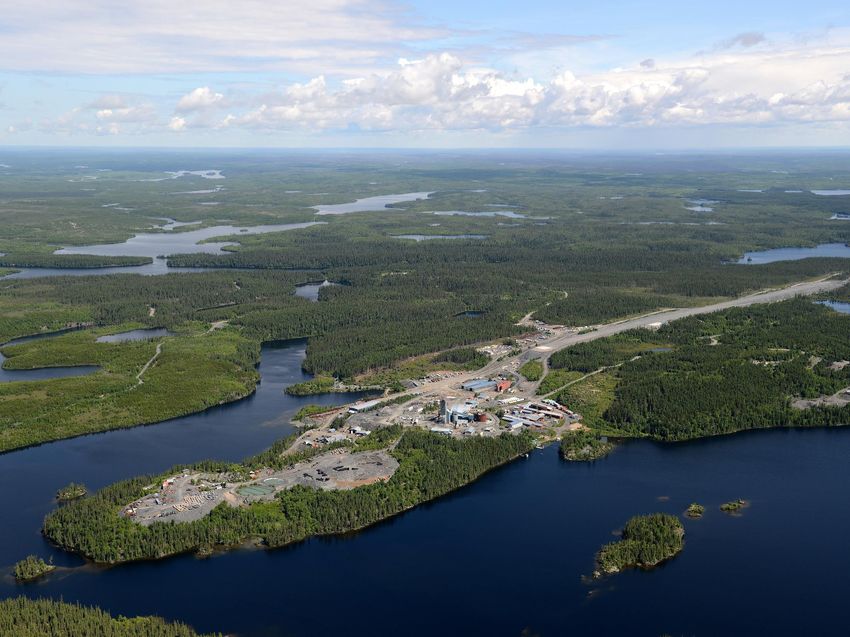
Puna Operations Joint Venture
Brownfields development for Pirquitas operating life extension
SSR Mining is the JV operator with a 75% interest
JV includes Chinchillas, a silver-lead-zinc deposit, and
the Pirquitas plant and facilities located 45 km away
Chinchillas construction initiated Q1 2018, sustained delivery of ore
to Pirquitas mill in Q4 2018
Pirquitas Operation
Jujuy, Argentina
On-track for commercial production by year-end 2018
Chinchillas Project
Jujuy, Argentina
Pirquitas plant capacity 5,000 tpd, with an operating life
Seabee
through +2025 Gold
Operation
Flin Flon
Produced 6.2M oz silver in 2017, exceeding improved
guidance, at cash costs of $13.07/oz silver Saskatoon
YTD 2018 production of 2.6M oz silver and 4.8Mlbs zinc
Notes: 2017 production presented on a 100% basis. For further information refer to our news releases on the Chinchillas project dated March 31, 2017, May 31, 2017, and November 7, 2017. Cash costs is a non-GAAP financial
measure. Please also refer to “Cautionary Notes” in this presentation.
SSRM:NASDAQ/TSX PAGE 28Puna Operations: Near Term Growth by 2019
Significant LOM base metals exposure from lead and zinc
2018 Guidance Medium Term Outlook
Production: 8 $16
6.9 6.9
6.8 $14
Silver: 2.3M to 2.6M ounces
Silver-Equivalent Production (M oz)
Cash Cost ($/oz Silver-Equivalent)
6 $12
Lead: 1.1M to 1.5M lbs $10
4 $8
Zinc: 6.7M to 7.5M lbs 2.9
$6
Cash costs: 2 $4
$2
$12.50/oz to $15.00/oz silver 0 $0
2018E 2019E 2020E 2021E
Silver Lead Zinc Cash Costs
Notes: Base metals exposure of 28% based on value of metal produced from the Puna Operations PFS. Production and cash costs for 2018 reflect the mid-point of 2018 guidance as reported in our news release dated
November 8, 2018, and are presented on an attributable co-product basis. Production and cash costs for each of the 2019-2021 periods is based on the Puna Operations PFS as reported in our news release dated May 31,
2017. Production is reported on a 75% basis. Silver-equivalent production calculated using Mineral Reserve prices for 2018-2021. Cash costs is a non-GAAP financial measure. Please see "Cautionary Note Regarding Non-
GAAP Measures” in this presentation.
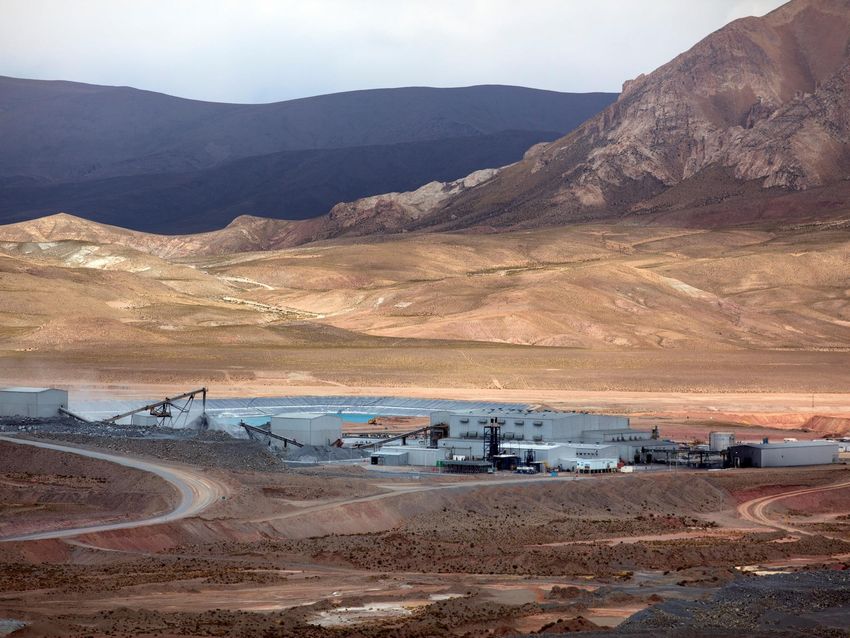
SSRM:NASDAQ/TSX PAGE 29Chinchillas Project Development On Track
Pre-stripping advancing as planned
Key milestones: completed stockpile
dome, road by-passes, power line
upgrade
Commercial production expected
Q4 2018
Project remains on budget
Pre-stripping activities advancing as planned
Road by-passes operational Stockpile dome construction complete
SSRM:NASDAQ/TSX PAGE 30Portfolio Rationalization
Maximizing value of portfolio with property sales
9
2
7
8. Maverick Springs 1 8
Brucejack
San Marcial Snowfield 1. Marigold
7. Amisk 2. Seabee
(Pretium) 5. San Luis 6
9. Sunrise Lake
3. Puna Operations
Berenguela (Chinchillas)
Diablillos
Candelaria 4. Puna Operations
(Pirquitas UG)
Bowdens
San Agustin 6. Pitarrilla 5
Parral
Challacollo
Silvertip 3
4
Operating mines
owned by SSR Mining
Projects owned by
SSR Mining
Properties sold or
optioned from 2010
to present
SSRM:NASDAQ/TSX PAGE 31SSR Mining Inc.
Delivering value and growth for our shareholders
Production and Q3 2018 produced 94,808 gold equivalent ounces at
Free Cash Flow $682/oz cash costs
Growth Production growth to +440,000 oz AuEq by 2021
Near-term Ramp up at Seabee to 1,050 tpd in 2019
Investment Marigold equipment replacement study in 2019
Catalysts
Sustained delivery of ore to Pirquitas mill in Q4 2018
Strong Strong liquidity position with $475M of cash
Financial Q3 2018 operating cash flow of $35M
Position Track record of disciplined capital allocation
Increased confidence on portion of Red Dot Inferred to
Exploration upgrade by year-end 2018
Upside Expect additional Inferred at Santoy Gap HW
Advancing surface activities at Fisher
Notes: Cash and cash equivalents as of September 30, 2018. Please also refer to “Cautionary Notes” in this presentation.
SSRM:NASDAQ/TSX PAGE 32Value
&
Growth
SSRM:NASDAQ/TSX PAGE 33Track Record of Free Cash Flow Generation
$500
Acquired
$400 Acquired
Seabee
Marigold
Cash and Cash Equivalents ($M)
(all shares)
(all cash)
$300
$200
$100
$0
Q1 Q2 Q3 Q4 Q1 Q2 Q3 Q4 Q1 Q2 Q3 Q4 Q1 Q2 Q3 Q4 Q1 Q2 Q3
2014 2014 2014 2014 2015 2015 2015 2015 2016 2016 2016 2016 2017 2017 2017 2017 2018 2018 2018
Ops Driven FCF Consistent growth in cash balance over time
Note: SSR Mining’s cash and cash equivalents as per financial statements as at each respective quarterly date.
SSRM:NASDAQ/TSX PAGE 34Selected Financial Results for 2016 and 2017
Units 2017 2016
Gold Sales oz 286,279 254,761
Total Silver Sales Moz 6.0 11.4
Total Gold Equivalent Sales oz 367,950 408,860
Gold Equivalent Production oz 370,486 393,325
Revenue $M $448.8 $491.0
Income from Mine Operations $M $113.3 $154.0
Net Income $M $71.5 $65.0
Basic Attributable Earnings per share $ $0.58 $0.63
Adjusted Attributable Net Income $M $40.1 $100.3
Adjusted Basic Attributable EPS $ $0.34 $0.97
Cash Generated by Operating Activities $M $144.7 $170.7
Cash and Cash Equivalents $M $459.9 $327.1
Return on Invested Capital % 13% 14%
Notes: Silver sales and gold equivalent sales are on a 100% basis. Gold equivalent sales are based on total gold and silver sales and the realized silver and gold prices for each corresponding
period. Realized metal prices, adjusted attributable net income and adjusted basic attributable earnings per share are non-GAAP financial measures. Please see "Cautionary Note Regarding Non-
GAAP Measures” in this presentation. “Return on Invested Capital” based on CIBC World Markets estimates, all other data sourced from SSR Mining public disclosures.
SSRM:NASDAQ/TSX PAGE 35SSR Mining Executive Team and Board of Directors
Depth of experience and a top governance rating
Paul Benson Nadine J. Block W. John DeCooman, Jr. Gregory J. Martin Kevin O’Kane
President and CEO VP, Human Resources VP, Business Development SVP and CFO COO
and Strategy
Michael Anglin Brian Booth Gustavo Herrero Richard Paterson Steven Reid
Chairman Director Director Director Director
Simon Fish Beverlee Park Elizabeth Wademan Paul Benson
Director Director Director Director, President and CEO
First decile corporate governance rating leads peer group
SSRM:NASDAQ/TSX PAGE 36Marigold Mine: Heap Leach Process
Once ore is loaded on the heap leach pad …
Average time to achieve primary recovery of +50% is 90 to 120 days
Average time to achieve overall recovery of 73% is seven to nine months
Most important factor to leach recovery time is loaded ore to ‘plastic’ distance
Every 100 feet of pad height extends leach recovery time by ~120 days
Extraction Rate of Recoverable Ounces
100%
90%
80%
70% 0-50 ft
Extraction Rate
60% 50 -100 ft
50% 100-200 ft
40%
200-300 ft
30%
300-400 ft
20%
10%
0%
1 2 3 4 5 6 7 8 9 10 11 12 13 14 15 16 17 18
Months After Ore is Placed on Leach Pad
SSRM:NASDAQ/TSX PAGE 37Aerial View of Marigold Mine SSRM:NASDAQ/TSX PAGE 38
Seabee: Preliminary Economic Assessment
Expanded margins from higher throughput and grade
Increases mining rate by 21% to 1,050 tpd by 2019, compared to 2016
Mines 62% of Inferred Mineral Resources
Increases estimated LOM average gold production by 29% to 100,000
ounces per year (for the period 2018 to 2023, compared to 2016)
Utilizes current infrastructure to allow for lower project capital of $90M over
seven years
LOM estimated cash costs of $548 per payable ounce gold sold
Pre-tax NPV(5%) of $364M ($1,300 gold price)
After-tax NPV(5%) of $292M ($1,300 gold price)
Notes: The Seabee Gold Operation PEA is preliminary in nature and includes Inferred Mineral Resources that are considered too speculative geologically to have the economic considerations applied to them that would enable them
to be categorized as Mineral Reserves, and there is no certainty that the Seabee Gold Operation PEA will be realized. Please refer to our news release dated September 7, 2017 for further details. Cash costs is a non-GAAP
financial measure. Please see "Cautionary Note Regarding Non-GAAP Measures” in this presentation.
SSRM:NASDAQ/TSX PAGE 39Seabee: PEA Financial Summary and Sensitivity Analysis
Cash Flows ($M) Pre-tax NPV (5%) Sensitivities ($M)
Net Revenue $893.5 Gold Price ($/oz)
Operating Costs $(346.0) $1,200 $1,300 $1,400
Royalties and Other $(28.5) 1.20:1 $289 $346 $403
Canadian
Δ in Working Capital $10.3 Exchange 1.25:1 $307 $364 $420
Operating Cash Flow $529.3 Rate
1.30:1 $319 $376 $433
Capital Costs $(89.5)
Reclamation $(7.2)
Pre-Tax Cash Flow $432.7
Tax $(86.0) Pre-tax NPV (5%) Sensitivities ($M)
Post-tax Cash Flow $346.7 Site Costs (% change)
NPV5% (pre-tax) $363.5 -10% 0% 10%
NPV5% (post-tax) $292.0 Infrastructure 10% $392 $359 $326
Gold price $1,300 per ounce Capital 0% $396 $364 $331
Exchange rate (2019 onwards) C$1.25:US$1.00 (% change)
-10% $401 $368 $335
Notes: The Seabee Gold Operation PEA is preliminary in nature and includes Inferred Mineral Resources that are considered too speculative geologically to have the economic considerations applied to them that would enable
them to be categorized as Mineral Reserves, and there is no certainty that the Seabee Gold Operation PEA will be realized. Please refer to our news release dated September 7, 2017 for further details. The Canadian exchange
rate is assumed to be 1.275:1 in 2017-2018 and 1.25:1 thereafter. Cash costs is a non-GAAP financial measure. Please see "Cautionary Note Regarding Non-GAAP Measures” in this presentation.
SSRM:NASDAQ/TSX PAGE 40Chinchillas Project: Data Sheet (100% Basis)
Near-term Production with Positive Pre-Feasibility Results
Mine life: 8 years N
Total material mined: 66.6 M tonnes
Strip ratio: 4.7
Processing rate: 4,000 tpd
6.1 Moz Silver
Average annual 35.0 Mlb Lead
production (8 years
active mining): 12.3 Mlb Zinc
8.4 Moz Silver Eq
51.0 Moz Silver
Total production:
71.0 Moz Silver Eq
$2.88 / t mined, mining costs
$15.34 / t milled, mining costs
Operating costs: $14.72 / t milled, processing cost
$7.00 / t milled, G&A costs Mineral Reserves and Resources
$8.29 / t milled, ore transport & other Tonnes Ag Pb Zn Ag Pb Zn
Cash costs: $7.40 / oz Silver (net of by-products) Mt g/t % % Moz Mlb Mlb
AISC: $9.75 / oz Silver (net of by-products)
P&P 11.7 154 1.20 0.49 58 310 127
Development capital: $81 M
Sustaining capital: $44 M M&I 29.3 101 0.90 0.60 96 581 386
NPV: $178 M (post-tax, 5%)
Inf 20.9 50 0.54 0.81 34 250 374
IRR: 29% (post-tax)
Notes: All data is as reported in the technical report entitled “NI 43-101 Technical Report Pre-feasibility Study of the Chinchillas Silver-Lead-Zinc Project Jujuy Province, Argentina” filed on May 31, 2017 and available under our
profile on the SEDAR website at www.sedar.com. Cash costs are net of estimated capitalized stripping over the life of mine. Metal price assumptions include $19.50/oz silver, $0.95/lb lead and $1.00/lb zinc. Silver equivalent
values are based on these metal price assumptions. Measured and Indicated Mineral Resources are inclusive of Mineral Reserves. Cash costs and AISC are non-GAAP measures. Please refer to “Cautionary Notes” and
“Reserves and Resources: Notes to Table” in this presentation.
SSRM:NASDAQ/TSX PAGE 41San Luis Project: A unique high-grade gold reserve with exploration upside
Pitarrilla Project: Large undeveloped silver resource
San Luis Project Pitarrilla Project
Feasibility Study Results (June 2010) Feasibility Study Results (December 2012)
Mine life: 3.5 years Mine life: 32 years
Average annual 1.9M oz Ag Average annual
15M oz Ag (1st 18 years)
production: 78,000 oz Au production:
Cash costs: $313 / oz Au Cash costs: $10.01 / oz Ag
9.0M oz Ag at 578.1 g/t 496.5M oz Ag at 96.7 g/t (open pit)
Resources (M+I): Resources (M+I):
0.35M oz Au at 22.4 g/t 28.8M oz Ag at 173.5 g/t (U/G)
Capital: $90 -$100M Capital: $741M
Mill throughput: 400 tonnes per day Strip ratio: 6:1
Mill throughput: 16,000 tonnes per day
NPV: $39M (base case)
NPV (after tax): $737M ($25/oz Ag price)
IRR: 26.5% (base case)
Volcanic hosted, low sulphidation, IRR (after tax): 12.8% (base case)
Deposit type:
epithermal quartz vein deposit
Silver-lead-zinc deposit
Deposit type:
open pit / UG project
Identify additional veins and following
Opportunities:
on existing exploration targets Opportunities: U/G start-up operation potential
Note: See “Cautionary Notes” and “Reserves & Resources: Notes to Tables” in this presentation. Also see Note: See “Cautionary Notes” and “Reserves & Resources: Notes to Tables” in this presentation. Also see “NI
“Technical Report for the San Luis Project Feasibility Study, Ancash Department, Peru” dated June 4, 2010 43-101 Technical Report on the Pitarrilla Project Durango State, Mexico” dated December 14, 2012 and
and available under our profile on the SEDAR website at www.sedar.com. available under our profile on the SEDAR website at www.sedar.com.
SSRM:NASDAQ/TSX PAGE 42Mineral Reserves
(as of December 31, 2017)
SSRM SSRM
Location Tonnes Silver Gold Lead Zinc SSRM Interest Interest
% Silver Gold
millions g/t g/t % % Interest million oz million oz
Proven Mineral Reserves
Seabee Canada 0.26 7.58 100 0.06
Chinchillas Argentina 1.64 180 0.75 0.42 75 7.1
Total 7.1 0.06
Probable Mineral Reserves
Marigold U.S. 205.10 0.46 100 3.00
Marigold Leach Pad Inventory U.S. 100 0.19
Seabee Canada 1.12 10.41 100 0.37
Chinchillas Argentina 10.07 150 1.27 0.50 75 36.3
Pirquitas Stockpiles Argentina 1.05 90 0.69 75 2.3
San Luis Peru 0.51 447 18.06 100 7.2 0.29
Total 45.8 3.85
Total Proven and Probable Mineral
Reserves
Marigold U.S. 205.10 0.46 100 3.00
Marigold Leach Pad Inventory U.S. 100 0.19
Seabee Canada 1.37 9.88 100 0.44
Chinchillas Argentina 11.71 154 1.20 0.49 75 43.4
Pirquitas Stockpiles Argentina 1.05 90 0.69 75 2.3
San Luis Peru 0.51 447 18.06 100 7.2 0.29
Total Proven and Probable 52.9 3.92
SSRM:NASDAQ/TSX PAGE 43Mineral Resources: Measured and Indicated
(as of December 31, 2017)
SSRM SSRM
Location Tonnes Silver Gold Lead Zinc SSRM Interest Interest
% Silver Gold
millions g/t g/t % % Interest million oz million oz
Measured Mineral Resources (Inclusive of Proven Mineral Reserves)
Seabee Canada 0.57 9.29 100 0.17
Chinchillas Argentina 3.09 128 0.60 0.41 75 9.5
Pitarrilla Mexico 12.35 90 0.70 1.22 100 35.7
Total 45.3 0.17
Indicated Mineral Resources (Inclusive of Probable Mineral Reserves)
Marigold U.S. 370.20 0.46 100 5.47
Marigold Leach Pad Inventory U.S. 100 0.19
Seabee Canada 1.40 11.33 100 0.51
Chinchillas Argentina 26.20 98 0.94 0.62 75 62.1
Pirquitas UG Argentina 2.63 292 4.46 75 18.6
Pirquitas Stockpiles Argentina 1.05 90 0.69 75 2.3
Pitarrilla Mexico 147.02 97 0.32 0.87 100 460.7
Pitarrilla UG Mexico 5.43 165 0.68 1.34 100 28.8
San Luis Peru 0.48 578 22.40 100 9.0 0.35
Amisk Canada 30.15 6 0.85 100 6.0 0.83
Total 587.5 7.34
Measured and Indicated Mineral Resources (Inclusive of Mineral Reserves)
Marigold U.S. 370.20 0.46 100 5.47
Marigold Leach Pad Inventory U.S. 100 0.19
Seabee Canada 1.97 10.74 100 0.68
Chinchillas Argentina 29.29 101 0.90 0.60 75 71.6
Pirquitas UG Argentina 2.63 292 4.46 75 18.6
Pirquitas Stockpiles Argentina 1.05 90 0.69 75 2.3
Pitarrilla Mexico 159.36 97 0.35 0.89 100 496.5
Pitarrilla UG Mexico 5.43 165 0.68 1.34 100 28.8
San Luis Peru 0.48 578 22.40 100 9.0 0.35
Amisk Canada 30.15 6 0.85 100 6.0 0.83
Total Measured and Indicated 632.7 7.52
SSRM:NASDAQ/TSX PAGE 44Mineral Resources: Inferred
(as of December 31, 2017)
SSRM SSRM
Location Tonnes Silver Gold Lead Zinc SSRM Interest Interest
% Silver Gold
millions g/t g/t % % Interest million oz million oz
Inferred Mineral Resources
Marigold U.S. 49.70 0.41 100 0.63
Seabee Canada 2.26 9.29 100 0.67
Chinchillas Argentina 20.92 50 0.54 0.81 75 25.4
Pirquitas UG Argentina 1.08 207 7.45 75 5.4
Pitarrilla Mexico 8.52 77 0.18 0.58 100 21.2
Pitarrilla UG Mexico 1.23 138 0.89 1.25 100 5.5
San Luis Peru 0.02 270 5.60 100 0.2 0.00
Amisk Canada 28.65 4 0.64 100 3.7 0.59
Total Inferred 61.4 1.90
SSRM:NASDAQ/TSX PAGE 45Reserves and Resources Notes to Tables All estimates set forth in the Mineral Reserves and Mineral Resources table have been prepared in accordance with National Instrument 43-101 - Standards of Disclosure for Mineral Projects (“NI 43-101”). The estimates of Mineral Reserves and Mineral Resources for each property other than the Marigold mine, the Seabee Gold Operation and the Amisk project have been reviewed and approved by Bruce Butcher, P.Eng., our Director, Mine Planning, and F. Carl Edmunds, P.Geo., our Chief Geologist, each of whom is a Qualified Person. Mineral Resources are reported inclusive of Mineral Reserves. Mineral Resources that are not Mineral Reserves do not have demonstrated economic viability. Due to the uncertainty that may be attached to Inferred Mineral Resources, it cannot be assumed that all or any part of an Inferred Mineral Resource will be upgraded to an Indicated or Measured Mineral Resource as a result of continued exploration. Mineral Resources and Mineral Reserves estimates of silver ounces for Puna Operations are reported on a 75% attributable basis. Mineral Resources and Mineral Reserves figures have some rounding applied, and thus totals may not sum exactly. All ounces reported herein represent troy ounces, and “g/t” represents grams per tonne. All $ references are in U.S. dollars. All Mineral Reserves and Mineral Resources estimates are as of December 31, 2017. Metal prices utilized for Mineral Reserves estimates are $1,250 per ounce of gold, $18.00 per ounce of silver, $0.90 per pound of lead and $1.00 per pound of zinc, except as noted below for the San Luis project. Metal prices utilized for Mineral Resources estimates are $1,400 per ounce of gold, $20.00 per ounce of silver, $1.10 per pound of lead and $1.30 per pound of zinc, except as noted below for each of the Chinchillas project, the San Luis project and the Amisk project. All technical reports for the properties are available under our profile on the SEDAR website at www.sedar.com or on our website at www.ssrmining.com. Marigold: All key assumptions, parameters and methods used to estimate Mineral Reserves and Mineral Resources and the data verification procedures followed are set out in the technical report entitled “NI 43-101 Technical Report on the Marigold Mine, Humboldt County, Nevada, USA” dated July 31, 2018 (the “Marigold Technical Report”). For additional information about the Marigold mine, readers are encouraged to review the Marigold Technical Report. Mineral Reserves estimate was prepared under the supervision of Thomas Rice, SME Registered Member, and a Qualified Person, and is reported at a cut-off grade of 0.065 g/t payable gold. Trevor J. Yeomans, ACSM, P. Eng, our Director, Metallurgy, is the Qualified Person who provided metallurgical parameters that were incorporated in the Mineral Reserves estimate. Mineral Resources estimate was prepared under the supervision of James N. Carver, SME Registered Member, our Chief Geologist at the Marigold mine, and Karthik Rathnam, MAusIMM (CP), our Chief Engineer at the Marigold mine, each of whom is a Qualified Person. Mineral Resources estimate is reported based on an optimized pit shell at a cut-off grade of 0.065g/t payable gold, and includes an estimate of Mineral Resources for mineralized stockpiles. Mineral Resources for mineralized stockpiles were estimated using Inverse Distance cubed. Seabee Gold Operation: Except for updates to cost parameters, metal price assumptions noted above, mill recovery and dilution to include recent operating results, and resource modeling techniques based on recommendations set forth in the technical report entitled “NI 43-101 Technical Report for the Seabee Gold Operation, Saskatchewan, Canada” dated October 20, 2017 (the “Seabee Gold Operation Technical Report”), all other key assumptions, parameters and methods used to estimate Mineral Reserves and Mineral Resources and the data verification procedures followed are set out in the Seabee Gold Operation Technical Report. For additional information about the Seabee Gold Operation, readers are encouraged to review the Seabee Gold Operation Technical Report. Mineral Reserves estimate was prepared under the supervision of Kevin Fitzpatrick, P.Eng., a Qualified Person and our Engineering Supervisor at the Seabee Gold Operation. Mineral Reserves estimate for the Seabee mine is reported at a cut-off grade of 4.55 g/t gold, and for the Santoy mine is reported at a cut-off grade of 3.68 g/t gold. Mineral Resources estimate was prepared under the supervision of Jeffrey Kulas, P.Geo., a Qualified Person and our Manager Geology, Mining Operations at the Seabee Gold Operation. Mineral Resources estimate for the Seabee mine is reported at a cut-off grade of 4.06 g/t gold, and for the Santoy mine is reported at a cut-off grade of 3.29 g/t gold. Block modelling techniques were used for Mineral Resources and Mineral Reserves evaluation for the Santoy mine and the majority of the Seabee mine. Polygonal techniques were used in areas of historical mining at the Seabee mine. The preliminary economic assessment set forth in the Seabee Technical Report is preliminary in nature, and it includes Inferred Mineral Resources that are considered too speculative geologically to have the economic considerations applied to them that would enable them to be categorized as Mineral Reserves, and there is no certainty that the preliminary economic assessment will be realized. Puna Operations: Chinchillas Mineral Reserves estimate is reported at a cut-off grade of $32.56 per tonne net smelter return (“NSR”). For additional information on the key assumptions, parameters and methods used to estimate Chinchillas Mineral Reserves and the data verification procedures followed, readers are encouraged to review the technical report entitled “NI 43-101 Technical Report Pre-feasibility Study of the Chinchillas Silver- Lead-Zine Project Jujuy Province, Argentina” dated May 15, 2017 (the “Chinchillas Technical Report”). Chinchillas Mineral Resources estimate is reported at a base case cut-off grade, which reflects the transport to and processing of ore at the Pirquitas property, of 60.00 grams per tonne silver equivalent based on projected operating costs and using metal price assumptions of $22.50 per ounce of silver, $1.00 per pound of lead and $1.10 per pound of zinc. For additional information on the key assumptions, parameters and methods used to estimate Chinchillas Mineral Resources and the data verification procedures followed, readers are encouraged to review the Chinchillas Technical Report. Pirquitas underground Mineral Resources (Pirquitas UG) estimate is reported below the completed open pit shell; Mineral Resources estimate for the Mining Area (which includes San Miguel, Chocaya, Oploca and Potosí zones) is reported at a cut-off grade of $100.00 per tonne NSR for San Miguel, Oploca and Potosi, and $90.00 per tonne NSR for Cortaderas. Pirquitas Mineral Reserves and Pirquitas Mineral Resources estimates in surface stockpiles are reported at a cut-off grade of $16.93 per tonne NSR, respectively, and were determined based on grade, rehandling costs and recovery estimates from metallurgical testing. San Luis: Mineral Reserves estimate is reported at a cut-off grade of 6.9 g/t gold equivalent, using metal price assumptions of $800 per ounce of gold and $12.50 per ounce of silver. Mineral Resources estimate is reported at a cut-off grade of 6.0 g/t gold equivalent, using metal price assumptions of $600 per ounce of gold and $9.25 per ounce of silver. Pitarrilla: Mineral Resources estimate for the open pit is reported at a cut-off grade of $16.38 per tonne NSR for direct leach material, and $16.40 per tonne NSR for flotation/leach material. Underground Mineral Resources (Pitarrilla UG) estimate is reported below the constrained open pit resource shell above a cut-off grade of $80.00 per tonne NSR, using grade shells that have been trimmed to exclude distal and lone blocks that would not support development costs. Amisk: Mineral Resources estimate was prepared by Sebastien Bernier, P.Geo., Principal Consultant (Resource Geology), SRK Consulting (Canada) Inc., a Qualified Person. Mineral Resources estimate is reported at a cut-off grade of 0.40 grams of gold equivalent per tonne using metal price assumptions of $1,100 per ounce of gold and $16.00 per ounce of silver inside conceptual pit shells optimized using metallurgical and process recovery of 87%, overall ore mining and processing costs of $15.00 per tonne and overall pit slope of fifty-five degrees.. SSRM:NASDAQ/TSX PAGE 46
SSR Mining Inc.
                       Share capital structure, convertible note and top shareholders overview
                       Top 10 Shareholders                                           % of Shares Outstanding
                                                                                                                                                   Institutional Holdings by Country
                       Van Eck                                                                      15.1%
                       Dimensional Fund Advisors, L.P.                                               5.1%
                       Renaissance Technologies
                                                                                                                                                                                                United States
                                                                                                     4.8%
                                                                                                                                                                                                Canada
                       Investec Asset Management                                                     3.0%
                                                                                                                                                                                                United Kingdom
                       Norges Bank Investment Management                                             2.6%                                                                                       Other
                       Sun Valley Gold                                                               2.4%
                       Ruffer LLP                                                                    2.4%
                       The Vanguard Group                                                            2.4%
                       Connor Clark & Lunn Investment Management                                     2.0%                             Holding by Investor Class:                   63% Institutional
                       Global X Management Company                                                   1.5%                                                                          37% Retail and Other

                        350
                                                                                                                                                                                                             $ Million
                        300
                                                                                                                                       Cash and Cash Equivalents                                               $475
Relative Performance

                        250

                        200                                                                                                            Marketable Securities                                                     $7

                        150
                                                                                                                                       Convertible Notes                                                       $265
                        100
                                                                                                                                       Credit Facility ($75M, undrawn)                                            -
                         50

                          0                                                                                                            Market Capitalization                                                  $1,305
                          Jan-15    Jul-15   Jan-16   Jul-16     Jan-17        Jul-17      Jan-18        Jul-18
                                       SSRM (105%)         Silver (-9%)               Gold (2%)                                        Total Shares Outstanding: 120.2 million

   Source: Capital IQ, Ipreo; as at November 15, 2018. Cash and cash equivalents, marketable securities, convertible notes, revolving credit facility and total shares outstanding as at November 15, 2018. Market capitalization
   as at November 15, 2018.

SSRM:NASDAQ/TSX                                                                                                                                                                                                       PAGE 47
SSR Mining Inc. www.ssrmining.com Toll-free: +1 888.338.0046 Telephone: +1 604.689.3846 Email: invest@ssrmining.com
You can also read