Driving Profitable Growth - through science-based, sustainable solutions Presentation to Investors - DSM

Page created by Juan Pratt
 
CONTINUE READING
Driving Profitable Growth - through science-based, sustainable solutions Presentation to Investors - DSM
Driving Profitable Growth
through science-based, sustainable solutions

Presentation to Investors
Q4 & Full Year 2015 results

ROYAL DSM
HEALTH NUTRITION MATERIALS
Driving Profitable Growth - through science-based, sustainable solutions Presentation to Investors - DSM
Safe harbor statement

   This presentation may contain forward-looking statements with respect to DSM’s future (financial) performance and
   position. Such statements are based on current expectations, estimates and projections of DSM and information
   currently available to the company. DSM cautions readers that such statements involve certain risks and uncertainties
   that are difficult to predict and therefore it should be understood that many factors can cause actual performance and
   position to differ materially from these statements. DSM has no obligation to update the statements contained in this
   presentation, unless required by law.

   More details on DSM’s Q4 2015 performance can be found in the Q4 2015 results press release, published together with
   this presentation. A more comprehensive discussion of the risk factors affecting DSM’s business can be found in the
   company’s latest Annual Report, which can be found on the company's corporate website, www.dsm.com

Page 1
Driving Profitable Growth - through science-based, sustainable solutions Presentation to Investors - DSM
Highlights Q4

  Q4 Group: net sales up 6% to €1,926 million and EBITDA up 3% to €261 million

  Q4 Nutrition: 7% organic growth with strong volume growth in both Animal and Human Nutrition

  Q4 EBITDA: Nutrition up 3%, Materials up 13%

  Strong Q4 operating cash flow of €313 million supported by working capital reduction

  2015: solid performance with Group net sales of €7,722 million and EBITDA up 4% to €1,075 million

  Proposed dividend stable at €1.65 per ordinary share

  Outlook 2016: “DSM aims to deliver increased full-year EBITDA and ROCE in line with the targets set out in its Strategy
   2018: Driving Profitable Growth”

Page 2
Driving Profitable Growth - through science-based, sustainable solutions Presentation to Investors - DSM
Quote from CEO Feike Sijbesma

                            “DSM’s fourth quarter performance, slightly ahead of expectations, was encouraging. We are
                            particularly pleased with our progress in Nutrition, where both Animal and Human Nutrition
                            delivered strong organic growth. Performance Materials continued to benefit from improved
                            margins. In addition, our focus on cash flow and working capital efficiency contributed to a
                            strong operating cash flow of €313 million.

                            This good progress in Q4 completes a year in which we achieved solid results. We delivered
                            strong organic growth in Nutrition despite lower vitamin E prices. Cost savings and good margin
                            management helped drive higher margins in Performance Materials, which also benefited from
                            lower input costs. Currencies, while being a mixed bag, had a favorable effect overall despite
                            the strengthened Swiss franc.

                            We expect to make further progress with our growth initiatives in 2016 both in Nutrition and
       Feike Sijbesma       Performance Materials although the macro-economic context remains challenging. These will be
     CEO / Chairman of      underpinned by our group-wide cost and productivity improvement programs as well as our
   the DSM Managing Board   disciplined focus on capital allocation and working capital. We are on track with these initiatives
                            which will help drive improved profitability and return on capital that we target with our
                            Strategy 2018.”

Page 3
Driving Profitable Growth - through science-based, sustainable solutions Presentation to Investors - DSM
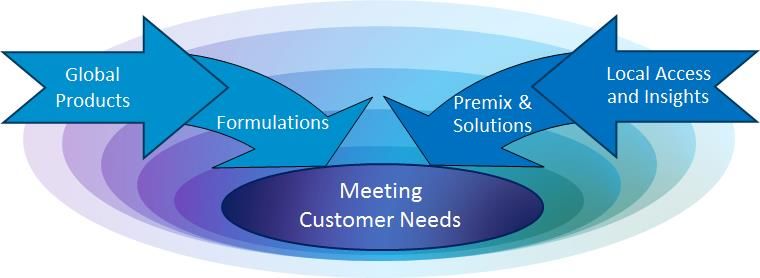
Key financials | Q4 and Full Year 2015

in € million                                                         Q4 2015   Q4 2014   % Change   FY 2015   FY 2014   % Change
 Sales - Continuing Operations                                         1,926     1,811        6%      7,722     7,051       10%
 EBITDA - Continuing Operations                                         261       254         3%      1,075     1,038        4%
 EBITDA margin - Continuing operations                                 13.6%     14.0%               13.9%     14.7%
 ROCE - Continuing Operations (%) 1                                                                   7.6%      8.2%
 Profit for the period, before exceptional items - Cont. Ops.            96        97         -1%      381       409         -7%
Profit for the period, after exceptional items - Total DSM               23       -107                  88       145        -39%
 Net EPS before exceptional items - Cont. Ops.                          0.53      0.56        -5%      2.14      2.34        -9%
Net EPS after exceptional items - Total DSM                             0.12     -0.63                 0.45      0.78       -42%
 Cash Flow - Continuing Operations                                      313       276        13%       800       663        21%
                                                 2
Exceptional items after tax - Total DSM                                  -63      -219                 -304      -252
1) ROCE calculated based on weighted average capital employed
2) Excluding share of profit of associates/ Joint Control entities

Page 4
Driving Profitable Growth - through science-based, sustainable solutions Presentation to Investors - DSM
Net sales development | Q4 2015

   in € million                     Q4 2015   Q4 2014   % Change   Volume Price/mix   FX   Other
    Sales - Continuing Operations     1,926     1,811        6%        3%       -2%   4%     1%
     Nutrition                        1,264     1,124       12%        7%       0%    3%     2%
     Performance Materials             601       618         -3%      -1%       -7%   5%
     Innovation Center                  40        42         -5%     -15%       1%    9%
     Corporate Activities               21        27
     Discontinued Operations             0       563

Page 5
Driving Profitable Growth - through science-based, sustainable solutions Presentation to Investors - DSM
Net sales development | Full Year 2015

   in € million                     FY 2015   FY 2014 % Change   Volume Price/mix    FX   Other
    Sales - Continuing Operations     7,722     7,051      10%       3%       -2%   8%      1%
     Nutrition                        4,963     4,335      14%       6%       0%    7%      1%
     Performance Materials            2,528     2,460       3%       0%       -4%   7%
     Innovation Center                 155        154       1%     -11%       0%    12%
     Corporate Activities               76        102
     Discontinued Operations          1,213     2,232

Page 6
Driving Profitable Growth - through science-based, sustainable solutions Presentation to Investors - DSM
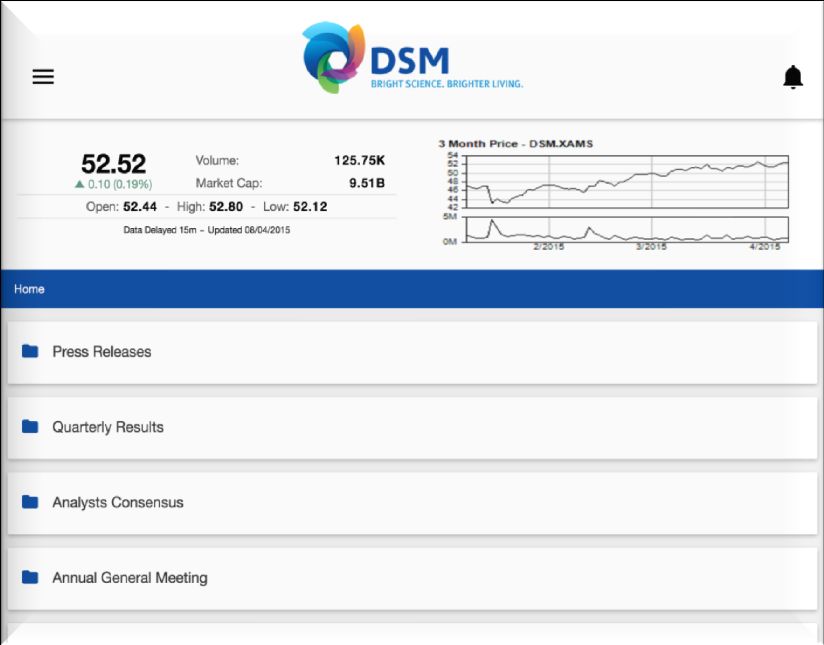
EBITDA development | Q4 and Full Year 2015

         in € million                     Q4 2015   Q4 2014   % Change   FY 2015   FY 2014   % Change
         EBITDA - Continuing Operations      261       254         3%      1,075     1,038        4%
           Nutrition                         206       200         3%       822       850         -3%
           Performance Materials              90        80        13%       384       323        19%
           Innovation Center                   -1        -3                   -9       -18
           Corporate Activities               -34       -23                 -122      -117
           Discontinued Operations             1        34                   95       128

Page 7
Driving Profitable Growth - through science-based, sustainable solutions Presentation to Investors - DSM
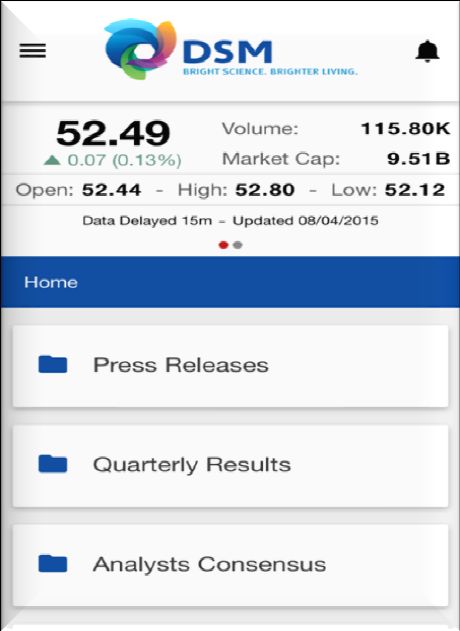
Nutrition | Sales overview

 Sales bridge – Q4 2014 to Q4 2015                              Sales bridge – Full Year 2014 to Full Year 2015
                                                     1,264                                                           4,963
                                             2%                                                             1%
                                   3%
                         0%                                                                       7%

                                                                                        0%
               7%
                                                                              6%
    1,124                                                          4,335

   Q4 2014   Volume   Price/mix    FX      Other    Q4 2015        2014     Volume   Price/mix    FX       Other     2015

    Q4 2015 sales up 12% compared to Q4 2014; 7% organic sales growth
     – Strong volume growth in both Animal and Human Nutrition & Health
     – Prices on average flat: negative impact of significantly lower vitamin E prices compensated by higher prices for a
       range of other nutritional products including in-sourced materials for DSM premix business

Page 8
Driving Profitable Growth - through science-based, sustainable solutions Presentation to Investors - DSM
Nutrition | Key financials

         in € million                                               Q4 2015      Q4 2014   % Change   FY 2015   FY 2014   % Change
         Sales                                                           1,264     1,124       12%      4,963     4,335       14%
         EBITDA                                                           206       200         3%       822       850         -3%
         EBITDA margin (%)                                               16.3%     17.8%               16.6%     19.6%
         EBIT                                                             123       125         -2%      535       596        -10%
         Capital Employed                                                                               5,309     5,034
                        1
         ROCE (%)                                                                                      10.3%     12.5%
         Total Working Capital                                                                          1,368     1,376
                                                2
         Total Working Capital as % of Sales                                                           27.1%     30.6%
         1) ROCE calculated based on weighted average capital employed
         2) Annualized last quarter sales

    Q4 2015 EBITDA was up 3% despite the negative impact of lower vitamin E prices (~€25 million) and a scheduled
     maintenance shut-down

    Q4 2015 EBITDA margin of 16.3% (slightly >17% when adjusted for maintenance shut-down)

Page 9
Animal Nutrition & Health | Sales overview

 Sales bridge – Q4 2014 to Q4 2015                              Sales bridge – Full Year 2014 to Full Year 2015
                                                                                                                    2,359
                                                      620                                                   -
                         2%       -1%
                                             -                                                   4%
                                                                                        1%

               7%
                                                                              8%
     572                                                           2,084

   Q4 2014   Volume   Price/mix    FX      Other    Q4 2015        2014     Volume   Price/mix   FX       Other     2015
    Q4 2015 sales strong with 9% organic growth despite tougher comparative figures:
     – Volumes were strong, in particular in premixes and specialty solutions (incl. enzymes, eubiotics) supported by
       positive year-end effects on timing of orders
     – Europe and Latin America (including Tortuga) performed well, Asia was slightly weaker
     – Prices up 2%: lower vitamin E prices more than compensated for by higher prices of other nutritional products
       (including insourced materials)

    FX had negative impact on total sales; stronger US dollar more than offset by weakness in South American
     currencies, especially the Brazilian real

Page 10
Animal Nutrition & Health | Vitamin E prices

            Vitamin E prices - € per kg1

            15

            10

              5

             0
             Jan-12          Jul-12   Jan-13   Jul-13    Jan-14      Jul-14     Jan-15      Jul-15      Jan-16

     Total EBITDA impact of lower Vitamin E prices was ~€25m in Q4 2015 and ~€100m in 2015 (compared to 2014)

1 Source: www.feedinfo.com

 Page 11
Human Nutrition & Health| Sales overview

 Sales bridge – Q4 2014 to Q4 2015                             Sales bridge – Full Year 2014 to Full Year 2015
                                                     450                                                          1,845
                                           0%-                                                           -0%

                                  9%
                                                                                                13%
                         -2%
               7%
     394                                                          1,626      2%        -1%

   Q4 2014   Volume   Price/mix   FX      Other    Q4 2015        2014     Volume   Price/mix   FX      Other     2015

    Q4 2015 sales were strong in Human Nutrition & Health, with 5% organic growth
     – Achieved against the background of ongoing weak conditions in the US and Latin America
     – Q4 2015 growth was encouraging, although the comparison with Q4 2014 was relatively easy

    By segment:
     – Food & beverage markets mixed: weak in the US & Latin America; good performance in Europe and Asia
     – Dietary Supplements: Improved sales in US in both fish oil- and (multi)vitamin-based supplements despite
       continued weakness in the US market. i-Health delivered strong double-digit sales growth again
     – Infant Nutrition reported higher volumes compared to the same period in 2014

Page 12
Performance Materials | Sales overview

 Sales bridge – Q4 2014 to Q4 2015                            Sales bridge – Full Year 2014 to Full Year 2015
     618                                                                                                        2,528
                                                                                                         -
              -1%
                                                    601         2,460
                                           -                               0%
                                                                                               7%
                         -7%
                                  5%                                                 -4%

   Q4 2014   Volume   Price/mix   FX     Other   Q4 2015        2014     Volume   Price/mix    FX      Other    2015
   Q4 2015 sales 3% below Q4 2014:
    – Prices down 7% reflecting lower input costs
    – Volumes marginally down but with an improved momentum towards the end of Q4
   DSM Engineering Plastics: Volumes up, mainly driven by good performance in compounds and specialty products.
    Polyamide 6 polymer volumes were down
   DSM Resins and Functional Materials: Volumes weak due to ongoing sluggish market conditions. However, during the
    quarter DSM continued to see transition towards more sustainable waterborne resins especially in China
   DSM Dyneema sales somewhat lower. Weak demand in Commercial marine; Life protection sales performed well

Page 13
Performance Materials | Key financials

          in € million                                               Q4 2015      Q4 2014   % Change   FY 2015   FY 2014   % Change
          Sales                                                            601       618         -3%     2,528     2,460        3%
          EBITDA                                                            90        80        13%       384       323        19%
          EBITDA margin (%)                                               15.0%     12.9%               15.2%     13.1%
          EBIT                                                              54        51         6%       250       204        23%
          Capital Employed                                                                               1,723     1,744
                         1
          ROCE (%)                                                                                      14.4%     11.9%
          Total Working Capital                                                                           225       342
                                                 2
          Total Working Capital as % of Sales                                                            9.4%     13.8%
          1) ROCE calculated based on weighted average capital employed
          2) Annualized last quarter sales

    Q4 2015 EBITDA up 13% as result of:
     – Efficiency and cost saving programs carried out over recent years
     – Good margin management and favorable currency developments

    As expected, Q4 EBITDA margin of 15% slightly below the two preceding quarters, as lower prices were partly passed
     down the value chain

Page 14
Innovation Center | Key financials

          in € million                               Q4 2015    Q4 2014    % Change   FY 2015   FY 2014   % Change
          Sales                                           40         42         -5%      155       154         1%
          EBITDA                                           -1         -3                   -9       -18
          EBIT                                            -14         -9                  -43       -45
          Capital Employed                                                               560       523

    Q4 2015 sales in line with full year:
     – Strong sales development at DSM Advanced Surfaces and positive currency effects offset by lower volumes at DSM
       Biomedical as a consequence of weak biomedical device markets driven by the health care reforms in the US

    Q4 2015 EBITDA in line with the full year and showed an improvement driven by:
     – More focused innovation activities and cost savings
     – Currencies
     – License income from bio-succinic acid technology

Page 15
Corporate Activities | Key financials

          in € million                                Q4 2015     Q4 2014              FY 2015    FY 2014
          Sales                                             21         27                   76        102
          EBITDA                                           -34        -23                 -122        -117
          EBIT                                             -48        -39                 -169        -168

    Q4 2015 EBITDA: lower than the prior year, mainly as a result of costs related to a warehouse fire at the Chemelot
     site (the Netherlands) which were partially covered by DSM’s insurance captive, resulting in a loss at Corporate
     Activities

Page 16
Key Joint Ventures and Associates | Key financials

          in € million, based on 100%                                         Q4 2015          Q4 2014      % Change        FY 2015           FY 2014   % Change
          DSM Sinochem:                    Sales                                       86             94            -9%            418           399         5%
                                           EBITDA%                                   16%             10%                          14%              6%

          Patheon1:                        Sales                                     478             383            25%         1,813            984        n.a.
                                           EBITDA%                                   24%             22%                          21%             18%

          ChemicaInvest2:                  Sales                                     514             n.a.          n.a.            879           n.a.       n.a.
                                           EBITDA%                                    -3%            n.a.                           0%           n.a.

          1) Patheon (formely reported as DPx Holding) respective periods are: for the 4th quarter from 1 August - 31 October, for YTD 2015
            from 1 Nov 2014 – 31 October 2015 and for YTD 2014 from 11 March 2014 – 31 October 2014.
          2) ChemicaInvest full year figures refer to the period from 1 August – 31 December 2015.

    DSM Sinochem Pharmaceuticals (50% DSM) delivered improved results supported by favorable currency developments
     and growth in new niche products
    Patheon (49% DSM) delivered higher results supported by organic growth and the contribution of acquisitions
    ChemicaInvest (35% DSM) results were impacted by weakness in caprolactam

Page 17
Cash flow and Working Capital development

   Cash flow                                                                         Working Capital% - At year-end
   in € million                                                  FY 2015   FY 2014   40%
     EBITDA                                                        1,170     1,166
                                                                                     30%
     Change in Working Capital                                       -12       -74
     Income Tax                                                      -75       -82   20%
     Other                                                          -387      -202
   Cash from Operating Activities                                   696       808    10%
     of which provided by Continuing Operations                     800       663
   Cash from Investing Activities       1
                                                                    -273      -529    0%
   Free Cash Flow from Operations                                   423       279
                                                                                           Total DSM   Nutrition      Materials

   1) Excl. changes in fixed-term deposits, incl. acquisitions                                         2014    2015
    Focus on Cash Flow and Total Working Capital resulted in strong Full Year Operating Cash Flow of €800 million
    Total Working Capital amounted to €1,343 million compared to €1,587 million at year-end 2014 (17.4% of annualized
     sales)
     – Total working capital year-end 2015 included cash related liabilities of joint ventures of €137 million. Excluding
        these liabilities, Total Working Capital as % of annualized sales amounted to 19.2%

Page 18
Net Debt and ROCE development

   Net debt - At year-end                                        ROCE - At year-end

   3,000                                                           20%

                                                                   15%
   2,000
                                                                   10%
   1,000
                                                                    5%

          0                                                         0%
               2013           2014           2015                          Total DSM       Nutrition      Materials
                                                                                           2014    2015
    In 2015, Net Debt decreased by €99 million compared to the end of 2014 reflecting higher free cash flow from
     operations, positively impacted by the proceeds from disposals, which was partly offset by unfavorable
     developments of derivatives
    ROCE at 7.6% was lower compared to 2014 as a result of a slightly lower EBIT and a higher Capital Employed that was
     impacted by FX partly offset by positive working capital development

Page 19
Dividend proposal to AGM: stable at € 1.65

                                                                 Dividend overview – 2010-15
   Dividend policy “stable and preferably rising”
                                                                 € 1.75
   Proposal to AGM on 29 April 2016: Maintain the dividend
    of €1.65 per ordinary share:
    – €0.55 interim dividend (paid in August 2015)
                                                                 € 1.50
    – €1.10 final dividend (payable in May 2016)

   Payable in cash or ordinary shares [at the option of the
                                                                 € 1.25
    shareholder at the condition to be specified in the notes
    of the AGM]

   Dividend in cash will be paid after deduction of 15% Dutch   € 1.00
    dividend withholding tax

   The ex-dividend date: 3 May 2016                             € 0.75
                                                                           '10   '11   '12     '13   '14   '15

Page 20
Business Conditions

   Animal Nutrition
    Continued good market conditions, with no significant pressure from animal diseases

   Human Nutrition
    Continued slow market conditions in the Americas, but own growth initiatives gradually kicking in

   Performance Materials
    Uncertain macro economic conditions are causing a continued soft volume environment
    Low input prices to remain supportive for margins in the short term, but over time margins will normalize

Page 21
Recap of Strategy 2018
Driving Profitable Growth
Strategy 2018

 Two headline        1. High single-digit   2. High double-
 financial targets   annual EBITDA          digit basis point
                     growth                 annual ROCE
                                            growth

 Clear actions       Businesses aim to      €250-300m cost       Consistent
 identified to       outpace market         reduction and        improvements in
 achieve targets     growth in all          efficiency           capital efficiency
                     segments               improvement
                                            programs       €

 Additional items    Stepping up            Global               Extract value from
 underpinning        sustainability         organizational and   Pharma & Bulk
 strategy            aspirations            operational          Chemicals ventures
                                            adjustments
                                                                                 €

Page 23
Strategy 2018 – Driving Profitable Growth
                through science-based, sustainable solutions
                                    Climate &                                IMPROVING
                                                                                                           2018 TARGETS
                                     Energy                              FINANCIAL RESULTS
           Global shifts &                                    Health &
            Digitization                                      Wellness
                                                                              Growth                    annual EBITDA growth:
                                                                                                           high single-digit

                                                                         Cost & Productivity                      ---

                                                                                                        annual ROCE growth:
                                                                              Capital
                                                                                                        high double-digit bps
                             HEALTH . NUTRITION . MATERIALS
                                                                             Efficiency
                                BRIGHT SCIENCES                                      Result-driven organization
                                                                                             & culture

    4 November 2015 DSM presented Strategy 2018: Driving Profitable Growth
     – Following a period of important transformation, DSM will focus on ensuring that the potential of the current
        business portfolio translates into improved financial results
    Two headline financial targets
     – High single-digit annual EBITDA growth & High double-digit basis point annual ROCE growth
    Shorter, three-year, strategic period to reflect current focus on performance as well as the dynamic nature of
     today’s marketplace

Page 24
Well-identified initiatives to drive Strategy 2018 targets

                                               ~€130-150m
                            ~€100-125m
                                                 Nutrition
                                                 program             Inflation        Sales above
                               Support
                              functions                                              market growth
                              & services
                               program

            2015                                                                                            2018
           EBITDA                                                                                          EBITDA

    DSM is confident it has the right business strategies in place to meet the needs of its customers and succeed in its
     markets, providing innovative and sustainable solutions
    Aim to accelerate growth and outpace market growth in all its key segments
    In addition to its growth initiatives, self-help programs will further help delivery of the Strategy 2018 targets

Page 25
Driving profitable growth supported by cost reduction and efficiency
improvement programs
    Cost savings: total €250-300m
                                             Timing of cumulative cost savings                  One-time costs
                 by 2018

                                           ~€m

                       Nutrition            400                                                              2017
                       Program                                                                              ~€50m
                                            300
                      €130-150m
       DSM-wide            (by 2018)                                                                   2016
                                            200                                                       ~€100m
        support
       functions                            100
      €125-150m                                                                                2015
                           Materials
      (by end 2017)                                                                           ~€80m
                                              0
                                                  2015    2016   2017    2018

    Cost reduction/ efficiency improvement programs target overall savings of €250-300m by 2018 (of which €25m was
     achieved in 2015)
    Enhance financial performance through consistent improvements in capital efficiency
     – Total working capital aimed to be structurally below 20%
     – Capital expenditure primarily support growth areas, with approx. two-thirds focused on Nutrition

Page 26
DSM wide savings in support functions & staff | Structural savings
of €125-150 million to be fully achieved by the end of 2017

          Breakdown by function                   Breakdown by cluster                     Aim of the program

                                                                               External benchmark identified savings
                                                                                potential
             Other                                 Corporate
                            Finance                 Activities
          functions                                               Nutrition    New organizational/operating model:
                                           Innovation                           – Strong business and market focus;
Purchasing
                                               Center                           – All support functions globally leveraged;
                                                                                – Elimination of duplications, delayering
                                      HR                                          and demand reduction;
                                                                                – One shared services organization and
                                                                                  increased outsourcing;

                                                                               900-1,100 FTE involved
                                               Materials
 Communcations
                      ICT                                                      Effectiveness of R&D-spend under review

Page 27
Nutrition improvement program
Cost savings & efficiency improvements in Nutrition €130-150m by 2018
                        Breakdown by category                                     Aim of the program

                                                                      Purchasing savings related to direct raw
                                                Purchasing
     Efficiency gains                                                  materials sourcing, energy, intermediates
                                                “Lowering the
         Yield                                                        and indirect spend
                                                cost of our direct
         Energy                                raw materials”
     “Making the                                                      Fixed costs reduction, including
     same with less                                                    ~100 FTE
     inputs”
                                                                      Efficiency gains related to increase uptime,
                                                  Fixed cost           yields and throughput to enable
                                                  reduction            accelerated growth

                 Throughput gain in sold-out units
          “Getting more volume out of the same equipment”

Page 28
Drive growth in Nutrition
Global products and local solutions
                Capitalizing on every step in the value chain         Aspirations 2018 underpinning Group targets

           Global leader in nutrition, with broadest portfolio of    Annual EBITDA growth:
            specialty nutritional ingredients                          high single-digit

           Unparalleled local network                                Annual ROCE growth:
                                                                       high double-digit bps
           Uniquely positioned in all steps of the value chain
                                                                      EBITDA margins:
                                                                       18-20% over the period

                                                                      Above-market sales growth
                                                                       (at stable prices)

Page 29
Nutrition has a unique, global and broad portfolio in food/feed nutritional
ingredients with increased solutions offering capabilities
                               Broad portfolio providing resilience

                       Fat soluble vitamins (e.g. A,D,E)
                       Water soluble vitamins (e.g. B,C)
                       Carotenoids                                    Active ingredients
                       Marine PUFAs
                       Microbial PUFAs                                Forms
                       Enzymes & Cultures
                       Minerals & DCP
                                                                      Premixes
                       Savory / yeast extracts
                       Nutraceutical ingredients
                                                                      i-Health/B2C
                       Aroma intermediates
                       Other blend ingredients
                       Other

Page 30
Growth 2016-2018 in Animal Nutrition | Continued outperformance

                         Animal Nutrition               Key actions driving profitable growth

                                               Double-digit growth from feed enzymes and eubiotics
                                                solutions, tailored to local conditions / requirements
                     ~3-4%1
                                               Growth in underpenetrated species (aqua, pet, dairy)

                                               Leverage Tortuga in Latin America beyond Brazil

                                               Further expansion of global premix network

                     Market             DSM
                              2016-18

          1 CAGR %

Page 31
Animal Nutrition has a complete portfolio of targeted feed ingredients and
has further growth opportunities beyond the historical core area of poultry

         Animal Nutrition market by product (excl. premix)                               Animal Nutrition application landscape1

  (x) = Growth rate 2016-18 (CAGR, %)

                                        Carotenoids
                                          (2-3%)                      DSM market
                                                                     share = ~30%                           Aqua
                                                      Vitamins
                                                       (2-3%)
                                                                                                      Pet

                                                                                                                             Poultry
                          Amino Acids
                                           Total
                                                           Enzymes
                                                                            Forward
                                         potential
                            (4-6%)
                                         market:            (4-6%)          Solutions
                                          €10bn                                               Swine
                                                            Eubiotics
                                                             (5-6%)
                                                  Minerals &
                                                   Chelates
                                                    (4-5%)
                                                                                                               Ruminants 1

1 Landscape includes Carotenoids, Vitamins, Enzymes, Eubiotics and Minerals / Chelates

 Page 32
Growth 2016-2018 in Human Nutrition | Step-up to above market growth

                         Human Nutrition                Key actions driving profitable growth

                                               Repair growth in North-America, returning Dietary
                                                Supplements (Vitamins, Omega-3) and F&B to growth

                                               Continued double-digit growth of i-Health business
                      ~3%1                     Accelerating forward solutions and premix globally

                                               Capture business in Pharma, Clinical, and Sports
                                                Nutrition

                     Market             DSM    Upgraded organization, new tools, rigorous execution

                              2016-18

          1 CAGR %

Page 33
Human Nutrition is leading in nutritional ingredients and has
ample opportunities to further expand in a diversified application landscape
    Specialty Food Ingredients market and growth by product                                                      Diversified application landscape2

  (x) = Growth rate 2016-18 (CAGR, %)
                                 Color Preservation                 DSM market                                         Fortified
                                 (5%)      (2%)                    share = ~20%                                          Dairy
                                                                                                                                    NIP 3
                                                    Processing
                                                       Aids                                                           Fortified
                                                       (3%)                                                             Food
                          Texture
                           (4%)                                                                                                                  Dietary
                                          Total                                                                                                Supplements
                                                                                                                    Fortified
                                        potential        Nutritional       Forward                                 Beverages
                                        market:          Ingredients
                                         €33bn1             (3-4%)         Solutions
                                                                                                       Medical
                                Taste                                                                  Nutrition
                                                                                                                      Early Life
                                 (4%)

                                                                                                                                            Pharma
                                                                                                                               Sport
                                                                                                                              Nutrition
1 Total specialty food ingredients market, excluding ~€20bn of commodity ingredients, e.g., soy proteins
2 Breakdown of targeted markets, excluding Food Specialties Food & Beverages sales (mainly bio ingredients)
3 Nutritional Improvement Programs includes sales through governmental / NGO supply programs. Excludes BOP (bottom of the pyramid) sales through traditional
  retail channels

Page 34
Growth 2016-2018 in Food Specialties | All segments strongly contributing
to growth aspirations of Nutrition

                               Food Specialties                                                                     Market Growth   DSM Growth
                                                                                                                      2016-2018      2016-2018

                                                                                                    Savory              3-4%           3-4%
                          ~5%1

                                                                                                    Cultures &
                                                                                                                        5-6%           6-7%
                                                                                                    Enzymes

                                                                                                    Hydrocolloids       3-4%           7-8%
                        Market                        DSM
                                    2016-18
                                                                                                    Sweetener2
                                                                                                                        >10%
                                                                                                    platform

          1 CAGR %
          2 Growth of market for non-artificial high-intensity sweeteners (which includes Stevia)

Page 35
Materials end market segments offer growth options enhanced by
substitution based on application development capabilities

                                                                       Personal             Com. Marine      High Perf.       Sustainable
             Automotive                  Electronics
                                                                      Protection              & Sport         Textiles      Coatings (B&C)2

       Replace metals & hazardous materials                                      Replace steel/aluminum & aramids         Replace solvent-based

                                  Growth via end markets and substitution based on application development

                    Engineering Plastics1                                                    Dyneema                        Coating Resins

1 Food packaging is the 3rd application area for Engineering Plastics
2 The Building and Construction (B&C) Industry is the main area of application for Resins

Page 36
Differentiated approach has led to a more attractive Materials portfolio,
with a higher growth and returns profile

      High                                          Accelerated
                                                                          Functional
                                                    growth                Materials
                                                                                                               Aspirations 2018 underpinning
                                                              High-Performance                                         Group targets
                                Growth         PA6                      Plastics          Solar
                                               Compounds
                                                                                         Biomedical             Annual EBITDA growth:
                                                                                                                 high single-digit
                            Maximize                      Specialty Coating
          Market growth

                                         PA6                                                  Dyneema® Fiber
                            returns                       Resins                              Solutions         Annual ROCE growth:
                                         Polymers
                                                                                                                 high double-digit bps
                                                               Powder
                                                               Coating Resins                                   EBITDA margins:
                                                                                    Dyneema® Life                >15% over the period
                                                                                    Protection
                                                                                                                Above-market sales growth
                                                                                                                 (at stable prices)

                                            - Engineering Plastics   - Resins & Functional Materials
                                            - Dyneema                - Emerging Business Areas

                          Low            DSM’s capability to extract value                High

Page 37
Materials expects to grow sales above market growth1

                    Materials1                             Key actions driving profitable growth

                                       Engineering Plastics
                                        Highly specified application development for global customers in High
                                         Performance Plastics’ ‘winning’ segments
                                        Continue to grow by leveraging global presence and footprint in PA6
                                         Compounds
           ~3-4%1
                                       Dyneema
                                        Development of new application segments and product solutions in
                                         existing segments for Fiber Solutions
                                        Continue re-focus on growing Personal Protection segment

           Market                DSM   Resins & Functional Materials
                                        Grow customer base facilitating Fiber-to-Home trend
                    2016-18             Drive substitution from solvent to water and other sustainable solutions in
                                         Coatings

1 CAGR %

Page 38
Innovation Center supports innovation in core businesses and develops new
Emerging Business Areas
                           Innovation Center                              Aspirations underpinning Group targets

                       Core Business Support and Growth                Support innovation in core businesses to
                                                                        facilitate earnings growth beyond 2018
           Center of              Venturing               Incubator
          Excellence                                                   Develop and extract value from Emerging
                                                                        Business Areas

                                                                       Cost of Innovation Support:
                                                                        - €15-20m EBITDA/year

                           Emerging Business Areas                     EBITDA contribution of the Emerging Business
                                                                        Areas:
                                                                        from +€5m (2015) to +€30-40m 2018)

                                                                       Overall Innovation Center
          Biomedical             Bio-based                Advanced      EBITDA break-even in 2016
                                 Products &               Surfaces
                                  Services

Page 39
DSM expects to extract significant value from its partnerships in the coming
years                                                                   - DSM share

                             50%                                  49%                              35%

 DSM Sinochem Pharmaceuticals      Patheon Pharma                       ChemicaInvest
 Antibiotics                       Contract Manufacturing               Bulk Chemicals

   €m at 100%      FY 2015          €m at 100%         FY 2015           €m at 100%      FY 2015

   Sales             429            Sales               1,814            Sales
   EBITDA%           13%            EBITDA%                 21%          EBITDA%

Page 40
DSM is stepping up its sustainability aspirations
Global sustainability agenda linked to DSM businesses / competences
    Sustainability aspirations               2010           20151          2020                        Malnutrition                           Climate Change & Energy
    Dow Jones Sustainability                 Gold           Gold            Gold
    Index                                    Class          Class           Class          Addressing Deficiencies                       Circular Economy & Bio-
                                                                                            (North/West), e.g.                             based renewables, e.g.
    Brighter Living Solutions
    Eco+                                      39%            57%             ---
                                                                                            Vitamin D                                      bioplastics/fuels & Niaga
    Eco+/People+                               ---           60%            65%
    GHG efficiency                                                          45%
                                               ---           20%
    improvements2                                                          (2025)          Addressing Hunger (South                      Climate Change & New
                                                                                            & East), e.g. MixMe                            Energies, e.g. light-weight
    Employee engagement3                      70%            70%           ->75%
                                                                                                                                           materials, solar coatings &
    Safety (Frequency Index                                                                                                                biofuels
                                             0.57            0.47           0.25
    Recordables)

                                                         Sustainability as a business driver:
                                                            Driving Sustainable Markets
1 Estimated 2015 figures (Employee Engagement in 2014 was 69%)
2 Compared to 2008; supported by Energy Efficiencies (> 1% annually) and Renewable Electricity (50% in 2025)
3 Striving to reach High Performance Norm; in addition we strive to improve our (executives) Diversity Mix in (underrepresented) Nationalities (from 39% in
  2010, to 50% in 2015 to 60% in 2020) and Gender (female executives from 9% in 2010, to 15% in 2015 to 5% in 2020)

Page 41
Wrap up Strategy 2018

           Committed to                         Committed to
           Drive Shareholder Value              Maintain a strong balance sheet

           Above market growth                 Extract value from Joint Ventures

           Cost reductions and efficiencies    Improve operating cash flows

           High single-digit EBITDA growth     Capital efficiency

Page 42
DSM’s IR App @your service
Download the mobile app at Apple’s App store and Google Play

DSM Investor Relations released its Investor Relations App for iPhone, iPad and Android mobile
devices. The App is available for free at Apple’s App Store for the iPhone and iPad and at Google
Play for Android mobile devices.

 iPad / Tablet                                     iPhone /Mobile             Download here >
You can also read