Half-year results 2020/21 - (1 July - 31 December 2020) Riet Cadonau, Chairman & CEO Bernd Brinker, CFO
←
→
Page content transcription
If your browser does not render page correctly, please read the page content below
Riet Cadonau, Chairman & CEO
                              Bernd Brinker, CFO

                              Zurich/Switzerland, 3 March 2021

Half-year results 2020/21
(1 July – 31 December 2020)
Disclaimer
This communication contains certain forward-looking statements including, but not limited to, those using the words “believes”, “assumes”, “expects” or formulations of a similar kind.
Such forward-looking statements are made on the basis of assumptions and expectations that the company believes to be reasonable at this time, but may prove to be erroneous.
Undue reliance should not be placed on such statements because, by their nature, they are subject to known and unknown risks, uncertainties and other factors which could lead to
substantial differences between the actual future results, the financial situation, the development or performance of the company or the Group and those either expressed or implied
by such statements. Such factors include, but are not limited to:

the general economic conditions / impacts of the Covid-19 pandemic / competition from other companies / the effects and risks of new technologies / the company’s continuing capital
requirements / financing costs / delays in the integration of mergers or acquisitions / changes in the operating expenses / currency and raw material price fluctuations / the company’s
ability to recruit and retain qualified employees / political risks in countries where the company operates / changes in applicable law / and other factors identified in this
communication.

Should one or more of these risks, uncertainties or other factors materialize, or should any underlying assumption or expectation prove incorrect, actual outcomes may vary
substantially from those indicated. In view of these risks, uncertainties or other factors, readers are cautioned not to place undue reliance on such forward-looking statements. Except
as required by applicable law or regulation, the company accepts no obligation to continue to report or update such forward-looking statements or adjust them to future events or
developments. It should be noted that past performance is not a guide to future performance. Please also note that interim results are not necessarily indicative of the full-year results.
Persons requiring advice should consult an independent adviser.

For definition of alternative performance measures, please refer to the chapter "Notes to the consolidated financial statements" of the Half-year Report 2020/21 of dormakaba.

This communication does not constitute an offer or an invitation for the sale or purchase of securities in any jurisdiction.

dormakaba®, dorma+kaba®, Kaba®, Dorma®, Ilco®, LEGIC®, Silca®, BEST®, etc. are registered trademarks of the dormakaba Group. Due to country-specific constraints or marketing
considerations, some of the dormakaba Group products and systems may not be available in every market.
dormakaba Holding AG
Hofwisenstrasse 24
8153 Rümlang
Switzerland
www.dormakaba.com
Agenda

Half-year results 2020/21 at a glance                Slide 4
Riet Cadonau

Sustainable investments                              Slide 11
Riet Cadonau

Financial results and outlook                        Slide 15
Bernd Brinker

3        Presentation on half-year results 2020/21              03 March 2021
Half-year results 2020/21 at a glance

Significant improvement over previous half-year and strong cash flow

• Sales of CHF 1,227.5 million (previous year CHF 1,385.7 million)

• Impact from currency translation -5.5% and from M&A +0.1%

• Organic sales -6.0% (previous year 0.8%; HY2 2019/20: -14.3%)

• EBITDA at CHF 181.9 million (previous year CHF 214.1 million; HY2 2019/20: CHF 110.9 million)

• EBITDA margin 14.8% (previous year 15.5%; HY2 2019/20: 9.6%)

• Net profit at CHF 99.9 million (previous year CHF 119.4 million; HY2 2019/20: CHF 44.7 million)

• Net cash from operating activities CHF 194.3 million, operating cash flow margin 15.8%
    (previous year CHF 139.1 million, 10.0%)

4              Presentation on half-year results 2020/21                         03 March 2021
Half-year results 2020/21 at a glance

AS AMER: Organic sales and profitability below previous year

    CHF million                            HY 2020/21          HY 2019/20   Variance   •   Sequential improvement; performance in North and Latin America
    Total segment sales                         339.7               416.3    -18.4%        still negatively impacted by the pandemic
    Third-party sales                                 326.8         399.7    -18.2%    •   Continued strong performance of Alvarado (acquired in July 2019)
    EBITDA                                              58.5         87.2    -32.9%
                                                    17.2%          20.9%               •   The hollow metal door business (Mesker) improved sequentially,
    EBITDA margin                                                            -3.7ppt
    Organic sales growth                           -10.8%          +1.4%                   as the business steadily but slowly regained customer trust

                                                                                       •   Electronic Access & Data with organic growth; all other Product
                                                                                           Clusters declined, particular weakness in Lodging Systems

                                                                                       •   Alex Housten assumed responsibility as COO AS AMER as of
                                                                                           1 July 2020: business started to implement growth initiatives

5                 Presentation on half-year results 2020/21                                                             03 March 2021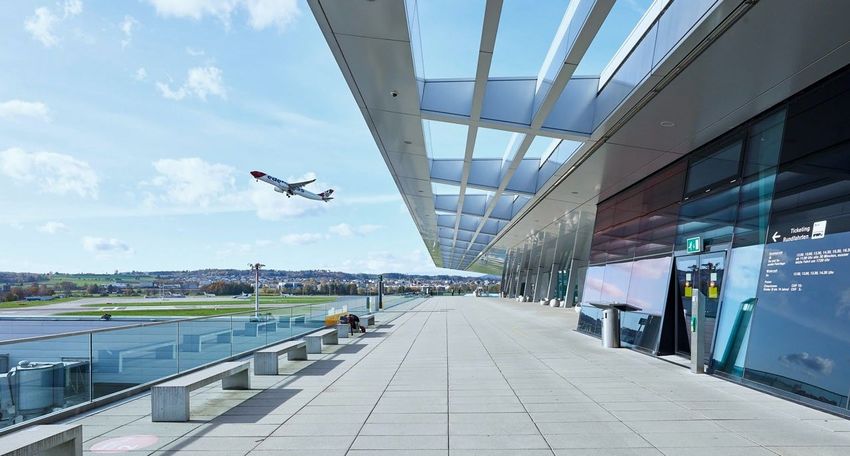
Half-year results 2020/21 at a glance

AS APAC: Lower sales, but EBITDA margin close to previous year's level

    CHF million                            HY 2020/21          HY 2019/20   Variance   •   Sales improved sequentially in HY1 2020/21, most regions still
    Total segment sales                         195.0               230.5    -15.4%        impacted by the pandemic
    Third-party sales                                 184.0         217.2    -15.3%    •   China: Sales sequentially increasing but impacted by project
    EBITDA                                              28.5         35.1    -18.8%        delays in the commercial sector; Wah Yuet with strong growth
    EBITDA margin                                   14.6%          15.2%     -0.6ppt
    Organic sales growth                           -10.5%           -0.3%              •   Pacific region: Organic growth impacted by regional
                                                                                           lockdowns, partly compensated by growth in the Kilargo
                                                                                           business (acquired in July 2017)

                                                                                       •   South East Asia and India: still impacted by the pandemic

                                                                                       •   Major markets like China and India are expected to return to
                                                                                           organic growth driven by improved order intake, e.g. for
                                                                                           touchless entrance solutions in China, and a good backlog of
                                                                                           orders in general

6                 Presentation on half-year results 2020/21                                                             03 March 2021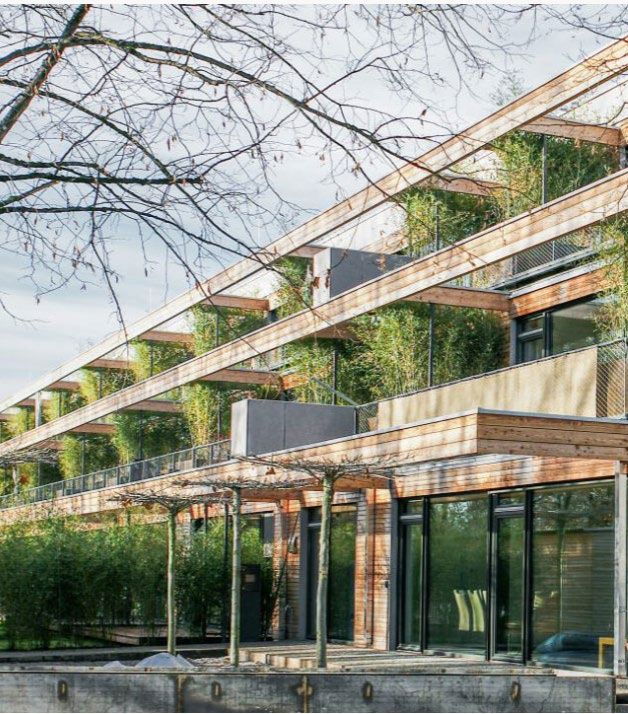
Half-year results 2020/21 at a glance

AS DACH: Organic sales growth in third party sales in all regional markets and
improved EBITDA margin, lower intercompany sales
    CHF million                            HY 2020/21          HY 2019/20   Variance   •   Organic third-party sales in Germany, Switzerland and Austria in
    Total segment sales                         396.2               415.6     -4.7%        HY1 2020/21 in total more than 6% above previous year
    Third-party sales                                 265.5         252.7      5.1%    •   Segment negatively impacted by lower global demand, resulting
    EBITDA                                              67.5         70.3     -4.0%        in lower intercompany sales
    EBITDA margin                                   17.0%          16.9%      0.1ppt
    Organic sales growth                             -2.9%         +0.7%               •   Continued focus on innovative products like new sliding door
                                                                                           operator ES PROLINE and successful introduction of new self-
                                                                                           boarding gate dormakaba ARGUS AIR. The latter has been
                                                                                           successfully tested with Lufthansa at Frankfurt Airport in
                                                                                           Germany

                                                                                       •   AS DACH will continue to explore growth opportunities in Multi-
                                                                                           Housing. An example: A cooperation for 1000 micro apartments
                                                                                           in Switzerland (“City Pop” apartments) including a platform for
                                                                                           mobile access integrating dormakaba’s exivo platform (a cloud-
                                                                                           based solution)

7                 Presentation on half-year results 2020/21                                                              03 March 2021
Half-year results 2020/21 at a glance

AS EMEA: Lower sales, but higher EBITDA and EBITDA margin

    CHF million                            HY 2020/21          HY 2019/20   Variance   •   Norway with organic growth and improved profitability following
    Total segment sales                         342.9               374.5     -8.4%        the divestment of the project installation business (1 September
    Third-party sales                                 283.3         317.6    -10.8%        2020). Denmark and the Netherlands continued to deliver
    EBITDA                                              32.1         30.4      5.6%        organic growth
    EBITDA margin                                     9.4%          8.1%      1.3ppt   •   Most other countries still suffered from the pandemic, but
    Organic sales growth                             -3.0%         +1.4%                   narrowed gap versus previous year sequentially

                                                                                       •   Sales benefited from a recovery of the Services business and
                                                                                           several airport projects, e.g. in the Netherlands (Schiphol,
                                                                                           Amsterdam) and Italy (Fiumicino, Rome)

                                                                                       •   Solid project pipeline going forward

8                 Presentation on half-year results 2020/21                                                              03 March 2021
Half-year results 2020/21 at a glance

Key & Wall Solutions: Lower sales, but EBITDA margin above previous year's level
                                                                                       Business Unit Key Systems:

    CHF million                            HY 2020/21          HY 2019/20   Variance   •   Sales improved sequentially but are still below previous year's level
    Total segment sales                         169.1               198.9    -15.0%        due to regional lockdowns
    Third-party sales                                 162.0         191.5    -15.4%
                                                                                       •   The business has gained several major contracts, e.g. two
    EBITDA                                              26.6         29.8    -10.7%
                                                                                           customized product solutions for key cutting machines supplying
    EBITDA margin                                   15.7%          15.0%      0.7ppt
                                                                                           approx. 500 US-dealers of a major Japanese car manufacturer
    Organic sales growth                             -9.2%         +2.8%
                                                                                       Business Unit Movable Walls:

                                                                                       •   Sales were impacted by delays in the finalization of existing projects,
                                                                                           postponed construction projects and regional lockdowns

                                                                                       •   The business has gained several major projects like the “The Circle”
                                                                                           convention center at Zurich Airport and the expansion of the Las
                                                                                           Vegas Convention Center

9                 Presentation on half-year results 2020/21                                                              03 March 2021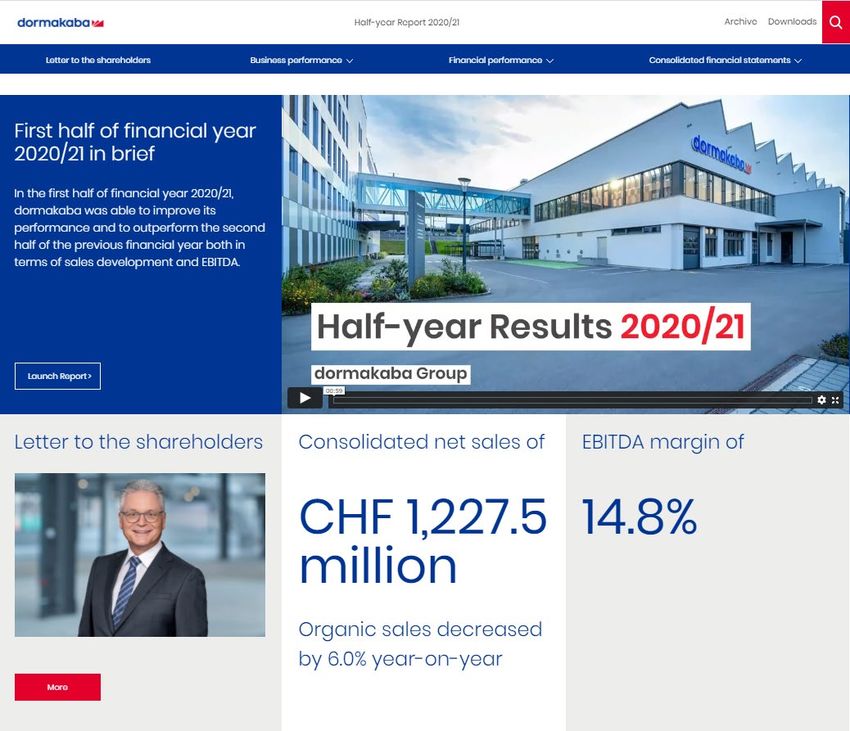
Agenda

Half-year results 2020/21 at a glance                Slide 4
Riet Cadonau

Sustainable investments                              Slide 11
Riet Cadonau

Financial results and outlook                        Slide 15
Bernd Brinker

10       Presentation on half-year results 2020/21              03 March 2021
Sustainable investments

    Digital services offering: Supporting customers to manage regulatory challenges
    due to the Covid pandemic – Entrivo
•        Cloud-based solution enabling customers to monitor
         occupancy compliance, door traffic and current
         occupancy in real-time and over-time from anywhere

•        Connected doors with sensors work as an eco-system to
         count traffic flow and calculate the overall occupancy

•        Subscription model, offer includes installation, digital
         services and hardware bundles for any door (door
         closers, automatic doors etc.)

•        “Software-as-a-service” solution as complement offering
         to our core portfolio

    11             Presentation on half-year results 2020/21        03 March 2021
Sustainable investments
Digital solutions: Offering increased efficiency and cost savings for the multi-
housing market with dormakaba Resivo
Cost savings for administrators through
central access management online
Increased efficiency through easier handover
of keys
Pilot installation Munich
Time savings by creating and assigning
additional keys online
12 Presentation on half-year results 2020/21 03 March 2021Sustainable investments
State-of-the-art engineering supporting green buildings: next generation,
energy-efficient door drive system ES Proline ST Green
Twofold advantage: Operate larger dimensioned
doors with higher thermal insulation and security
degrees using less energy, contributing to
reduction of carbon emissions
Modular and flexible
Sustainable and energy-efficient
Design-orientated technology
13 Presentation on half-year results 2020/21 03 March 2021Agenda Half-year results 2020/21 at a glance Slide 4 Riet Cadonau Sustainable investments Slide 11 Riet Cadonau Financial results and outlook Slide 15 Bernd Brinker 14 Presentation on half-year results 2020/21 03 March 2021
Financial results and outlook

Key figures

• Organic sales growth of -6.0% (previous year: HY1
                                                           CHF million (except where indicated)   HY 2020/21       HY 2019/20   Variance
  2019/20: 0.8%; HY2 2019/20: -14.3%)
• Significant negative currency translation impact on      Net sales                                   1,227.5        1,385.7    -11.4%
  net sales of 5.5% due to stronger CHF against all        - thereof: organic sales growth               -6.0%          0.8%
  major currencies
                                                           - thereof: acquisition sales growth            0.1%          0.5%
• Small net positive M&A impact on net sales of 0.1%
• EBITDA of CHF 181.9 million, lower due to Covid-19       - thereof: currency effect on sales           -5.5%          -2.1%
  related lower volume (previous year: HY1 2019/20:                                                      181.9          214.1    -15.0%
                                                           EBITDA
  CHF 214.1 million; HY2 2019/20: CHF 110.9 million)
                                                           EBITDA margin                                14.8%          15.5%     -0.7 ppt
• Profit before tax declined to CHF 129.8 million due
  to lower operational performance (HY1 2019/20:           Profit before taxes                           129.8          157.1    -17.4%
  CHF 157.1 million; HY2 2019/20: CHF 54.1 million)
                                                           Net profit                                      99.9         119.4    -16.3%
• Net profit declined by 16.3% to CHF 99.9 million
  (HY1 2019/20: CHF 119.4 million; HY2 2019/20:            Net profit after minorities                     52.3          61.3    -14.7%
  CHF 44.7 million)

15             Presentation on half-year results 2020/21                                           03 March 2021
Financial results and outlook
Sales development 1,385.7
• Negative impact on net sales from currency translation (-5.5%) due to stronger
1,309.5
CHF against all major currencies
-76.2
• Organic growth of -6.0%, strongest performance by AS DACH (-2.9%) and
AS EMEA (-3.0%)
1.0 1,227.5
• As a result, increased weight of European sales contribution
-83.0
• Organic growth better than in HY2 2019/20, which was -14.3%
• M&A net impact insignificant, reflecting the current pandemic related priorities;
includes divestment of project installation business in Norway
HY 2019/20 Currency Currency Organic M&A HY 2020/21
translation adjusted
Third-party sales contribution and organic sales growth by segment
FX development against CHF (average rate)
Third-party sales contribution Organic sales growth
Segments HY 2020/21 HY 2019/20 HY 2020/21 HY 2019/20 Dec 2020 Dec 2019 Change
AS AMER 26.6% 28.9% -10.8% 1.4% EUR 1.0765 1.0961 -1.8%
AS APAC 15.0% 15.7% -10.5% -0.3% USD 0.9118 0.9880 -7.7%
AS DACH 21.6% 18.2% -2.9% 0.7% CAD 0.6921 0.7482 -7.5%
AS EMEA 23.1% 22.9% -3.0% 1.4% AUD 0.6592 0.6761 -2.5%
AS total 86.3% 85.7% -5.4% 0.6% GBP 1.1910 1.2440 -4.3%
Key & Wall Solutions 13.2% 13.8% -9.2% 2.8% CNY 0.1347 0.1405 -4.1%
Others 0.5% 0.5% -10.8% 8.9% HKD 0.1177 0.1262 -6.7%
Total 100.0% 100.0% -6.0% 0.8% INR 0.0123 0.0140 -12.1%
16 Presentation on half-year results 2020/21 03 March 2021Financial results and outlook
EBITDA development 214.1
• EBITDA performance driven by Covid-19 related lower volume 200.9
• EBITDA decreased by CHF 32.2 million (-15.0%) to CHF 181.9 million; -13.2
this compares with CHF 110.9 million in HY2 2019/20
• Positive non-recurring one-offs in the reporting period of CHF 6.6 million 1.6 181.9
(+0.5 ppt EBITDA margin)
-20.6
• EBITDA margin declined to 14.8% (PY: 15.5%); this compares with 9.6%
in HY2 2019/20
• Strong performance by AS DACH, AS EMEA and KWS, which improved
EBITDA margin even against PY period
HY 2019/20 Currency Currency Organic M&A HY 2020/21
• As a result, increased weight of European EBITDA contribution translation adjusted
EBITDA contribution and EBITDA margin development by segment
EBITDA contribution EBITDA margin development
Segments HY 2020/21 HY 2019/20 HY 2020/21 HY 2019/20
AS AMER 27.4% 34.5% 17.2% 20.9%
AS APAC 13.4% 13.9% 14.6% 15.2%
AS DACH 31.6% 27.8% 17.0% 16.9%
AS EMEA 15.1% 12.0% 9.4% 8.1%
AS total 87.5% 88.2% 17.6% 18.6%
Key & Wall Solutions 12.5% 11.8% 15.7% 15.0%
Total 100.0% 100.0% 14.8% 15.5%
17 Presentation on half-year results 2020/21 03 March 2021Financial results and outlook
Income statement (condensed)
• Net sales of CHF 1,227.5 million, which compares CHF million HY 2020/21 % HY 2019/20 % Variance in %
with CHF 1,154.1 million in HY2 2019/20 Net sales 1,227.5 100.0 1,385.7 100.0 -11.4
• Gross margin slightly weaker, mainly due to lower
Gross margin 511.9 41.7 589.0 42.5 -13.1
demand
Other operating income, net 10.7 0.8 5.0 0.4 114.0
• Lower S&M as well as lower G&A as a result of
successful cost savings and restructuring activities Sales and marketing -198.1 -16.1 -224.3 -16.2 -11.7
to protect profitability General administration -128.1 -10.4 -140.3 -10.1 -8.7
• Slightly higher R&D spending, leading to a higher
Research and development -52.2 -4.3 -51.3 -3.7 1.8
R&D ratio (4.3% of sales); capitalized projects:
CHF 4.0 million (PY: CHF 4.3 million), adjusted EBIT 144.2 11.7 178.1 12.9 -19.0
R&D ratio 4.6% (PY: 4.0%) Financial result, net -14.4 -1.1 -21.0 -1.6 -31.4
• Improved net financial expenses due to lower Profit before taxes 129.8 10.6 157.1 11.3 -17.4
gross debt (average) and more favorable interest
environment Income taxes -29.9 -2.5 -37.7 -2.7 -20.7
• Improved income tax rate of 23.0% (PY: 24.0%) Net profit 99.9 8.1 119.4 8.6 -16.3
due to country profit mix as well as several smaller
positive one-time impacts
• Decline of net profit by CHF 19.5 million (-16.3%)
to CHF 99.9 million; this compares with CHF 44.7
million in HY2 2019/20
18 Presentation on half-year results 2020/21 03 March 2021Financial results and outlook
Cash flow
• Strong cash flow as a result of crisis related “cash is king” CHF million HY 2020/21 HY 2019/20
principles Cash generated from operations 233.6 192.1
• Much higher cash generated from operations and net cash Net cash from operating activities 194.3 139.1
from operating activities, driven by improved working capital
management in all areas Net cash used in investing activities -41.0 -191.8
• As a result, operating cash flow margin improved significantly - thereof: capital expenditure -30.8 -50.2
vs. PY from 10.0% to 15.8% - thereof: acquisition and divestment related -7.5 -141.4
• Pandemic-related reduction of capital expenditures and Free cash flow 153.3 -52.7
de-prioritization of M&A
Operating cash flow margin1) 15.8% 10.0%
• Significant free cash flow available to reduce net debt
Free cash flow before acquisitions/
160.8 88.7
divestments
1) Net cash from operating activities / net sales
19 Presentation on half-year results 2020/21 03 March 2021Financial results and outlook
Net debt
HY ended FY ended HY ended
• Significantly lower net debt by CHF 279.8 million against end CHF million
31.12.2020 30.06.2020 31.12.2019
of PY period and by CHF 111.4 million against end of prior FY
Cash and cash equivalents -138.0 -156.8 -100.2
as a result of strong operating cash flow
Short-term bank loans and
• Current leverage (net debt/EBITDA) at 1.5x, which represents 9.4 139.0 248.8
overdrafts
a solid financial profile; comfortable long-term with leverage Bonds – short- and long-term 680.3 680.4 680.4
of up to 2.5x (short term even higher), however focus on
deleveraging in the current crisis environment Other liabilities 4.6 5.1 7.1
• Update: refinancing of main credit facility Net debt 556.3 667.7 836.1
o In November 2020, the main credit facility (CHF 500 Net debt / EBITDA (leverage) 1.5x* 2.1x 2.0x*
million, due date March 2021) was renewed with a new
five-year syndicated credit facility in the amount of CHF * Calculation: Net debt / (half-year EBITDA x2)
525 million
o Includes options for a prolongation of two additional years
and for an increase of up to CHF 200 million
o Includes incentives for the achievement of ambitious
sustainability performance objectives
20 Presentation on half-year results 2020/21 03 March 2021Financial results and outlook
Cost savings and restructuring program (update)
Covid-19 pandemic impact Measures Financial impact
Covid-19 pandemic led to an Early initiation of a Group-wide cost Program will generate a
unprecedented slump in business savings and restructuring program positive financial impact
activity from February 2020
• Both supply and demand heavily impacted • Pandemic counter measures beyond “cash • Costs of the program initially expected to
• Government-mandated lockdowns and many is king” to maintain operational and financial amount to CHF 26 million
local restrictions limiting production and/or stability • Thereof CHF 12 million already expensed in
execution of orders • Program started in Q4 of FY 2019/20 FY 2019/20, in HY1 2020/21 no additional
• Substantial negative impact on dormakaba • De-prioritization of M&A (continuation of expenses (net)
business; even normally very stable pipeline management) • Limited additional capex required to execute
businesses such as Services affected • Adjustment of internal capacities and costs the entire program
• Initial target: overall headcount reduction of • All costs charged on Group level
around 1,300 (main reductions in Asia and • Program accretive to EBITDA in
the Americas); 1,100 realized at the end of HY1 2020/21 (dilution in FY 2019/20)
HY1 2020/21
21 Presentation on half-year results 2020/21 03 March 2021Financial results and outlook
Guidance and business outlook for financial year 2020/21
Market The current business environment is still characterized by uncertainties and lack of visibility due
Environment to the Covid-19 pandemic.
The Group-wide cost savings and restructuring program launched in the previous financial year
will be consistently completed and is intended to protect profitability.
Outlook From today’s perspective the company expects positive organic sales growth for the second half
of financial year 2020/21, resulting in flat year-on-year organic sales growth for the financial year
2020/21 overall. The full year EBITDA margin will likely be somewhat lower than the one for the
first half of the financial year 2020/21.
22 Presentation on half-year results 2020/21 03 March 2021Q&A 23 Presentation on half-year results 2020/21 03 March 2021
Half-year results 2020/21 presentation

Handing over the baton as CEO to Sabrina Soussan on 1 April 2021

                                      Technology leap from electronic to                             Strategically important
                                           cloud-based solutions               Sales x 2.5 within        acquisitions in
                                                                                   5 years               North America
                                                          Stable, continuous
                                  Formed a global         dividend payments
                                   one-stop shop
                                       from an
                                    international         Gained scale and                          Improved EBITDA margin
                                    niche player            critical mass      Robust navigation       from 13.5% to 16%
                                                                                  through the             (pre-Covid-19)
                                                                               Covid-19 pandemic
                                    Established “one dormakaba” culture

24            Presentation on half-year results 2020/21                                                          03 March 2021
Thank you for your attention. 25 Presentation on half-year results 2020/21 03 March 2021
If you want to find out more, visit us on our websites and channels

Half-year Report 2020/21
     Read more about results of the first half of financial year 2020/21 of
     dormakaba Group on report.dormakaba.com/hyr_2020_21

dormakaba Newsroom
     Find the latest news about dormakaba in our newsroom on
     newsroom.dormakaba.com

dormakaba blog
     Latest insights and inspirations from the world of access in our blog
     on blog.dormakaba.com

26         Presentation on half-year results 2020/21                          03 March 2021
Appendix dormakaba in a nutshell: who we are and what we offer Segment split – Key & Wall Solutions Currency exposure Shareholder structure “Cash is king” update 27 Presentation on half-year results 2020/21 03 March 2021
Who we are

One of the Top 3 companies in our
industry. Globally leading in smart
and secure access solutions

                                > 150                    > 130                     ~ 15,000
                                 years of experience     countries                 employees

                                Stock-listed             CHF 2.5 billion           Sustainable
                                 SIX Swiss Exchange      net sales in FY 2019/20   entrepreneurship
                                 (DOKA)

28           Presentation on half-year results 2020/21                                 03 March 2021
What we offer
Delivering comprehensive
access solutions and services
worldwide
Broad product & Global sales and Awarded
solutions portfolio services presence product design
Expertise at every
Preferred brands, Iconic references
phase of building
trusted for generations around the globe
lifecycle
29 Presentation on half-year results 2020/21 03 March 2021Our industry
Growth drivers shaping
our industry
Increasing prosperity Demographic
Urbanization
in emerging markets change
Increasing need
Technology Sustainability
for security
30 Presentation on half-year results 2020/21 03 March 2021Appendix
Segment split – Key & Wall Solutions
Business Units Key Systems Movable Walls
Change on Change on
CHF million HY 2020/21 % HY 2019/20 % previous year HY 2020/21 % HY 2019/20 % previous year
in % in %
Net sales third parties 93.0 105.5 -11.8% 69.0 86.0 -19.8%
Intercompany sales 1.6 2.2 5.5 5.2
Total Business Unit sales 94.6 107.7 -12.1% 74.5 91.2 -18.3%
Change in business unit sales -13.1 -12.1 -8.1 -7.1 -16.7 -18.3 9.7 12.0
Of which translation exchange differences -6.4 -5.8 -2.4 -2.1 -5.1 -5.6 -1.5 -1.8
Of which acquisition (disposal) impact 0.0 0.0 0.0 0.0 0.0 0.0 0.0 0.0
Of which organic sales growth -6.7 -6.3 -5.7 -5.0 -11.6 -12.7 11.2 13.8
Operating profit before depreciation
13.7 14.5 14.6 13.6 -6.2% 12.9 17.3 15.2 16.7 -15.1%
and amortization (EBITDA)
Average number of full-time equivalent
1,248 1,435 776 820
employees
31 Presentation on half-year results 2020/21 03 March 2021Appendix
Currency exposure
As every globally active group, dormakaba is exposed to currency risks.
The currency profile of dormakaba shows a broad balance between sales and cost per region (= natural hedge).
Sales per currency regions Cost per currency regions
29% 25%
33% 30%
USD USD
EUR EUR
CHF CHF
Other Other
8%
8%
30% 37%
32 Presentation on half-year results 2020/21 03 March 2021Appendix
Shareholder structure (1) – supporting sustainable development
dormakaba Holding AG (CH) (2)
[listed on SIX Swiss Exchange]
Shareholder dormakaba Holding AG 30.06.2019 30.06.2020
Pool Shareholders(4) 27.2% 28.7%
Shareholder Pool Free Float 72.8% 71.3%
(28.7%) Free float 52.5%
(71.3%)
“Kaba” Family
(18.0%) • Members of the Pool Shareholder Group hold:
• An economic interest of 62.6% in dormakaba;
“Dorma” Family dormakaba Holding • 28.7% of the 52.5% in dormakaba Holding GmbH +
(10.7%) 47.5% GmbH & Co. KGaA (DE) (3) Co. KGaA, which are directly held by the ultimate
parent company dormakaba Holding AG;
• And 47.5% in dormakaba Holding GmbH + Co.
KGaA.
• “Dorma” Family has increased its shareholding during
dormakaba FY 2019/20 from 9.2% to 10.7%.
operating entities (3)
(1) Asof 30 June 2020
(2) Strategic,
financial and operational decisions are made at level of listed holding entity
(3) Execution of M&A as well as financing take place at level of dormakaba Holding GmbH + Co. KGaA (intermediate holding entity) and below
(4) Based on a pool agreement dated 29.04.2015
33 Presentation on half-year results 2020/21 03 March 2021Appendix
“Cash is king” update
Early implementation of a comprehensive crisis management
• In March 2020, the “cash is king” principle was introduced throughout the entire organization to
address the Covid-19 challenges
• Adjustment of financial management to retain entrepreneurial flexibility at all times
• Weekly steering by senior management, strong collaboration between Operations, HR,
Finance, and IT
Measures (extract)
• Re-assessment and adjustment of previously approved investments and projects
• Reduction in overtime, vacation days and of temporary workers, hiring freeze, selective use of
short-time work in selected countries
• De-prioritization of M&A (continuation of pipeline management)
• Daily monitoring of cash flow development by tracking of all bank accounts
Status and results as at 31 December 2020 (extract)
• Significant improvement of working capital against 31.12.2019 (pre-Covid) as well as against
30.06.2020
• Solid de-leveraging (net debt/EBITDA) to 1.5x
• Sufficient committed credit lines available (undrawn amount of more than CHF 650 million)
34 Presentation on half-year results 2020/21 03 March 2021You can also read


