THE IPA / STANGER MONITOR - Institute for ...
←
→
Page content transcription
If your browser does not render page correctly, please read the page content below

THE IPA / STANGER MONITOR                                                                                                                                          TM

                      Tracking the Performance of Alternative Investments

VOLUME III No. 1                                                                                                                                        WINTER 2021

          THE IPA / STANGER MONITOR is sponsored by the Institute for Portfolio Alternatives (“IPA”) and authored and published by
Robert A. Stanger & Co., Inc. (“Stanger”). THE IPA / STANGER MONITOR performance analysis tracks the total return of non-listed
REITs, including 35 lifecycle REITs and 13 Net Asset Value (“NAV”) REITs with a combined market capitalization of over $66.8 billion.
Non-listed products are generally designed to eliminate some volatility of the traded market while still providing the transparency of a
publicly-registered company.

         Lifecycle REITs are designed to be limited-life products that undergo a lifecycle of fundraising followed by a liquidity event of
some form. Lifecycle REITs generally provide their first independent appraisal-based NAV at a maximum of 2 years and 150 days after
fundraising escrow break, and at least annually thereafter. NAV REITs are perpetual-life products that continue fundraising indefinitely
while providing updated NAVs on a daily or monthly basis.

           The Stanger NAV REIT Total Return Index and The Stanger Lifecycle REIT Total Return Index showed cumulative returns
(distributions and capital appreciation) of 22.7% and -2.4%, respectively, for the three years ended December 31, 2020. The pricing
and performance of all REITs generally reflects the underlying performance of the real estate owned which in turn is based upon cash
distributions and net asset value of the equity.
           Stanger’s indices rely on the most recently reported NAVs for the companies comprising such indices, and as such they may
include companies that have not reported updated NAVs since the onset of the COVID-19 pandemic.

THE IPA / STANGER MONITOR is published quarterly for $997 per year by Robert A. Stanger & Co., Inc., 1129 Broad Street, Ste. 201, Shrewsbury, New Jersey 07702-
4314, T. 732-389-3600. © 2021 Robert A. Stanger & Co., Inc. Reproduction, photocopying or incorporation into any information retrieval system for external or internal use
is prohibited unless permission is obtained beforehand from the publisher in each case for a specific article. The subscription entitles the subscriber to one original only.
Unauthorized copying is considered theft. A corporate subscription that permits unlimited copying for internal company use is available. This publication is designed to
provide accurate and authoritative information in regard to the subject matter solely for professional financial advisors. The contents are statistical summaries of multiple
companies’ financial data which, on their own, are not sufficient upon which to make an investment decision. It is sold with the understanding that the publisher is not en-
gaged in rendering investment advisory, legal or accounting services. Robert A. Stanger & Co., Inc. conducts a financial and management consulting business and may
perform such services for companies discussed in this publication. Member: SIPC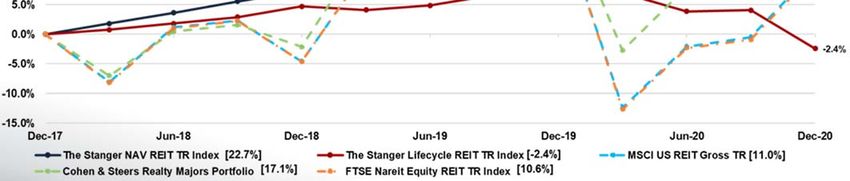
Industry Comparison
                                                           as of 12/31/2020

                                                                                                                            Cumulative Total
                                                                              Annualized Total Return
                                                                                                                               Return

                                                                     1 Year               2 Year             3 Year               3 Year
Stanger NAV REIT Total Return Index                                  5.33%                6.89%              7.05%               22.69%
Stanger Lifecycle REIT Total Return Index                            -9.18%              -3.46%              -0.81%               -2.41%
MSCI US REIT Index (Gross Total Return)                              -7.55%               7.83%              3.53%               10.99%
Cohen & Steers Realty Majors Portfolio                               -4.98%               9.35%              5.38%               17.07%
FTSE Nareit Equity REIT Total Return Index                           -7.98%               7.65%              3.39%               10.56%
S&P 500 Total Return Index                                           18.33%              24.73%              14.14%              48.85%
Dow Jones Industrial Average Index                                   9.70%               17.25%              9.87%               32.75%

                       The Stanger REIT Total Return Indices
                                                           as of 12/31/2020

                            The Stanger NAV REIT Total Return Index                      The Stanger Lifecycle REIT Total Return Index
                                               3-Month            Trailing                                     3-Month            Trailing
                               Index            Return           12-Month                      Index            Return           12-Month
2017        Q4                113.83             1.98%             6.79%                      112.90             1.99%             6.25%
2018        Q1                115.91             1.82%             7.47%                      113.79             0.79%             5.57%
            Q2                117.97             1.78%             7.54%                      114.99             1.05%             5.45%
            Q3                120.20             1.89%             7.68%                      116.20             1.05%             4.97%
            Q4                122.20             1.67%             7.35%                      118.23             1.75%             4.72%
2019        Q1                124.26             1.68%             7.21%                      117.56            -0.57%             3.31%
            Q2                126.75             2.01%             7.44%                      118.43             0.74%             2.99%
            Q3                130.30             2.80%             8.41%                      120.44             1.70%             3.65%
            Q4                132.59             1.75%             8.50%                       121.32            0.73%             2.61%
2020        Q1                126.65            -4.48%             1.93%                       120.84           -0.40%             2.79%
            Q2                129.20             2.01%             1.93%                       117.31           -2.92%            -0.95%
            Q3                134.52            4.12%              3.24%                       117.53            0.19%            -2.42%
            Q4                139.66            3.82%              5.33%                       110.18           -6.25%            -9.18%

           The Stanger NAV REIT Total Return Index measures the performance of NAV REITs on a quarterly basis. Stanger began calculating
the index on December 31, 2015, with a base level of 100. NAV REITs with a minimum of one calendar quarter of performance are included.
The Stanger NAV REIT Total Return Index currently includes 14 NAV REITs with a total of 68 separate share classes: Black Creek Diversified
Property Fund Inc.; Blackstone Real Estate Income Trust, Inc.; Cantor Fitzgerald Income Trust, Inc.; Clarion Partners Real Estate Income
Fund; CIM Income NAV, Inc.; FS Credit Real Estate Income Trust, Inc.; Griffin Capital Essential Asset REIT, Inc.; Hines Global Income Trust,
Inc.; InPoint Commercial Real Estate Income, Inc.; Jones Lang LaSalle Income Property Trust, Inc.; Nuveen Global Cities REIT, Inc.; Oaktree
Real Estate Income Trust; RREEF Property Trust, Inc.; and Starwood Real Estate Income Trust, Inc. NAV REITS are publicly-registered offer-
ings that generally provide liquidity of up to 5% of net assets per quarter (20% per annum) with an underlying reported value that is generally
based upon appraisals.
           The Stanger Lifecycle REIT Total Return Index measures the performance of Lifecycle REITs on a quarterly basis. Stanger began
calculating the index on December 31, 2015, with a base level of 100. Lifecycle REITs are added to the index in the quarter that their first
NAV is announced. REITs are removed from the index upon listing, merger, or in the case of a liquidation by sale of properties, upon conver-
sion to a liquidation basis of accounting. The Stanger Lifecycle REIT Total Return Index currently includes 40 Lifecycle REITs with a total of 67
separate share classes.

THE IPA / STANGER MONITOR                                              2                                                         WINTER 2021
Traded REITS - Trading Premium/Discount over NAV

                                                                                                Note:
                                                                                                -Data based on Analysts’ NAV estimates and
                                                                                                trading prices as of close of business on
                                                                                                01/15/2021.
                                                                                                -Values adjacent to investment categories are
                                                                                                based on number of REITs in each category.
                                                                                                -REITs may appear in multiple categories de-
                                                                                                pending on investment focus.
                                                                                                -Represents only REITs with current Analyst
                                                                                                estimates. Does not track all traded REITs.
                                                                                                -Analysts’ NAVs may be outdated, likely relying
                                                                                                on 9/30/20 financial data.

        NAV REIT Performance - Ranked by 3-Year Return
                                                               as of 12/31/2020
                                                                         Annualized Total Return                       Total Return Rank
                                                                        1 Year    3 Year    5 Year                  1 Year   3 Year   5 Year
Blackstone Real Estate Income Trust - Class I                            6.92%         9.13%            -               2            1            -
Hines Global Income Trust, Inc - Class AX                                4.54%         7.94%         9.11%              6            2            1
RREEF Property Trust - Class I                                           4.19%         6.70%         7.16%              7            3            2
Black Creek Diversified Property Fund - Class I                          5.78%         5.78%         5.27%              5            4            5
Cantor Fitzgerald Income Trust, Inc. - Class IX                          1.68%         4.99%            -               9            5            -
Jones Lang Lasalle Income Property Trust - Class M-I                     -0.69%        4.41%         5.31%             12            6            4
Griffin Capital Essential Asset REIT - Class A                           0.17%         3.34%         6.00%             10            7            3
CIM Income NAV, Inc. - Class I                                           -0.27%        2.53%         3.98%             11            8            6
Oaktree Real Estate Income Trust - Class I                               9.95%             -            ‐               1            9            -
FS Credit Real Estate Income Trust, Inc. - Class I                       6.76%             -            ‐               3           10            -
Starwood Real Estate Income Trust, Inc. - Class I                        6.40%             -            ‐               4           11            -
Nuveen Global Cities REIT - Class I                                      3.73%             -            ‐               8           12            -
InPoint Commercial Real Estate Income, Inc. - Class I                   -16.89%            -            ‐              13           13            -
Note: Total returns are calculated without sales load and with reinvestment where a DRIP is available. Rankings are based on the share class generat-
ing the highest total return. Griffin Capital Essential Asset REIT’s Class A share returns and not Class E share returns were displayed in order to cap-
ture the history of the Perpetual NAV fund as opposed to the legacy GCEAR I fund. Nuveen Global Cities REIT return based on estimated December
2020 distribution.

  Lifecycle REIT Performance - Ranked by 3-Year Return
                                                               as of 12/31/2020
                                                                          Annualized Total Return                           Total Return Rank
                                                                        1 Year         3 Year        5 Year          1 Year       3 Year       5 Year
Cole Office & Industrial REIT (CCIT II), Inc. - Class A                  4.59%          7.76%        10.44%             7            1            2
Strategic Storage Trust IV, Inc. - Class A                               7.12%          7.24%            -              1            2             -
Note: Total returns are calculated without sales load and with reinvestment where a DRIP is available. Rankings are based on the share class with the
highest total return.

THE IPA / STANGER MONITOR                                                   3                                                            WINTER 2021
Lifecycle REIT Performance - Ranked 3-Year Return (continued)
                                                               as of 12/31/2020

                                                                          Annualized Total Return                          Total Return Rank

                                                                       1 Year         3 Year        5 Year         1 Year       3 Year      5 Year
Griffin-American Healthcare REIT IV, Inc. - Class I                    4.83%          7.16%            -               5           3            -
Corporate Property Associates 18 - Global Inc. - Class A               2.61%          7.06%         6.04%             12           4           11
Steadfast Apartment REIT, Inc.                                         1.93%          6.89%         9.17%             15           5           4
SmartStop Self Storage REIT, Inc. - Class A                            3.31%          6.45%         9.42%             10           6           3
Black Creek Industrial REIT IV, Inc. - Class I                         6.26%          6.06%            -               3           7            -
Lightstone Value Plus Real Estate Investment Trust V, Inc.             3.52%          5.68%         3.51%             9            8           18
Griffin-American Healthcare REIT III, Inc.                             2.14%          5.59%         6.90%             13           9           8
KBS Real Estate Investment Trust III, Inc.                             -2.67%         5.05%         9.07%             20          10           5
Resource Real Estate Opportunity REIT, Inc.                            3.98%          4.93%         5.91%             8           11           12
Resource Apartment REIT III, Inc. - Class I                            0.26%          4.92%            -              18          12            -
Sila Realty Trust, Inc. - Class A                                      6.42%          4.80%         6.15%             2           13           10
Lightstone Value Plus Real Estate Investment Trust, Inc.               0.71%          4.61%         4.61%             16          14           16
Resource Real Estate Opportunity REIT II, Inc.                         4.76%          4.50%         6.19%             6           15           9
Lightstone Value Plus Real Estate Investment Trust II, Inc.            0.00%          4.46%         5.06%             19          16           15
Benefit Street Partners Realty Trust, Inc.                             2.64%          4.24%         1.03%             11          17           21
Pacific Oak Strategic Opportunity REIT, Inc.                           -8.86%         3.28%         5.24%             26          18           14
Lightstone Real Estate Income Trust, Inc.                              -4.01%         3.21%         7.92%             21          19           6
CNL Healthcare Properties, Inc.                                        0.31%          2.32%         4.28%             17          20           17
Moody National REIT II, Inc. - Class A                                 2.02%          1.97%         7.68%             14          21           7
Hartman Short Term Income Properties XX, Inc.                          -5.93%         1.21%        10.67%             23          22           1
Lightstone Value Plus Real Estate Investment Trust III, Inc.           -7.00%         0.65%         5.40%             25          23           13
InvenTrust Properties Corp.                                            -5.24%         -1.74%       -1.91%             22          24           25
Phillips Edison & Company, Inc.                                       -19.61%         -2.68%        2.39%             32          25           19
Strategic Realty Trust, Inc.                                          -10.41%         -3.18%        -1.25%            30          26           23
Inland Real Estate Income Trust, Inc.                                  -9.79%         -3.33%        1.06%             28          27           20
RW Holdings NNN REIT, Inc.                                            -26.74%         -3.94%           -              33          28            -
CIM Real Estate Finance Trust, Inc.                                   -11.25%         -4.41%        0.58%             31          29           22
KBS Real Estate Investment Trust II, Inc.                             -10.03%         -5.08%        -3.42%            29          30           26
Healthcare Trust, Inc.                                                 -6.84%         -5.85%        -1.33%            24          31           24
Hospitality Investors Trust, Inc.                                      -9.34%        -14.15%       -16.46%            27          32           29
Watermark Lodging Trust, Inc. - Class A                               -51.71%        -16.23%       -4.36%             35          33           27
NorthStar Healthcare Income, Inc.                                     -37.76%        -21.77%       -12.14%            34          34           28
Cottonwood Communities Inc. - Class A                                  5.12%             -             ‐               4           -            -

Note: Returns are calculated without sales load and with reinvestment where available. Rankings are based on the share class with the highest return.

THE IPA / STANGER MONITOR                                                 4                                                            WINTER 2021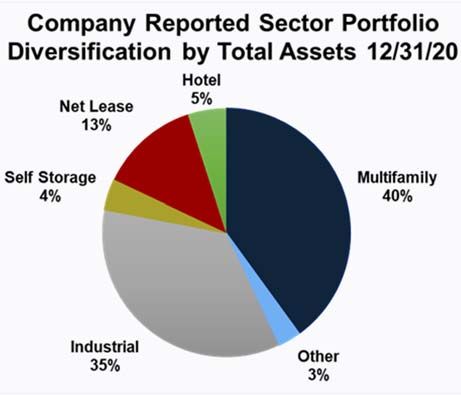
Top NAV REIT Spotlight
Blackstone Real Estate Income Trust, Inc.
Formed on August 31, 2016, specializes in stabilized income-oriented commercial real estate located within the United States, con-
centrated within the multifamily and industrial sectors. In addition, the Company has made several large scale strategic acquisitions,
including recently acquiring Simply Self Storage from a Brookfield Asset Management real estate fund for approximately $1.2 billion.
From inception to December 2020, the Company raised over $21.1 billion in gross proceeds with the most recent monthly fundraising
grossing upwards of $835.2 million. Included in this figure are BREIT’s sales of unregistered Class I shares of common stock to feeder
vehicles primarily created to hold the Company’s Class I shares, which in turn offer interests in themselves to non-U.S. persons.
As of December 2020, the Company has reported it had over $41.0B in total assets, including 1,370 properties with an overall 94%
occupancy.
For more information visit: https://www.breit.com/

                                 Top Lifecycle REIT Spotlight

Cole Office & Industrial REIT (CCIT II), Inc.
Formed on February 26, 2013, the Company real estate portfolio, as
of September 30, 2020, was composed of 26 office and industrial
properties located around the United States and was 99.6% occupied
with 8.3 years weighted average remaining lease term.
The Company completed its offering in 2016, having raised over
$650 Million.
On October 29, 2020, the Company entered into an agreement to
merge with and into Griffin Capital Essential Asset REIT, Inc. At the
effective time of the Merger, each issued and outstanding share of
the Company’s common stock, will be converted into the right to re-
ceive 1.392 shares of GCEAR’s Class E common stock.
For more information visit:
https://www.cimgroup.com/public-investment-programs/closed-public-

The information presented on this page is necessarily incomplete and was obtained from public filings. These issuers are
featured, without separate compensation, because they posted the top ranked performance in the prior charts. This is nei-
ther a recommendation or endorsement of these products and past performance is not a guarantee of future results. Robert
A. Stanger & Co., Inc. has provided services for compensation to many of the issuers or their affiliates identified in this pub-
lication, including the issuers presented on this page.

THE IPA / STANGER MONITOR                                         5                                                     WINTER 2021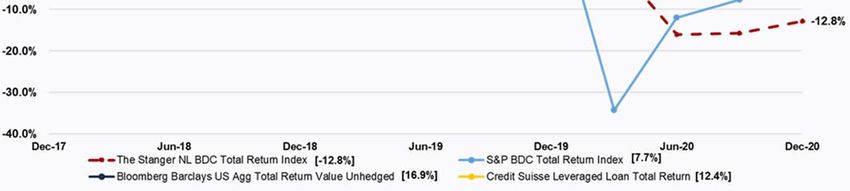
2020 Top Fundraising Spotlight
Blackstone Real Estate Income Trust, known as “BREIT,” is the industry leader in capital formation at $21.2 billion since inception in
2016 and has accumulated a massive portfolio aggregating more than $40 billion of real estate that expresses a smart “high conviction
strategy” to multi-family and residential assets (39%) and industrial (34%). BREIT also provides exposure to net-leased Las Vegas
based hotel and casino assets (Bellagio and MGM) representing (16%) of the portfolio, along with other hotel assets (5%) and self-
storage (4%). Additionally, BREIT has amassed an over $4.5 billion debt sleeve comprised primarily of CMBS and RMBS instruments.
BREIT raised $7.8 billion in 2020, posting a 69.1% market share in an otherwise down year for the Non-Traded REIT space due to the
Covid-19 pandemic. Most importantly, BREIT passed the 2020 “Stress Test” by meeting pandemic-fueled full-year redemptions, esti-
mated at more than $1.5 billion, without the hesitation of prorating or gating. Topping it all off, BREIT posted an anualized total return
on its I-Shares of 6.92%, rounding out a three-year annualized total return of 9.13%. The forth quarter distribution on BREIT shares
reflects a 5.5% return on the Class I NAV per share of $11.55.
For more information visit: https://www.breit.com/

The information presented on this page is necessarily incomplete and was obtained from public filings. These issuers are
featured, without separate compensation, because they posted the top funds raised in 2020. This is neither a recommenda-
tion or endorsement of these products and past performance is not a guarantee of future results. Robert A. Stanger & Co.,
Inc. has provided services for compensation to many of the issuers or their affiliates identified in this publication, including
the issuers presented on this page.

                          NAV REIT Performance - Alphabetical
                                                                as of 12/31/2020
                                                                                                                   Annualized Return
                                                                      Inception Maximum                                                         Since
                                                                        Date    Sales Load            1 Year        3 Year        5 Year      Inception
Black Creek Diversified Property Fund
     Class T                                                           09/30/12         3.5%          4.88%         4.88%         4.29%         5.66%
     Class S                                                           09/01/17         3.5%          4.88%         4.88%                       4.58%
     Class D                                                           09/30/12         0.0%          5.51%         5.52%         4.88%         6.22%
     Class I                                                           09/30/12         0.0%          5.78%         5.79%         5.23%         6.65%
     Class E                                                           04/03/06         8.5%          5.78%         5.78%         5.27%         4.44%
Blackstone Real Estate Income Trust
     Class T                                                           06/01/17         3.5%          6.25%         8.28%            -          8.86%
     Class S                                                           01/01/17         3.5%          6.07%         8.27%            -          8.67%
     Class D                                                           05/01/17         1.5%          6.85%         8.83%            -          9.56%
     Class I                                                           01/01/17         0.0%          6.92%         9.13%            -          9.51%
Cantor Fitzgerald Income Trust
     Class AX                                                          5/18/17          5.0%          1.68%         4.99%            -          6.43%
     Class TX                                                          5/18/17          2.0%          0.66%         3.90%            -          5.32%
     Class IX                                                          5/18/17          0.0%          1.68%         4.99%            -          5.58%
CIM Income NAV
      Class T                                                          10/10/13         3.8%         -0.89%         1.81%         3.25%         5.20%
      Class S                                                          10/10/19         3.8%         -0.90%                                     0.20%
      Class D                                                          12/6/11          1.5%         -0.46%         2.28%         3.71%         6.83%
      Class I                                                          11/19/13         0.0%         -0.27%         2.53%         3.98%         5.73%
FS Credit Real Estate Income Trust
     Class T                                                           04/16/18         3.5%          5.85%            ‐             ‐          6.13%
     Class S                                                           05/04/18         3.5%          5.88%            -             ‐          6.17%
     Class D                                                           04/17/18         0.0%          6.46%            -             ‐          6.79%
     Class I                                                           01/05/18         0.0%          6.76%            -             ‐          6.41%
     Class M                                                           05/04/18         0.0%          6.40%            -             ‐          6.64%
Note: Total returns are calculated without sales load and with reinvestment when a DRIP is available. Sales load should be amortized over the expected dura-
tion of the investment. Maximum sales loads are for reference only and may not represent the terms of any individual investment. Since inception returns are
based on the latter of the effective date of the public offering or the escrow break date.

THE IPA / STANGER MONITOR                                                    6                                                              WINTER 2021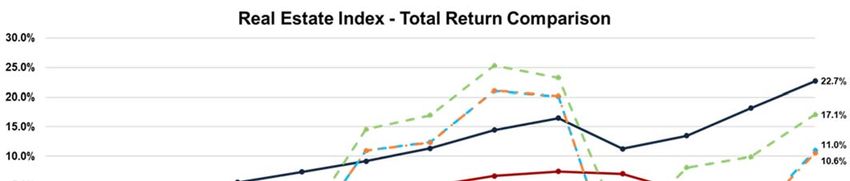
NAV REIT Performance - Alphabetical
                                                                as of 12/31/2020
                                                                                                                    Annualized Return
                                                                      Inception Maximum                                                          Since
                                                                        Date    Sales Load            1 Year        3 Year        5 Year       Inception
Griffin Capital Essential Asset REIT
       Class T                                                         09/20/17          3.5%         -0.39%         2.87%            -          3.31%
       Class S                                                         09/20/17          3.5%         -0.28%         2.91%            -          3.31%
       Class D                                                         09/20/17          0.0%          0.46%         3.65%            -          4.05%
       Class I                                                         09/20/17          0.0%          0.71%         3.90%            -          4.31%
       Class A                                                         09/23/14         10.0%         0.17%          3.34%         6.00%         6.03%
       Class AA                                                        11/02/15         4.5%          0.17%          3.34%         4.41%         4.48%
       Class AAA                                                       04/25/16         1.0%          0.17%          3.34%            -          5.21%
       Class E                                                         11/06/09         10.0%         0.61%          3.99%         4.40%         7.53%
Hines Global Income Trust
     Class T                                                           01/01/18          3.5%         3.54%          6.90%            -          6.91%
     Class S                                                           01/01/18          3.5%         3.54%          6.90%            -          6.91%
     Class D                                                           01/01/18          0.0%         4.30%          7.68%            -          7.68%
     Class I                                                           01/01/18          0.0%         4.55%          7.93%            -          7.94%
     Class AX                                                          10/01/14         10.0%         4.54%          7.94%         9.11%         8.53%
     Class TX                                                          09/01/15         4.8%          3.53%          6.90%         8.08%         7.92%
     Class IX                                                          05/01/17          0.0%         4.29%          7.67%            -          7.52%
InPoint Commercial Real Estate Income, Inc.
      Class A                                                            9/3/19         7.3%         -16.86%            ‐             ‐         -11.55%
      Class T                                                            8/1/19         3.5%         -17.33%            -             ‐         -11.27%
      Class D                                                            9/3/19         0.0%         -17.00%            -             ‐         -11.73%
      Class I                                                            8/1/19         0.0%         -16.89%            -             ‐         -10.69%
Jones Lang Lasalle Income Property Trust
     Class A                                                            10/1/12         3.5%          -1.36%         3.65%         4.48%         5.46%
     Class M                                                            10/1/12         0.0%          -0.88%         4.16%         5.04%         6.05%
     Class A-I                                                          6/30/14         1.5%          -0.88%         4.16%         5.06%         6.16%
     Class M-I                                                          6/30/14         0.0%          -0.69%         4.41%         5.31%         6.42%
Nuveen Global Cities REIT
      Class T                                                          01/01/19         3.5%          3.01%             ‐             ‐          5.07%
      Class S                                                           12/1/19         3.5%          2.82%             -             ‐          3.40%
      Class D                                                          06/01/18         0.0%          3.49%             -             ‐          5.60%
      Class I                                                          05/01/18         0.0%          3.73%             -             ‐          5.90%
Oaktree Real Estate Income Trust
      Class S                                                           12/6/19         3.5%          7.82%             ‐             ‐          8.15%
      Class I                                                           12/6/19         0.0%          9.95%             -             ‐         10.21%
RREEF Property Trust
    Class A                                                            08/12/13         3.0%          3.62%          6.24%         6.72%         7.13%
    Class T                                                            08/01/17         5.5%          3.70%          6.26%                       6.75%
    Class I                                                            05/30/13         0.0%          4.19%          6.70%         7.16%         7.87%
Starwood Real Estate Income Trust, Inc.
      Class T                                                          12/28/18         3.5%          5.72%             ‐             ‐          8.73%
      Class S                                                          12/28/18         3.5%          5.52%             -             ‐          9.00%
      Class D                                                          12/28/18         0.0%          6.26%             -             ‐          9.43%
      Class I                                                          12/28/18         0.0%          6.40%             -             ‐          9.80%
Note: Total returns are calculated without sales load and with reinvestment when a DRIP is available. Sales load should be amortized over the expected dura-
tion of the investment. Maximum sales loads are for reference only and may not represent the terms of any individual investment. Since inception returns are
based on the latter of the effective date of the public offering or the escrow break date. Nuveen Global Cities REIT return based on estimated December
2020 distribution.

THE IPA / STANGER MONITOR                                                    7                                                              WINTER 2021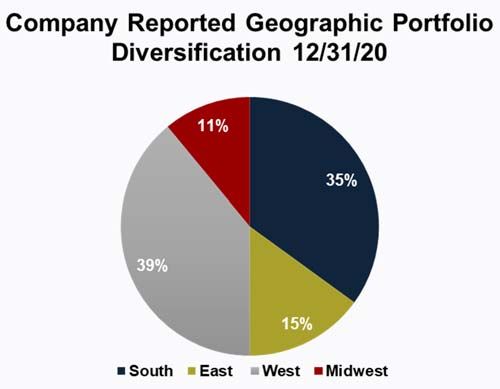
Lifecycle REIT Performance - Alphabetical
                                                                as of 12/31/2020

                                                                                                                      Annualized Return
                                                                            Inception Max Sales                                                  Since
                                                                              Date      Load             1 Year       3 Year      5 Year       Inception
AR Global Investments
     Healthcare Trust, Inc.                                                  04/12/13       10.0%        -6.84%       -5.85%      -1.33%         1.55%
Benefit Street Partners
     Benefit Street Partners Realty Trust, Inc.                              05/14/13       10.0%        2.64%        4.24%        1.03%         5.41%
Black Creek Group
     Black Creek Industrial REIT IV, Inc. - Class T                          11/30/16        4.5%        5.20%        5.02%           -          5.54%
     Black Creek Industrial REIT IV, Inc. - Class W                          08/31/16        0.0%        5.73%        5.55%           -          5.66%
     Black Creek Industrial REIT IV, Inc. - Class I                          11/30/16        0.0%        6.26%        6.06%           -          6.50%
CIM Group
     Cole Office & Industrial REIT (CCIT II), Inc. - Class A                 01/13/14        9.0%        4.59%        7.76%       10.44%         9.40%
     Cole Office & Industrial REIT (CCIT II), Inc. - Class T                 04/29/16        5.0%        3.56%        6.70%           -          6.92%
     CIM Real Estate Finance Trust, Inc.                                     04/13/12        9.0%       -11.25%       -4.41%       0.58%         4.20%
CNL Financial Group
   CNL Healthcare Properties, Inc.                                           07/05/11       10.0%        0.31%        2.32%        4.28%         5.05%
Colony Capital
    NorthStar Healthcare Income, Inc.                                        02/11/13       10.0%       -37.76%      -21.77%      -12.14%       -5.36%
Cottonwood Residential, Inc.
     Cottonwood Communities Inc. - Class A                                   12/28/18        0.0%        5.12%           -            ‐          5.08%
Glenborough
     Strategic Realty Trust, Inc.                                            11/12/09       10.0%       -10.41%       -3.18%      -1.25%        -0.31%
Griffin Capital Company
     Griffin-American Healthcare REIT III, Inc.                              05/14/14       10.0%        2.14%        5.59%        6.90%         6.81%
     Griffin-American Healthcare REIT IV, Inc. - Class I                     06/17/16        1.0%        4.83%        7.16%           -          6.95%
    Griffin-American Healthcare REIT IV, Inc. - Class T                      04/12/16        4.0%        4.83%        5.68%           -          5.92%
Hartman Advisors
     Hartman Short Term Income Properties XX, Inc.                           12/20/10        9.5%        -5.93%       1.21%       10.67%         9.23%
Hospitality Investors Trust
     Hospitality Investors Trust, Inc.                                       02/03/14       10.0%        -9.34%      -14.15%      -16.46%      -10.53%
Inland Real Estate Investment Corp.
     Inland Real Estate Income Trust, Inc.                                   10/26/12       10.0%        -9.79%       -3.33%       1.06%         3.06%
InvenTrust Properties Corp.
     InvenTrust Properties Corp.                                             10/13/05       10.0%        -5.24%       -1.74%      -1.91%         1.75%
KBS Capital Advisors
     KBS Real Estate Investment Trust II, Inc.                               06/24/08        9.5%       -10.03%       -5.08%      -3.42%         4.11%
     KBS Real Estate Investment Trust III, Inc.                              03/24/11        9.5%        -2.67%        5.05%      9.07%          9.11%
The Lightstone Group
    Lightstone Real Estate Income Trust, Inc.                                06/12/15       10.0%        -4.01%       3.21%        7.92%         8.00%
    Lightstone Value Plus Real Estate Investment Trust, Inc.                 06/12/05        0.0%         0.71%       4.61%        4.61%         6.81%
    Lightstone Value Plus Real Estate Investment Trust II, Inc.              10/01/09        0.0%         0.00%       4.46%        5.06%         6.08%
    Lightstone Value Plus Real Estate Investment Trust III, Inc.             12/11/14       10.0%        -7.00%       0.65%        5.40%         5.49%
    Lightstone Value Plus Real Estate Investment Trust V, Inc.               04/01/08        9.5%         3.52%       5.68%        3.51%         4.47%

Note: Total returns are calculated without sales load and with reinvestment when a DRIP is available. Sales load should be amortized over the expected dura-
tion of the investment. Maximum sales loads are for reference only and may not represent the terms of any individual investment. Since inception returns are
based on the latter of the effective date of the public offering or the escrow break date.

THE IPA / STANGER MONITOR                                                    8                                                              WINTER 2021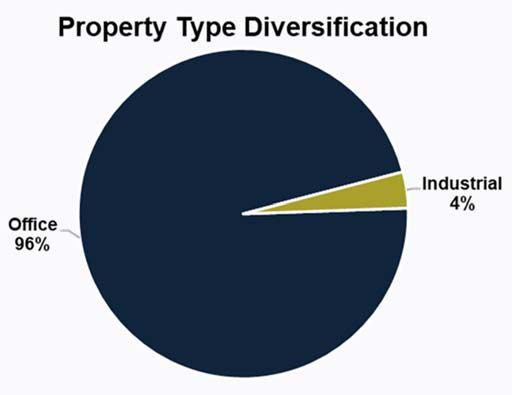
Lifecycle REIT Performance - Alphabetical
                                                                           as of 12/31/2020
                                                                                                                                         Annualized Return
                                                                                        Inception Max Sales                                                             Since
                                                                                          Date      Load                  1 Year         3 Year         5 Year        Inception
Pacific Oak Capital Advisors
    Pacific Oak Strategic Opportunity REIT, Inc.                                         04/19/10           9.5%          -8.86%         3.28%          5.24%           8.13%
Phillips Edison & Company, Inc.
     Phillips Edison & Company, Inc.                                                     09/17/10          10.0%         -19.61%         -2.68%         2.39%           6.12%
Resource Real Estate
     Resource Apartment REIT III, Inc. - Class I                                         06/30/17           1.5%          0.26%          4.92%             -            4.99%
     Resource Apartment REIT III, Inc. - Class A                                         06/29/16          10.0%          0.26%          4.85%             -            4.69%
     Resource Apartment REIT III, Inc. - Class T                                         06/29/16           5.0%          0.00%          4.09%             -            3.94%
     Resource Real Estate Opportunity REIT, Inc.                                         09/07/10          10.0%          3.98%          4.93%          5.91%           7.68%
     Resource Real Estate Opportunity REIT II, Inc.                                      06/02/14          10.0%          4.76%          4.50%          6.19%           7.92%
Rich Uncles NNN REIT Operator
     RW Holdings NNN REIT, Inc.                                                          06/15/16           0.0%         -26.74%         -3.94%             -          -0.32%
SmartStop Asset Management
     SmartStop Self Storage REIT, Inc. - Class A                                         05/23/14          10.0%          3.31%          6.45%          9.42%           8.70%
     SmartStop Self Storage REIT, Inc. - Class T (Pre NAV)                               09/29/15          5.0%           2.43%          5.56%          8.32%           8.35%
     SmartStop Self Storage REIT, Inc. - Class T (Post NAV)                              12/31/16          5.0%           2.32%          5.44%             -            5.79%
     Strategic Storage Trust IV, Inc. - Class A                                          03/17/17          10.0%          7.12%          7.24%             -            7.15%
     Strategic Storage Trust IV, Inc. - Class T                                          03/17/17          5.5%           5.99%          6.22%             -            6.22%
     Strategic Storage Trust IV, Inc. - Class W                                          03/17/17          0.0%           6.59%          6.41%             -            6.47%
Sila Realty Trust, Inc.
     Sila Realty Trust, Inc. - Class A                                                   07/02/14          10.0%          6.42%          4.80%          6.15%           6.34%
     Sila Realty Trust, Inc.- Class I                                                    03/09/17          1.0%           6.42%          4.80%             -            5.68%
     Sila Realty Trust, Inc. - Class T                                                   01/06/16          6.0%           5.36%          3.77%             -            5.14%
     Sila Realty Trust, Inc. - Class T2                                                  03/20/18           5.5%          5.36%             -               ‐           3.58%
Steadfast Income Advisor
     Steadfast Apartment REIT, Inc.                                                      02/17/14          10.0%          1.93%          6.89%          9.17%           8.31%
Watermark Lodging Trust, Inc.
     Watermark Lodging Trust, Inc. - Class A                                             05/15/15          10.0%         -51.71%        -16.23%        -4.36%          -3.21%
     Watermark Lodging Trust, Inc. - Class T                                             05/15/15          4.8%          -52.23%        -17.11%        -5.33%          -4.16%
W.P. Carey
     Corporate Property Associates 18 - Global Inc. - Class A                            07/25/13          10.0%          2.61%          7.06%          6.04%           6.44%
     Corporate Property Associates 18 - Global Inc. - Class C                            07/25/13          3.8%           1.97%          6.25%          5.16%           5.62%
Note: Total returns are calculated without sales load and with reinvestment when a DRIP is available. Sales load should be amortized over the expected duration of the investment.
Maximum sales loads are for reference only and may not represent the terms of any individual investment. Since inception returns are based on the latter of the effective date of the
public offering or the escrow break date.

                                     Kevin T. Gannon                                                         Mark F. Stierman
                                     Chairman & CEO                                                      Executive Managing Director
                                     732-389-3600 x274                                                      732-389-3600 x286

           Trisha Miller                                                  Michael K. O’Neil                                         Nancy T. Schabel
      Executive Managing Director                                     Executive Managing Director                              Executive Managing Director
           703-774-5942                                                  732-389-3600 x293                                         732-389-3600 x233

THE IPA / STANGER MONITOR                                                                 9                                                                        WINTER 2021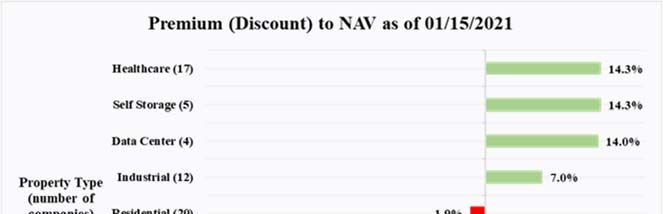
IPA Practice Guideline 2018-01 Summary

   Institute for Portfolio Alternatives Practice Guideline 2018-01: Per Share Investment Performance
                        Measurement & Reporting for Publicly Registered Non-Listed REITs,
                                                           Adopted April 16, 2018

IPA Practice Guideline 2018-01 provides recommendations relating to the determination and promulgation of investment performance information
primarily on a per-share basis for NL REITs. The guideline includes recommendations relating to: (1) Per Share Investment Performance of Operation-
al NL REITs; (2) Per Share Investment Performance of NL REITs Following Liquidity Events; Supplemental Disclosures Relating to Risk; Input Data
Sources and Standards; Initiation, Timing and Frequency of Performance Reporting; Reporting of Performance and Recommended Disclosures; Ac-
cessibility of Non-Public Performance Information for Broker-Dealer Confidential Use in Connection with Due Diligence; and Timing of Implementation.
The following is intended only as a summary of the Per Share Investment Performance of Operational NL REITs guideline, and does not purport to be
complete. (Access the complete guideline at http://www.ipa.com/wp-content/uploads/2018/07/IPA-Practice-Guideline-2018.pdf )

                               Per Share Investment Performance of Operational NL REITs
            The IPA recommends that the investment performance measures related to per-share level performance, from the perspective of the
financial returns (realized and unrealized) received by stockholders in the NL REIT, be developed and reported during the operational period. The
recommended investment performance measures include Period Specific Per Share Return, including Average Annual Return Over One-, Three-, and
Five-Year Periods (or more extended periods for longer-life NL REITs), and Since Inception Per Share Returns, including Average Annual Return and
Cumulative Total Return.

           These measures may have multiple bases to reflect: (i) performance with and without Sales Charges; and (ii) performance with and without
distribution reinvestment. The IPA Guideline recommends the use of Since Inception Per Share Return Measures Without Sales Charges, supplement-
ed with the presentation of such measures on a With Sales Charges basis. The IPA recommends that performance measures with distribution reinvest-
ment be the primary metric disclosed, and performance measures without distribution reinvestment be disclosed on a supplemental basis at the option
of the NL REIT.

          These measures show compound average annual return per share for periods ending on the most recent date of NAV determination. The
Practice Guideline focuses on annual periods in conformity with the frequency of determinations of NAV recommended in the IPA Valuation Guideline.
However, shorter computational periods may be used provided NAV’s conforming to the requirements herein are determined at the end of each such
period. The valuation at inception, or the proxy for beginning NAV, when determined excluding sales charges and expenses (Per Share Investment
Without Sales Charges) is intended to reflect the per share Net Investment amount reported in the issuer’s periodic filings with the SEC and on cus-
tomer account statements in accordance with the definition of Net Investment set forth in NASD Rule 2340.

           The IPA recommends that the initial calculation of Period Specific Per Share Return Measures be performed with an “as of” date consistent
with the “as of” date of the NL REIT’s first determination of its year-end NAV, that such calculation be performed and reported no later than 120 days
following the “as of” date of the first year-end NAV determination, and that performance measures be calculated and reported annually for each calen-
dar year thereafter, or if net asset values are available more frequently, on a calendar quarter basis thereafter. NL REITs which perform quarterly NAV
determinations prior to their first year-end NAV may commence reporting Period Specific Per Share Return Measures conforming to the requirements
herein prior to the dates cited above but in no event later than 120 days following the “as of” date of the first year-end NAV determination.

                                              Stanger Methodology

The IPA / STANGER MONITOR tracks the total return of NAV & Lifecyle NL REITs, with REIT coverage commencing at $50 million in public fundrais-
ing and ending at the completion of a liquidity event or substantial sale of assets. Total returns are calculated without sales load and assume reinvest-
ment in the DRIP when available. Individual investor returns would necessarily be less when sales charges are taken into account. Similarly, individu-
al investor returns are affected by the timing of the investor’s purchase within the offering period.

Total returns are calculated using Net Investment per share, as defined in NASD Rule 2340, as a proxy for NAV until a NAV calculated in compliance
with IPA Practice Guideline 2013-01: Valuation of Publicly Registered Non-Listed REITs is disclosed. Calculations are based on NAV disclosure
dates, rather than “as of” dates, to allow for timely dissemination of information and to aid in the comparison between REITs, as well as traded indi-
ces. The disclosure date represents the date the information was publicly filed with the SEC.

While the calculations of total returns reported herein conform to the IPA Practice Guideline 2018-01 formulas, the IPA guidelines are designed for
reporting of individual REIT performance and are based on NAV valuation “as of” dates with initial performance reporting occurring after the first NAV
disclosure. For further information please see the IPA Practice Guideline 2018-01 summary above.

THE IPA / STANGER MONITOR                                                  10                                                              WINTER
THE IPA / STANGER MONITOR
Non-Listed Business Development Company Performance
THE IPA / STANGER MONITOR performance analysis tracks the total return of 12 non-listed BDCs, with a combined market
capitalization of $6.4 billion. Non-listed products are generally designed to eliminate some volatility of the traded market while still
providing the transparency of a publicly-registered company. TM
Non-listed BDCs are designed to be limited-life products that undergo a lifecycle of fundraising followed by a liquidity event of
some form. Non-listed BDCs generally provide NAVs on a quarterly basis calculated in accordance with generally accepted accounting
principles (“GAAP”).
The Stanger Non-Listed BDC Total Return Index showed a cumulative return (distributions and capital appreciation)
of -12.8% for the three years ended December 31, 2020. The pricing and performance of all BDCs generally reflects the underlying
performance of the loans owned which in turn is based upon cash distributions and net asset value of the equity.
The Stanger BDC Total Return Index
as of 12/31/2020
Trailing Trailing
Index 12-Month Return Index 12-Month Return
2018 Q1 114.60 3.78% Q3 119.80 2.94%
Q2 114.46 1.32% Q4 117.33 -0.62%
Q3 116.38 2.68% 2020 Q1 117.00 2.00%
Q4 118.06 2.37% Q2 96.84 -18.08%
2019 Q1 114.70 0.09% Q3 97.20 -18.87%
Q2 118.21 3.28% Q4 100.55 -14.30%
The Stanger BDC Total Return Index measures the performance of non-listed BDCs on a quarterly basis. Stanger began calculating
the index on December 31, 2015, with a base level of 100. BDCs with a minimum of one calendar quarter of performance are included. The
Stanger BDC Total Return Index currently includes 12 BDCs: Business Development Corporation of America; CION Investment Corporation;
FS Energy & Power Fund; Guggenheim Credit Income Fund 2016 T; Guggenheim Credit Income Fund 2019; MSC Income Fund; NexPoint
Capital, Inc.; Owl Rock Capital Corporation II; Sierra Capital Corporation; StHealth Capital Investment Corp; Terra Income Fund 6, Inc.; and
Prospect Flexible Income Fund, Inc. Non-listed BDCs are publicly-registered offerings that generally provide liquidity of up to 10% of net assets
per annum.
THE IPA / STANGER MONITOR 11 WINTERIndustry Comparison
as of 12/31/2020
Annualized Total Return
1 Year 3 Year 5 Year
Stanger Non-Listed BDC Total Return Index -14.30% -7.70% -4.47%
S&P BDC Total Return Index -8.82% 8.07% 2.79%
Wells Fargo BDC Index -11.15% 6.34% 1.85%
Bloomberg Barclays US Agg Total Return Value Unhedged 7.49% 8.10% 5.33%
Credit Suisse Leveraged Loan Total Return 2.77% 5.43% 3.98%
S&P 500 Total Return Index 18.33% 24.73% 14.14%
Dow Jones Industrial Average Index 9.70% 17.25% 9.87%
Non-Listed BDC Performance - Ranked by 3-Year
as of 12/31/2020
Annualized Total Return Total Return Rank
1 Year 3 Year 5 Year 1 Year 3 Year 5 Year
Owl Rock Capital Corp II 5.74% 6.90% - 2 1 -
Terra Income Fund 6, Inc. 7.00% 5.45% 4.79% 1 2 2
Guggenheim Credit Income Fund 2016 T 2.26% 3.55% 4.97% 4 3 1
Guggenheim Credit Income Fund 2019 2.63% 3.37% 4.76% 3 4 3
MSC Income Fund, Inc. -5.53% 2.75% 4.70% 7 5 4
CION Investment Corp -0.67% 1.97% 4.49% 5 6 5
Business Development Corp of America -7.43% 0.44% 1.93% 8 7 7
Prospect Flexible Income Fund, Inc. -5.11% -6.69% -4.75% 6 8 9
NexPoint Capital, Inc. -20.56% -7.29% 2.04% 10 9 6
Sierra Income Corp -16.59% -8.52% -3.56% 9 10 8
FS Energy & Power Fund -40.43% -17.05% -8.47% 11 11 10
Note:
-Total returns are calculated without sales load and with reinvestment when a DRIP is available.
-Sales load should be amortized over the expected duration of the investment. Maximum sales loads are for reference only and may not represent the terms of
any individual investment. Since inception returns are based on the latter of the effective date of the public offering or the escrow break date.
THE IPA / STANGER MONITOR 12 WINTERNon-Listed BDC Performance - Alphabetical
as of 12/31/2020
Annualized Return
Inception Max Sales Since
Date Load 1 Year 3 Year 5 Year Inception
Benefit Street Partners
Business Development Corp of America 08/25/11 10.0% -7.43% 0.44% 1.93% 5.74%
CION Investments
CION Investment Corporation. 12/17/12 10.0% -0.67% 1.97% 4.49% 5.96%
FS Investments
FS Energy & Power Fund 07/18/11 10.0% -40.43% -17.05% -8.47% -2.93%
Guggenheim Partners
Guggenheim Credit Income Fund 2016 T 07/24/15 5.8% 2.26% 3.55% 4.97% 5.02%
Guggenheim Credit Income Fund 2019 07/31/15 3.0% 2.63% 3.37% 4.76% 4.68%
Highland Capital Management
NexPoint Capital, Inc. 09/02/14 8.0% -20.56% -7.29% 2.04% 1.02%
Main Street Capital Corporation
MSC Income Fund, Inc. 06/04/12 10.0% -5.53% 2.75% 4.70% 5.67%
Medley Management
Sierra Income Corp 04/17/12 9.8% -16.59% -8.52% -3.56% 1.04%
Owl Rock Capital Advisors
Owl Rock Capital Corp II 4/4/17 5.0% 5.74% 6.90% - 7.14%
Prospect Flexible Income Management
Prospect Flexible Income Fund, Inc. 06/25/14 10.0% -5.11% -6.69% -4.75% -2.66%
Terra Capital Partners
Terra Income Fund 6, Inc. 06/24/15 10.0% 7.00% 5.45% 4.79% 4.97%
Note: Total returns are calculated without sales load and with reinvestment when a DRIP is available. Sales load should be amortized over the expected dura-
tion of the investment. Maximum sales loads are for reference only and may not represent the terms of any individual investment.
Top Non-Listed BDC Spotlight
Owl Rock Capital Corp II formed in October 2015 and was first of-
fered to the public on February 3, 2017. The Company focuses
on investing in senior secured or unsecured loans, subordinated
loans or mezzanine loans and, to a lesser extent, equity-related se-
curities which includes common and preferred stock, securities con-
vertible into common stock, and warrants.
The Company continues its offering, having raised $1,313.9 million
since inception, with $42.2 raised in December 2020.
On December 23, 2020, Owl Rock Capital Group, the parent of the
Company’s Adviser, and Dyal Capital Partners, a unit of Neuberger
Berman, announced a merger to form Blue Owl Capital, which will
enter the public market via its acquisition by a special purpose acqui-
sition company. The combined entity will have over $45 billion in
assets under management. As a result of the Transaction, Blue Owl
will be listed on the NYSE under the new ticker “OWL.”
For more information visit:
https://owlrock.com/overview-orccii/
The information presented above is necessarily incomplete and was obtained from public filings. The issuer is featured, without separate
compensation, because they posted the top ranked performance in the prior charts. This is neither a recommendation or endorsement of
these products and past performance is not a guarantee of future results. Robert A. Stanger & Co., Inc. has provided services for compen-
sation to many of the issuers or their affiliates identified in this publication.
THE IPA / STANGER MONITOR 13 WINTERIPA Practice Guideline 2015-01 Summary
Institute for Portfolio Alternatives Practice Guideline 2015-01
Non-Listed BDC Practice Guideline
Issued April 27, 2015
IPA Practice Guideline 2015-01 provides recommendations in the following areas relating to published performance figures of non-listed BDC securi-
ties and the disclosure of such performance figures. The guideline includes recommendations relating to: (1) Basis of performance figures; (2) Report-
ing of Performance figures; (3) Shareholder Returns (Without Sales Charge) definition, Example of methodology and recommended disclosure; (4)
Shareholder Returns (With Sales Charge) definition, example of methodology and recommended disclosure; and (5) Net Asset Value (“NAV”) Returns
definition, example of methodology and recommended disclosure. The following is intended only as a summary of the Non-Listed BDC Practice Guide-
line, and does not purport to be complete. (Access the complete guideline at https://cdn.ymaws.com/ipa.site-ym.com/resource/resmgr/
Policy_Advocacy/IPA_Guidelines/Non-listed_BDC_Performance_G.pdf
Per Share Investment Performance of Non-Listed BDCs
The IPA recommends that three performance figures be approved for use in reference to the presentation of total returns of non-listed BDC
securities: Shareholder Returns (Without Sales Charge), Shareholder Returns (With Sales Charge) and NAV Returns calculated in accordance with
generally accepted accounting principles (“GAAP”).
Shareholder Returns (Without Sales Charge) is a total return calculation that captures the difference in price between a non-listed BDC’s
public offering price, excluding deductions for any selling commissions and dealer manager fees, if any, at the beginning of the applicable period and
the BDC’s redemption price at the end of the period, adjusted for any distributions paid during the relevant timeframe. The calculation also assumes full
participation in the non-listed BDC’s distribution reinvestment program (“DRP”). The IPA recommends that Shareholder Returns (Without Sales
Charge) for nonlisted BDCs be presented for the year-to-date period, rolling 1-year, 3-year and 5-year periods and since inception. The year-to-date
and 1-year returns should be compounded monthly (not annualized). The 3-year, 5-year and annualized since inception returns should be the average
annual total return for the relevant period, compounded monthly. A cumulative total return since inception, compounded monthly, should also be given.
Shareholder Returns (With Sales Charge) is a total return calculation that captures the difference between a non-listed BDC’s public offering
price, including the maximum selling commission and dealer manager fee disclosed by prospectus at the beginning of the applicable period and the
BDC’s redemption price at the end of the period, adjusted for any distributions paid during the relevant timeframe. The calculation assumes full partici-
pation by the investor in the BDC’s DRP. The IPA recommends that Shareholder Returns (With Sales Charge) for non-listed BDCs be presented as a
cumulative return since inception.
An NAV Return is a total return calculation that measures changes in a non-listed BDC’s NAV per share adjusting for any distributions paid
during the applicable period. Although NAV returns do not represent an actual return to shareholders, the performance figure does provide investors,
due diligence officers and other non-listed BDC constituents with uniform and transparent return information on a non-listed BDC’s investment portfolio
in conformance with GAAP. The IPA recommends that NAV Returns for non-listed BDCs be presented for the year-to-date period, rolling 1-year, 3-
year and 5-year periods and since inception. The year-to-date and 1-year returns should be compounded quarterly (not annualized). The 3-year, 5-
year and annualized since inception total returns should be the average annual total return for the relevant period, compounded quarterly. A cumulative
total return since inception, compounded quarterly, should also be given.
Stanger Methodology
The IPA / STANGER MONITOR tracks the total return of non-listed BDCs with coverage commencing one year after inception date and ending at the
completion of a liquidity event or substantial sale of assets. Total returns are calculated on an NAV Return basis and assume reinvestment in the
DRIP when available. Individual investor returns would necessarily be less when sales charges are taken into account. Similarly, individual investor
returns are affected by the timing of the investor’s purchase within the offering period.
Total returns are calculated using Net Investment per share, as defined in NASD Rule 2340, as a proxy for NAV until a NAV calculated in accordance
with generally accepted accounting principles (“GAAP”) is provided. Calculations are based on NAV disclosure dates, rather than “as of” dates, to
allow for timely dissemination of information and to aid in the comparison between BDCs, as well as traded indices. The disclosure date represents
the date the information was publicly filed with the SEC.
While the calculations of total returns reported herein conform to the IPA Practice Guideline 2015-01 NAV Return, the IPA guidelines are based on
NAV valuation “as of” dates with initial performance reporting occurring after the first NAV disclosure. For further information please see the IPA Prac-
tice Guideline 2015-01 summary above.
THE IPA / STANGER MONITOR 14 WINTERAbout Institute for Portfolio Alternatives
The Institute for Portfolio Alternatives seeks to raise awareness of portfolio diversifying investment (PDI) products among stakeholders
and market participants, including: investment advisors, public policymakers and the investing public. It supports increased access to
investment strategies with low correlation to the equity markets: lifecycle real estate investment trusts (“Lifecycle REITs”), net asset
value REITs (NAV REITs), business development companies (BDCs), interval funds and direct participation programs (DPPs). Through
advocacy and industry-leading education, the IPA is committed to ensuring all investors have access to real assets and the opportunity
to effectively balance their investment portfolios.
For more information visit https://www.ipa.com.
Brendan Geraghty
Director, Marketing and Communications
O: 202.548.7185
M: 248.303.1690
1455 Pennsylvania Avenue, NW | Suite 400
Washington D.C. | 20004 | 202.548.7190
About Robert A. Stanger & Co., Inc.
Robert A. Stanger & Co., Inc. is a nationally recognized investment banking firm specializing in providing strategic planning, invest-
ment banking, financial advisory, fairness opinion and asset and securities valuation services to partnerships, real estate investment
trusts and real estate advisory and management companies in support of strategic planning and execution, capital formation and fi-
nancings, mergers, acquisitions, reorganizations and consolidations.
Stanger has rendered investment banking, debt and equity capital-raising, fairness opinions, and other financial advisory services,
and/or appraisal services in connection with the formation of REITs, partnerships, limited liability companies and the consolidation,
merger or sale of other real estate entities.
Stanger is also well known for its flagship publication, The Stanger Report, a nationally recognized newsletter focused on direct partic-
ipation program and non-listed REIT investing; The Stanger Market Pulse, focused on public DPP, non-listed REIT and non-listed
BDC sales; The Stanger Interval Fund Report, focusing on non-listed interval fund investing, and the Stanger Digest, a newsletter
providing a weekly update on industry activities.
For more information visit https://rastanger.com/
Kevin T. Gannon Mark F. Stierman
Chairman & CEO Executive Managing Director
732.389.3600 x274 732.389.3600 x286
Trisha A. Miller Michael K. O’Neil Nancy T. Schabel
Executive Managing Director Executive Managing Director Executive Managing Director
703.774.5942 732.389.3600 x293 732.389.3600 x233
Rඊඍකග A. Sගඉඖඏඍක ຽ C., Iඖඋ. | 1129 Broad Street | Suite 201 | Shrewsbury, NJ | 07702
THE IPA / STANGER MONITOR 15 WINTERYou can also read