Boston Pizza Royalties Income Fund - Business Overview and Update February 13, 2020
←
→
Page content transcription
If your browser does not render page correctly, please read the page content below
Boston Pizza Royalties Income Fund
   Business Overview and Update
   February 13, 2020
   TSX : BPF.UN

BOSTON PIZZA ROYALTIES INCOME FUND

Forward Looking Information
   Certain information in this presentation constitutes “forward-looking information” that involves known and unknown risks, uncertainties,
   future expectations and other factors which may cause the actual results, performance or achievements of the Fund, BPI, or Boston Pizza
   restaurants (collectively, “Boston Pizza”) to be materially different from any future results, performance or achievements expressed or
   implied by such forward-looking information. All statements, other than statements of historical facts, included in this presentation that
   address activities, events or developments that the Fund or management of BPI expects or anticipates will or may occur in the future,
   including that the Fund will continue its long history of sustainable distributions, that Boston Pizza’s ability to leverage $26 million annual
   national marketing budget funded by franchisees along with proprietary digital marketing and loyalty programs will be on-going, that Boston
   Pizza’s engagement in local communities will be on-going, that Boston Pizza will launch a new ordering platform in 2020, that increased
   offer activity is expected in 2020 to drive member acquisition and transactions (in-restaurant and online), that Boston Pizza will continue to
   strengthen its position as Canada’s number one casual dining brand, that Boston Pizza will continuously refresh its restaurant portfolio by
   leveraging in-house development and design expertise, and that Boston Pizza will be growing third party delivery service partnerships to
   capitalize on changing consumer preferences, is forward-looking information. When used in this presentation, forward-looking information
   may include words such as “continue”, “on-going”, “expected” and other similar terminology. The material factors and assumptions used to
   develop the forward-looking information contained in this presentation include the following: future results being similar to historical
   results, expectations related to future general economic conditions, business plans, receipt of franchise fees and other amounts,
   franchisees’ access to financing, pace of commercial real estate development, protection of intellectual property rights of Boston Pizza
   Royalties Limited Partnership, absence of changes of laws, and absence of amendments to contracts. Risks, uncertainties and other
   factors that may cause actual results, performance or achievements to be materially different from any future results, performance or
   achievement expressed or implied by the forward-looking information contained herein, relate to (among others) competition, demographic
   trends, consumer preferences and discretionary spending patterns, business and economic conditions, legislation and regulation,
   distributable cash and reliance on operating revenues, accounting policies and practices, the results of operations and financial condition
   of BPI and the Fund, as well as those factors discussed under the heading “Risks & Uncertainties” in the Fund’s Management Discussions
   and Analysis for the period and year ended December 31, 2019. This information reflects current expectations regarding future events and
   operating performance and speaks only as of the date of this presentation. Except as required by law, the Fund and BPI assume no
   obligation to update previously disclosed forward-looking information. For a complete list of the risks associated with forward-looking
   information and our business, please refer to the “Risks & Uncertainties” and “Note Regarding Forward-Looking Information” sections
   included in the Fund’s Management’s Discussion and Analysis for the period and year ended December 31, 2019, available at
   www.sedar.com and www.bpincomefund.com.

BOSTON PIZZA ROYALTIES INCOME FUND
                                                                                                                                                     2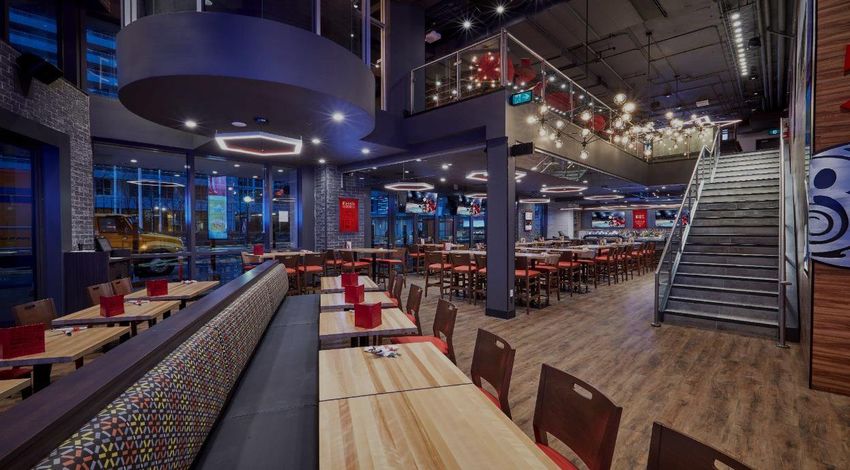
Document Overview

   04-07 Executive Summary

   08-22 Boston Pizza International Inc.
         (Operating Company or BPI)

   23-26 Boston Pizza Royalties Income Fund
         (The Fund or BPRIF)

BOSTON PIZZA ROYALTIES INCOME FUND
                                              3
Recent Financial Highlights
      Boston Pizza International Inc. (Operating Company)
       • The Canadian full-service restaurant sector continues to experience declines in
         guest traffic due to increased competition, shifts in consumer spending habits, and                                                           $1.1 billion
         higher levels of household debt                                                                                                               System-Wide Gross
       • In Q4 2019, Boston Pizza posted Same Restaurant Sales (“SRS”) on a Franchise                                                                     Sales in 2019
         Sales basis of negative 1.8% and closed 2 restaurants (on a gross and net basis)
       • Management is actively executing a number of initiatives to drive SRS growth                                                                   93.4%
                                                                                                                                                     Payout Ratio
      The Fund                                                                                                                                     on a pro-forma basis at the
                                                                                                                                                    current distribution level ⁽²⁾
       • The Fund’s Payout Ratio for 2019 was 104.8% and its Dividend Yield was 10.3%⁽¹⁾
       • The Fund announced a decrease in monthly distributions to 10.2 cents per Unit in                                                               9.1%
         order to realign its capital allocation to the current operating environment
         - Pro-forma Payout Ratio of 93.4% provides greater certainty over distributions⁽²⁾
                                                                                                                                                   Dividend Yield
                                                                                                                                                   on a pro-forma basis at the
         - Attractive pro-forma dividend yield of 9.1%⁽³⁾                                                                                           current distribution level ⁽³⁾
       • Pro Forma, the Fund is in a strong financial position and poised to continue
         its long history of sustainable distributions
(1) Based on a unit price of $13.46 as at December 31, 2019 and actual annual distribution level of $1.380 per unit (11.5 cents per month)
(2) On February 12, 2020, the Trustees declared a distribution for January 2020 of $0.102 per unit. If the Fund had paid $1.224 per unit ($0.102
    per month) in respect of 2019 instead of the $1.38 per unit that it did pay, the Payout Ratio would have been 93.4% rather than 104.8%.
(3) Based on a unit price of $13.46 as at December 31, 2019 and a new annual distribution level of $1.224 per unit (10.2 cents per month)
BOSTON PIZZA ROYALTIES INCOME FUND
                                                                                                                                                                                     4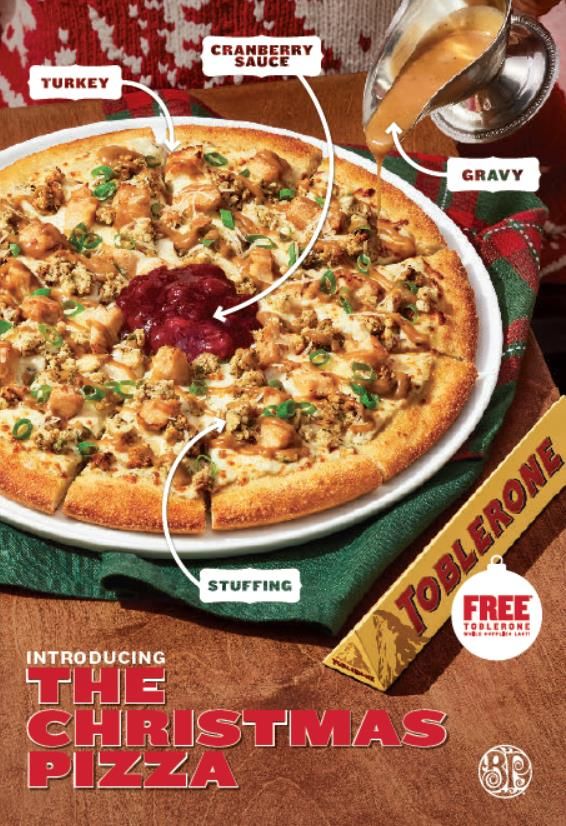
Investment Highlights
   • Canada’s #1 casual dining brand with an established network of 395
     restaurants operating in 10 provinces and two territories
   • Three distinct dining experiences (Restaurant, Sports Bar and Take-out &
     Delivery) and multiple dayparts provide diverse sales growth opportunities
   • Franchise business and the Royalty Fund model provide a recurring revenue
     stream for the Fund (and investors are not directly exposed to profitability and
     expenses of underlying business)
   • Track record of growth since 2002 IPO and commitment to stable and
     sustainable distributions over the longer-term (e.g. annual Payout Ratio has
     averaged 100% of Distributable Cash since IPO)
   • Successful franchisee network with a significant portion owning multiple
     locations which demonstrates strength of unit economics
   • Opportunity to open restaurants in both new and existing markets
   • Commitment to driving SRS demonstrated by recent operating initiatives
     including menu innovation, off-premise opportunities and restaurant
     renovations
   • Proven management team with extensive industry experience

BOSTON PIZZA ROYALTIES INCOME FUND
                                                                                        5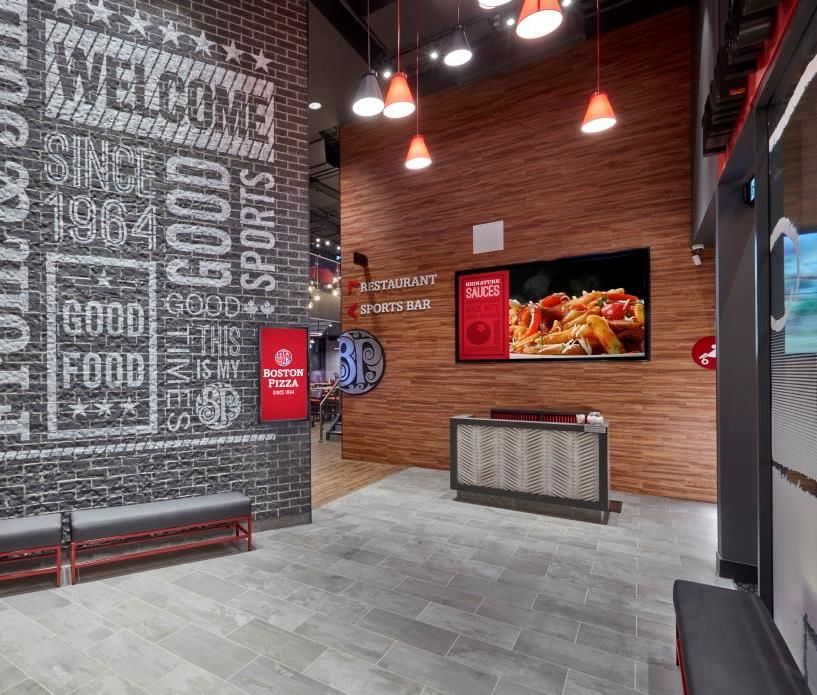
Boston Pizza Overview⁽¹⁾
                                       Operating Company                                                                                 The Fund (BPF.UN, TSX)
        • Brand was founded in 1964 (55-years ago) in Edmonton, Alberta.                                      Publicly Traded Units⁽²⁾                               25,011,637
                                                                                                              BPI’s % Ownership                                          12.9%
        • System-wide gross sales $1.1 billion in 2019 making Boston Pizza the
          undisputed leader in Canada’s casual dining industry.                                               Market Capitalization⁽²⁾                            $336.7 million
        • Proven management team with extensive experience and track record.                                  Total Drawn Debt Maturing in 2025⁽³⁾                 $88.3 million
        • Single-brand focused and 99% of total restaurants are franchised.                                   Cash Balance                                          $1.8 million
        • 395 total restaurants geographically dispersed across Canada, operating in                          Net Debt to EBITDA Ratio                            2.0:1.0 (2.0x)
          10 provinces and two territories.                                                                   Distribution per Unit – monthly / annualized        $0.115 / $1.38
        • Approx. 25,000 total restaurant staff serving 50 million guests annually.                           Distribution Yield – annualized                            10.3%

                                                                              10-Year Unit Price Performance

(1) Actual results as at December 31, 2019. Distribution Yield reflects unit price of $13.46 as at December 31, 2019.
(2) Assumes BPI’s exchangeable units were exchanged and publicly traded.
(3) The Fund amended and extended its credit facilities January 24, 2020.
BOSTON PIZZA ROYALTIES INCOME FUND
                                                                                                                                                                                   6
Proven Corporate Structure⁽¹⁾

                                        Operating Company                                                                                           The Fund

             GUESTS                          FRANCHISEES                              FRANCHISOR                             INCOME FUND                            UNITHOLDERS

                                                                                              BPI                                  BPRIF
                                                                                            (Op Co)                              (Fund Co)

                          Food and beverages                        7.0% of Franchise                  5.5% of Franchise Sales                   Income, less the Fund’s
                           are purchased by                         Sales⁽²⁾ are paid by                in the Royalty Pool are                   expenses and taxes, is
                          guests directly from                         Boston Pizza                   paid by BPI to the Income                   distributed monthly by
                             Boston Pizza                              franchisees                     Fund (less BPI’s 12.9%                  the Fund to Unitholders as
                              franchisees                                 to BPI                         interest in the Fund)⁽²⁾                determined by Trustees

(1) The above explanation is for descriptive purposes only and is qualified in its entirety by the Fund’s agreements as well as its materials filed on SEDAR.
(2) Franchise Sales is the basis upon which Royalty and Distribution income of 5.5% is received by the Fund (5.5% is comprised of 1.5% less BPI’s 12.9% BPI ownership interest plus 4.0%).
    Franchise Sales is calculated as Gross Sales less alcohol sales (liquor, beer and wine) and approved national discounts, excluding applicable taxes.
BOSTON PIZZA ROYALTIES INCOME FUND
                                                                                                                                                                                             7
BOSTON PIZZA INTERNATIONAL INC.
   (Operating Company or BPI)

BOSTON PIZZA ROYALTIES INCOME FUND
                                     8
Long and Proud History of Growth

                                                                                                                                                              2015
                                                                       1990
                           1970 - 83                                The Boston Pizza                                           2013
                                                                                                                                                          BPRIF increases its
                                                                                                                                                         interest in Franchise
                        Jim Treliving and George                     Foundation is                                                                        Sales from 4.0% to
                                                                   established to help                                      Expanded to over
                     Melville become partners in 16                                                                          350 restaurants                    5.5%⁽¹⁾
                     restaurants. In 1983, they sell                  those in need
                     all but one of their restaurants
                        and buy the Boston Pizza
                          franchisor business of
                              44 restaurants
                                                                                                                                                                           2017
                                                                             1994                                    2002                                            As part of an orderly
                                                                                                                Expanded to over 150                               succession plan, Jim and
                                                                     Named one of Canada’s 50                                                                   George reorganized their jointly-
                1964                                                Best Managed Companies in
                                                                                                              restaurants; BPRIF has a
                                                                                                                 successful IPO and                              owned assets, resulting in Jim
            First Boston Pizza                                       1994 (a distinction that has                 begins trading on                                acquiring 100% of Boston
            restaurant opens                                            been awarded each                             the TSX                                       Pizza International Inc.
               in Edmonton,                                              subsequent year)                                                                                 (the Op Co)
                  Alberta

               Over the past 55 years, Boston Pizza has grown into one of Canada’s most beloved institutions

(1) Royalty and Distribution income of 5.5% received by the Fund is comprised of 1.5% less BPI’s 12.9% BPI ownership interest plus 4.0% and it is calculated on a Franchise Sales basis.
BOSTON PIZZA ROYALTIES INCOME FUND
                                                                                                                                                                                                    9
Canada’s #1 Casual Dining Brand

(1) Source: Technomic Top 200 Report (2018). Boston Pizza unit count is at December 31, 2019 and is the total number of restaurants system-wide.
BOSTON PIZZA ROYALTIES INCOME FUND
                                                                                                                                                   10
Strong and Diverse Network with Significant
Opportunity to Grow
Boston Pizza operates in 10
provinces and two territories,
serving more customers in
more restaurants than any
1 other casual dining
restaurant brand
1 in Canada
62
112 4
25
21 32 1
119
5
12
395 restaurants as of December 31, 2019.
BOSTON PIZZA ROYALTIES INCOME FUND
11Pillars of Our Success
Commitment to building the Boston Pizza brand
• A strong and recognizable brand that consumers have grown to trust
• On-going ability to leverage a $26 million annual national marketing budget funded
by franchisees along with proprietary digital marketing and loyalty programs
• Commitment to new prototype restaurants and impactful renovations
Continually improving the guest experience
• A widely appealing restaurant concept that has three distinct dining experiences
(Restaurant, Sports Bar, and Take-Out & Delivery) as well as multiple dayparts that
appeal directly to families and young adults
• A broad and continually evolving menu suitable for any occasion
A commitment to Franchisee profitability
• National purchasing power to help manage input costs for franchisees
• Strong and established network of franchisees who are committed to growth
• Proven management team with extensive restaurant experience
On-going engagement in local communities
• Supporting children and families in need to help create stronger and healthier
communities across Canada
BOSTON PIZZA ROYALTIES INCOME FUND
12System-Wide Gross & Franchise Sales⁽¹⁾
Franchise Sales CAGR (2012 – 2019): 2.2%
(1) Franchise Sales is the basis upon which Royalty and Distribution income of 5.5% is received by the Fund (5.5% is comprised of 1.5% less BPI’s 12.9% BPI ownership
interest plus 4.0%). Franchise Sales is calculated as Gross Sales less alcohol sales (liquor, beer and wine) and approved national discounts, excluding applicable taxes.
BOSTON PIZZA ROYALTIES INCOME FUND
13Same Restaurant Sales Growth
(Franchise Sales Basis)
SRS% - Previous 5 Years⁽¹⁾
SRS% (1.8%)
in Q4 2019
______
Marketing Activity
in Q4 2019:
• Hockey Night in
Canada partnership
• Kids Cards
• Halloween BOGO
• Grey Cup BOGO
• Christmas Pizza
(1) All figures are annual SRS as at December 31
BOSTON PIZZA ROYALTIES INCOME FUND
14Same Restaurant Sales –
Key Growth Initiatives
Product
• New menu launch well-received by franchisees and guests
• Initiatives underway to further elevate food quality and consistency
• Broad-reaching update to core beverage program starting Q1 2020
People
• Renewed focus and investment on recruiting and training staff
• Labour scheduling tools to help optimize service experience for guests
Place
• Delivery channel poised for further growth from the expansion of
existing and new delivery service partnerships starting Q1 2020
• High number of renovations in 2020, all with the new design
Promotion
• Continued optimization of national and local marketing programs,
including new digital marketing initiatives
BOSTON PIZZA ROYALTIES INCOME FUND
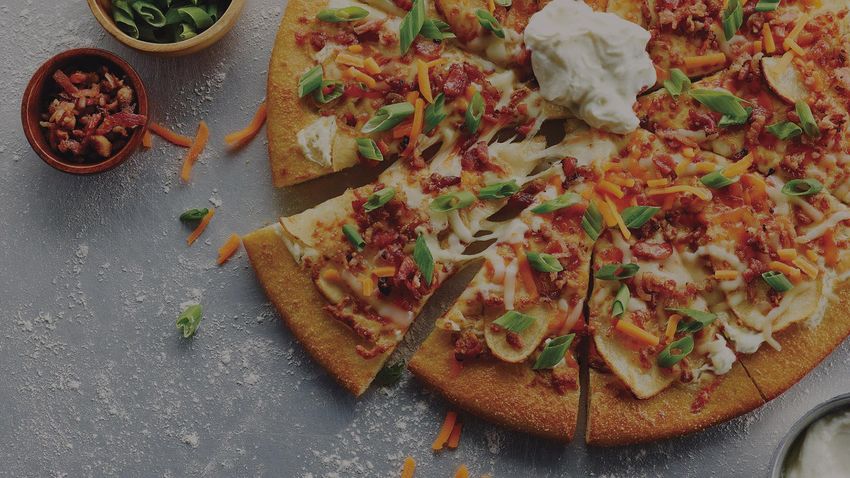
15Menu Innovation
Expertise in food innovation displayed in latest menu which was significantly
updated in the back half of 2019 to favourable reviews
• Cactus Cut Potatoes
• Kick’n Onion Rings
• Mad Mac Pizza
• Pizza Poutine
• Tropic Thunder
• Honey Dill Chicken Bowl
• Most Valuable Burger (MVB)®
• Big Dipper sandwich
• Cauliflower Crust
• Thin Crust Pizza
MVB is a registered trademark of Boston Pizza International Inc., used under license.
BOSTON PIZZA ROYALTIES INCOME FUND
16Promotional Efforts
Finding innovative ways to optimize a sizable and flexible national marketing
budget to drive guest visitation across all dayparts and channels
BOSTON PIZZA ROYALTIES INCOME FUND
17Digital Platforms Enabling
Business Growth
Online Ordering
• New ordering platform (web and app) launching in 2020
• Focused on driving conversion rates and average cheque size
MyBP Loyalty Program
• Over 1.3 million MyBP members (and growing)
• Increased offer activity expected in 2020 to drive member
acquisition and transactions (in-restaurant and online)
Third Party Delivery Service Partnerships
• Continued expansion with all major players (SkipTheDishes,
DoorDash, Uber Eats, and Foodora)
• Integration opportunities to streamline operational execution
BOSTON PIZZA ROYALTIES INCOME FUND
18Renovated to Contemporary Look Every 7 Years
Exterior Dining Room Sports Bar
Before Before Before
Exterior Dining Room Sports Bar
After After After
70% of total Boston Pizza restaurants are either new or have been renovated within the previous 5 years⁽¹⁾
(1) As at December 31, 2019
BOSTON PIZZA ROYALTIES INCOME FUND
19Net New Restaurants Driving Growth
Boston Pizza’s in-house development team is focused on opening new
restaurants and repositioning existing restaurants for long-term success
(1) As at December 31.
(2) On January 1 of each year, the Fund’s Royalty Pool is updated for all restaurants that opened and closed in the prior calendar year.
(3) There were 395 restaurants as at December 31, 2019 and there are 395 restaurants in the Fund’s Royalty Pool for 2020.
BOSTON PIZZA ROYALTIES INCOME FUND
20New Restaurant
Development
White-space growth opportunities
• Quebec and Ontario targeted as growth markets
• Market capacity for 500+ total restaurants in Canada
Multi-channel growth opportunities
• Prototype models can be adapted to opportunity
• Conversions
• Non-traditional
Existing network of growth-ready franchisees
Proven expertise in real estate matters
Gravenhurst Wharf,
BOSTON PIZZA ROYALTIES INCOME FUND Muskoka Region, Ont.
21Rolling out New Design Across Canada
Front & John St., Toronto Medicine Hat, Alberta
Front & John St., Toronto Medicine Hat, Alberta
BOSTON PIZZA ROYALTIES INCOME FUND
22BOSTON PIZZA ROYALTIES INCOME
FUND (The Fund or BPRIF)
BOSTON PIZZA ROYALTIES INCOME FUND
23Recent Investment Highlights
• The Fund’s Payout Ratio for 2019 was 104.8% and its Dividend Yield was 10.3%⁽¹⁾
• The recent reduction to the Fund’s distribution level helps ensure the Fund
continues to maintain a strong financial position and Payout Ratio $1.1 billion
System-Wide Gross
• As a result of the recent distribution reduction, the Fund is in a better position with Sales in 2019
respect to its ability to sustain future distributions
93.4%
• At the new monthly distribution level of 10.2 cents per unit, the Fund’s Payout Ratio
is 93.4% on a pro-forma basis for 2019⁽²⁾ Payout Ratio
on a pro-forma basis at the
• Based on a unit price of $13.46 as at December 31, 2019, the Fund has an current distribution level ⁽²⁾
attractive pro-forma dividend yield of 9.1%⁽³⁾
• The Fund is prepared to be active with a Normal Course Issuer Bid in the periods 9.1%
ahead, enabled by an expanded credit facility that the Fund entered into on January Dividend Yield
24, 2020 (total borrowing capacity was increased by approximately $6.7 million) on a pro-forma basis at the
current distribution level ⁽³⁾
• Strong alignment of interests exists between the Operating Company and the Fund
plus a proven Management Team is in place with a track record of success
(1) Based on a unit price of $13.46 as at December 31, 2019 and actual annual distribution level of $1.380 per unit (11.5 cents per month)
(2) On February 12, 2020, the Trustees declared a distribution for January 2020 of $0.102 per unit. If the Fund had paid $1.224 per unit ($0.102
per month) in respect of 2019 instead of the $1.38 per unit that it did pay, the Payout Ratio would have been 93.4% rather than 104.8%.
(3) Based on a unit price of $13.46 as at December 31, 2019 and a new annual distribution level of $1.224 per unit (10.2 cents per month)
BOSTON PIZZA ROYALTIES INCOME FUND
24Annual Distributions & Payout Ratio
On a forward looking basis, the Fund is in a strong financial position and
poised to continue its long history of sustainable distributions
(1) Pro-forma annualized distributions of $1.224 per unit reflects new monthly distribution of 10.2 cents per unit
(2) Pro-forma results are full year, actual results as at December 31, 2019 adjusted to reflect a new monthly distribution level of 10.2 cents per unit for the January 2020 distribution paid February 28, 2020
BOSTON PIZZA ROYALTIES INCOME FUND
25Business Outlook
Boston Pizza is committed to driving long-term Unitholder value in the face of
the current challenging economic environment
Continue to strengthen position as • Optimizing marketing budgets and programs to enable
Canadian’s number one casual continuous evolution of the business, further entrenching
dining brand Boston Pizza as Canada’s casual dining brand of choice
Continuously refresh restaurant • Pursuing new restaurant development opportunities while
portfolio by leveraging in-house also executing on standard 7-year renovation program with
development and design expertise contemporary design elements
Renewed focus on menu • Initiatives underway to elevate food quality and consistency
innovation, menu quality and as well as the core beverage program
consistent execution • Investment on recruiting and training staff
Continued expansion of in-house • New digital ordering platform launching in 2020
Boston Pizza and third party • Growing third party delivery service partnerships to capitalize
off-premise businesses on changing consumer preferences
BOSTON PIZZA ROYALTIES INCOME FUND
26APPENDIX
BOSTON PIZZA ROYALTIES INCOME FUND
27Quarterly Financial Performance
$ thousands except per Unit data, Payout Ratio, SRS and restaurant count
2019 Q4 2018 Q4
NUMBER OF RESTAURANTS IN ROYALTY POOL⁽¹⁾ 396 391
FRANCHISE SALES BY ROYALTY POOL RESTAURANTS 211,173 211,350
ROYALTY INCOME 8,447 8,454
DISTRIBUTION INCOME 2,785 2,823
INTEREST INCOME 9 9
TOTAL REVENUE 11,241 11,286
DISTRIBUTABLE CASH⁽²⁾ 6,961 7,266
DISTRIBUTABLE CASH PER UNIT 0.319 0.332
DISTRIBUTIONS PAID PER UNIT 0.345 0.345
PAYOUT RATIO 108.0% 103.8%
SAME RESTAURANT SALES ⁽³⁾ (1.8%) 0.1%
(1) The Fund reports changes to the number of Royalty Pool restaurants each year on January 1 as part of the new restaurant roll-in process
(2) For a reconciliation to the nearest IFRS measure, Cash Flows from Operating Activities, please see the Fund’s MD&A for Q4 2019
(3) SRS% is on a Franchise Sales basis. For SRS% on a Gross Sales basis, please refer to the Fund’s MD&A filed on SEDAR
BOSTON PIZZA ROYALTIES INCOME FUND
28Full-Year Financial Performance
$ thousands except per Unit data, Payout Ratio, SRS and restaurant count 2019 2018
NUMBER OF RESTAURANTS IN ROYALTY POOL⁽¹⁾ 396 391
FRANCHISE SALES BY ROYALTY POOL RESTAURANTS 853,728 855,108
ROYALTY INCOME 34,149 34,204
DISTRIBUTION INCOME 11,246 11,407
INTEREST INCOME 40 33
TOTAL REVENUE 45,435 45,644
DISTRIBUTABLE CASH⁽²⁾ 28,700 29,240
DISTRIBUTABLE CASH PER UNIT 1.317 1.336
DISTRIBUTIONS PAID PER UNIT 1.380 1.380
PAYOUT RATIO 104.8% 103.3%
SAME RESTAURANT SALES ⁽³⁾ (1.5%) (0.3%)
(1) The Fund reports changes to the number of Royalty Pool restaurants each year on January 1 as part of the new restaurant roll-in process
(2) For a reconciliation to the nearest IFRS measure, Cash Flows from Operating Activities, please see the Fund’s MD&A for Q4 2019
(3) SRS% is on a Franchise Sales basis. For SRS% on a Gross Sales basis, please refer to the Fund’s MD&A filed on SEDAR
BOSTON PIZZA ROYALTIES INCOME FUND
29Boston Pizza Foundation
Future Prospects (BPFFP)
• Commitment to giving back in communities
where we operate Boston Pizza restaurants.
• Boston Pizza Foundation has raised and
donated over $30 million to various Canadian
charities since 1990.
• Signature cause of BPFFP is role-modeling and
mentoring opportunities for Canadian youth.
Boston Pizza Foundation is a registered trademark of Boston Pizza Royalties Limited Partnership, used under license.
Future Prospects silhouette design is a registered trademark of Boston Pizza Foundation.
BOSTON PIZZA ROYALTIES INCOME FUND
30Awards Proudly Received
by Boston Pizza
Great Place to Work
• Best Workplaces in Canada (2017-2019)
Order of Canada 2019: Jim Treliving
Franchisees’ Choice Designation
• Canadian Franchise Association (2011-2018)
Canada’s 50 Best Managed Companies Platinum Club
• Deloitte (2004-2019)
Lifetime Achievement Award: Jim Treliving
• Canadian Franchise Association (2012)
Tops in Hospitality
• Foodservice and Hospitality Magazine (2007-2012)
Gold CASSIES Marketing Awards (2011, 2014, 2015)
BOSTON PIZZA ROYALTIES INCOME FUND
31Experienced Board & Management Team
BPRIF Board of Trustees BPI Management Team
Marc Guay, Chair of Board Jim Treliving, Chairman & Owner
Mr. Guay retired from PepsiCo Foods Canada Inc. in 2015 Mr. Treliving is a Director, Officer and Owner (through his
after a career spanning 29 years. From 2008 until his holding company) of Boston Pizza International Inc. (BPI)
retirement in 2015, he was the President of PepsiCo Foods and Boston Pizza Canada Holdings Inc. Mr. Treliving has
Canada Inc. Mr. Guay served on the board of Food Banks been a Chairman of BPI since 2004 and previously held
Canada from 2010 to 2019 and currently serves on the other senior roles in BPI including President and Chief
board of Metro Inc. Executive Officer.
Paulina Hiebert, Chair of Governance Committee Jordan Holm, President
Ms. Hiebert was the VP Legal and Corporate Secretary of Mr. Holm joined BPI in 2006 and was appointed President
The North West Company Inc. from 2009 to 2017. Prior to of BPI in November of 2017. In his capacity as President,
that, she was the VP Legal and Corporate Secretary for Mr. Holm oversees all aspects of the business including
The Brick Group Income Fund. Ms. Hiebert currently marketing, development, operations and strategic
serves as the Vice Chair of the board of Credit Union planning.
Deposit Guarantee Corporation (Alberta).
David L. Merrell, Chair of Audit Committee Michael Harbinson, CFO
Mr. Merrell joined what is now Grant Thornton LLP in 1978 Mr. Harbinson joined BPI as Chief Financial Officer (CFO)
and specialized in taxation for 16 years with the balance of in May 2019. As CFO, Mr. Harbinson oversees the
his career dedicated to general audit, accounting and finance, accounting, risk management, treasury and
financial practice. In 2006, Mr. Merrell was elected as a investor relations departments for both BPI and Boston
Fellow of the Institute of Chartered Accountants (FCA) in Pizza, GP Inc., the managing general partner of the
British Columbia. Boston Pizza Royalties Income Fund.
BOSTON PIZZA ROYALTIES INCOME FUND
32Roll-In Calculation – Summarized⁽¹⁾
• BPI receives Additional Entitlements of Fund units on January 1 of each year
based on the restaurants that opened and closed in the prior calendar year
• To determine the Additional Entitlements received by BPI for the roll-in, estimated
Franchise Sales of opened restaurants are netted against Franchise Sales of closed
restaurants (based on year the closed restaurant was added to the Royalty Pool). BPI BPRIF
The net Franchise Sales are then adjusted for: (Op Co) (Fund Co)
• Royalty and Distribution Income rate of 5.5% (starting in 2016, 4.0% prior to that)
• Discounted by 7.5% to help ensure roll-in is accretive to Unitholders
• Reduced by the effective SIFT tax rate
BPI receives units of the
• Divided by the actual distributions paid per Fund unit in the prior year Fund in exchange for rolling
net new Franchise Sales into
• 80% of the additional entitlements are issued immediately and 20% are held back
the Fund’s Royalty Pool (the
until the actual Franchise Sales and effective SIFT tax rate are known Royalty Pool upon which the
• Estimated Franchise Sales and effective SIFT tax rate are then adjusted early in Fund receives its 5.5%
Royalty and Distribution
the following year when actuals are known
Income)
• BPI is entitled to receive monthly distributions on the additional entitlements
including the holdback
(1) The foregoing is intended only to be a high-level summary and is qualified in its entirety by reference to the full text of the agreements governing these
adjustments. See the section titled “Annual Adjustment to Royalty Pool” in the Fund’s Annual Information Form dated February 12, 2020 for additional information.
BOSTON PIZZA ROYALTIES INCOME FUND
33Roll-In Calculation – 5-Year History
Calendar year opened/closed 2015 2016 2017 2018 2019
Actual Actual Actual Actual Estimate
Roll-in date 01-Jan-16 01-Jan-17 01-Jan-18 01-Jan-19 01-Jan-20
Openings 12 13 11 10 5
Closures (6) (2) (3) (5) (6)
Net restaurants added 6 11 8 5 (1)
Franchise sales for restaurants opened (in $000s) 23,416 21,112 18,160 17,741 7,875 BPI BPRIF
Franchise sales for restaurants closed (in $000s) (7,699) (1,415) (5,476) (6,855) (6,281)
(Op Co) (Fund Co)
Net franchise sales added (in $000s) 15,717 19,697 12,684 10,886 1,594
Royalty and Distribution Income rate 5.5% 5.5% 5.5% 5.5% 5.5%
Royalty and Distribution Income before adjustments (in $000s) 864 1,083 698 599 88
Discounted by 7.5% (in $000s) (65) (81) (52) (45) (7)
800 1,002 646 554 81
The 7.5% discount in the
Effective tax rate 21.1% 21.4% 22.4% 22.3% 24.0%
Effective tax amount (in $000s) (169) (214) (145) (123) (19) roll-in calculation exists so
that the act of rolling net
Amount used to calculate Additional Entitlements (in $000s) 631 788 502 430 62
new restaurants into the
Distributions paid per unit in year opened/closed (in $) 1.281 1.373 1.380 1.380 1.380 Fund is likely to be
accretive to existing
Additional Entitlements received - 80% (in 000s) 394 459 290 249 36
Holdback - 20% (in 000s) 99 115 73 62 9
Unitholders
Total Additional Entitlements with Holdback (in 000s) 493 574 363 312 45
Class B Additional Entitlements with Holdback (in 000s) 358 417 264 227 32
Class 2 Additional Entitlements with Holdback (in 000s) 134 156 99 85 12
(1) The franchise sales and effective SIFT tax rate for the roll-ins on Jan. 1 of 2016/17/18/19
BOSTON PIZZA ROYALTIES INCOME FUND are actuals; (Jan. 1/20 is estimated and will be adjusted to actual in early 2021)
34THANK YOU Investor contact: investorrelations@bostonpizza.com | www.bpincomefund.com BOSTON PIZZA ROYALTIES INCOME FUND
You can also read