FULL YEAR 2020 RESULTS AND OUTLOOK - 25 FEBRUARY 2021 - Arkema.com
←
→
Page content transcription
If your browser does not render page correctly, please read the page content below
FULL YEAR 2020 RESULTS
AND OUTLOOK

25 FEBRUARY 2021

2020, A YEAR OF STRONG EXECUTION
IN A CHALLENGING GLOBAL CONTEXT
SOLID PERFORMANCE IN 2020 AND VOLUME RECOVERY IN Q4

                             Sales                                                                 Q4’20
                                                                       EBITDA
                                                                                              Volume +5.2% YoY
                            €7.9bn                                    €1.18bn                      EBITDA
                 Volume (4.3)% YoY                                    15% margin                broadly stable
                                                                                                    YoY

                                                 Adjusted                             FCF                        Net debt
                                                net income
                                                                                    €651m                        €1.91bn
                                                     €391m                          67% cash                     1.6x EBITDA
                                                  5.11 €/share                     conversion 1

         2020     Q4’20
       figures    figures

    1. Free cash flow excluding exceptional capex divided by EBITDA

3                FY 2020 RESULTS AND OUTLOOK / 25 FEBRUARY 2021
WE MANAGED THE SHORT TERM AND EXECUTED THE STRATEGY

                           Resilience of our              Promising pipeline of
                           Specialty Materials            innovation on megatrends

                           Major steps on the             High return investments
                           transformation journey         to capture future growth

                           Commitment to sustainability   Focus on operational and
                           and improved CSR ratings       commercial excellence

4    FY 2020 RESULTS AND OUTLOOK / 25 FEBRUARY 2021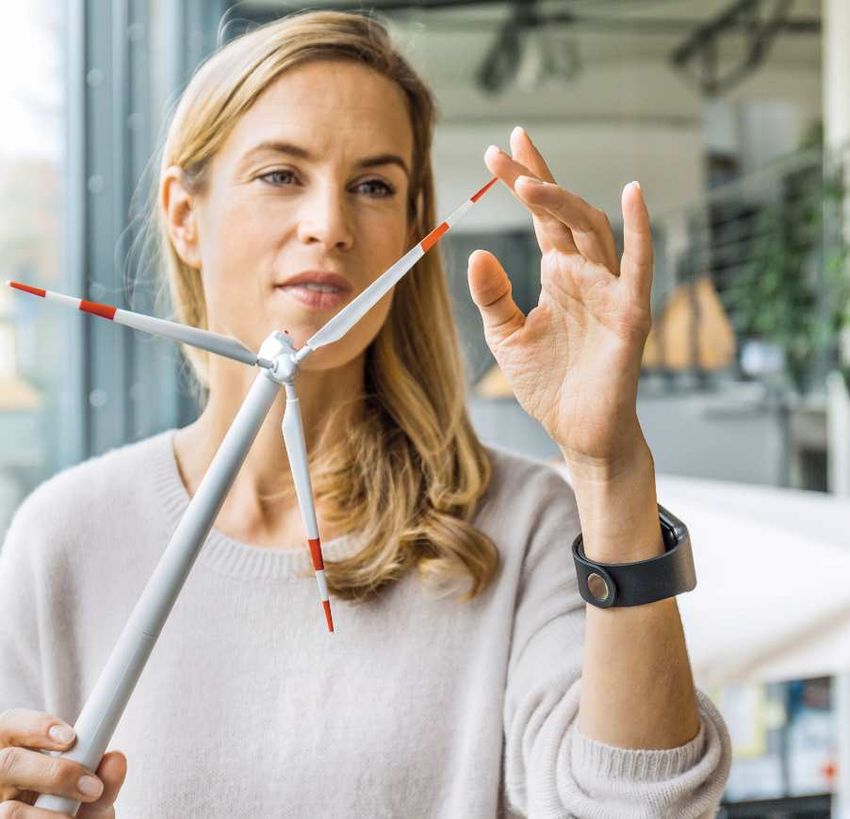
SPECIALTY MATERIALS WERE RESILIENT IN THE CONTEXT

                              Segments’ EBITDA margin evolution (%)                                                                             Resilient Specialty
                                                                                                                                                Materials EBITDA
                                                                                                                                                         EBITDA* (€m)
        25%

                                                                                                                                                             -39%
        20%                                                                                                                                       381

                                                                                                                                Intermediates
                                                                                                                                                              -12%        231
        15%                                                                                                                     Specialty
                                                                                                                                Materials

        10%
                                                       Bostik                                                                                    1,158
                                                     acquisition                                                                                                         1,018
          5%

                 2012         2013          2014         2015         2016        2017         2018        2019        2020                       2019                    2020

                       Adhesive Solutions           Coating Solutions                                                                                    Specialty Materials
                                                                               Advanced Materials                Intermediates
                                                                                                                                                         Intermediates
                                                   Total Specialty Materials1 platform

    1. Specialty Materials include the three following segments: Adhesive Solutions, Advanced Materials and Coating Solutions                   * excluding Corporate

5              FY 2020 RESULTS AND OUTLOOK / 25 FEBRUARY 2021
MAJOR NEW STEPS TAKEN ON TRANSFORMATION JOURNEY

                                                                Sales split                                                          A major milestone
                                                          Specialty Materials
                                                                                                                                         PMMA disposal to Trinseo 1
                                                          79%         82% 89% pro forma 2020*                                            EV: €1,137m

                                                                                                       32%
                          31%                                                                                                        Other M&A operations
                                                    24%
                                                                                                                       24,5%
                                                                                                                                         Functional Polyolefins
                                 €8.7bn                                                                  €7.9bn                          disposal to SK Chemical
                                                                                                                                         EV: €335m
                         24%                                                                   25,5%
                                               21%                                                                  18%                 LIP, Fixatti & Ideal Work
                                                                                                                                        acquisitions in Adhesive
                                                                                                                                        Solutions
                                   2019                                                                      2020                        CPS acquisition in Coating
                                                                                                                                         Solutions
            Adhesive Solutions                  Advanced Materials                    Coating Solutions              Intermediates
                                                                                                                                     1. The proposed disposal is subject to the approval of the relevant
                                                                                                                                     antitrust authorities and to an information and consultation process
                                                                                                                                     involving Arkema’s employee representative bodies.
    * On a pro forma basis, including full year contribution of all M&A operations announced in 2020

6             FY 2020 RESULTS AND OUTLOOK / 25 FEBRUARY 2021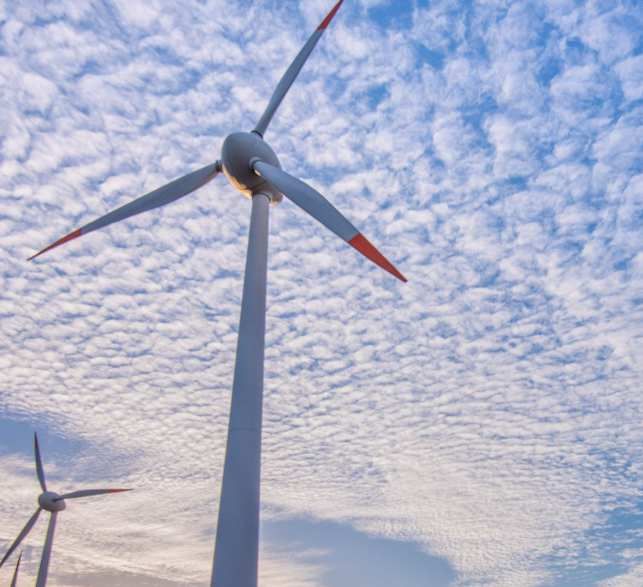
COMMITMENT TO SUSTAINABILITY REINFORCED
CLIMATE AND ENVIRONMENT 1 CIRCULAR ECONOMY
GHG Energy VOC COD PRAGATI
Phase II of the
-23% -38% -10% -20% -42% -65% -55% -60% world’s 1st sustainable
castor bean program
2015 2019 2020 2030 2012 2019 2020 2030 2012 2019 2020 2030 2012 2019 2020 2030
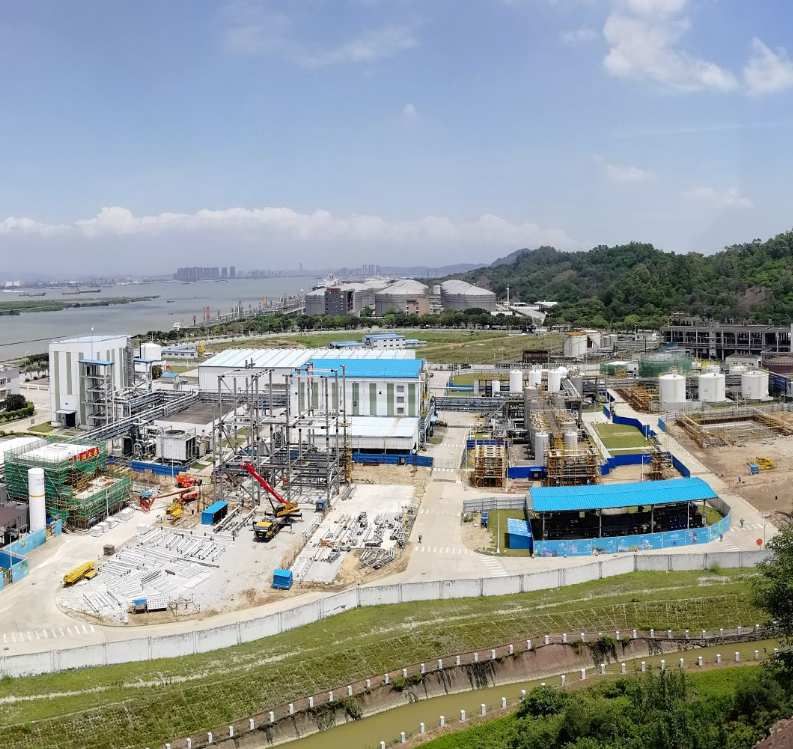
1ST EVER GREEN BOND
€300m dedicated to
NEW 2030 OBJECTIVES FOR DIVERSITY new plant in Singapore for
100% bio-based PA 11
in senior management
Women and executive positions Non-French
30% 50%
23% 23-25% 41% 42-45%
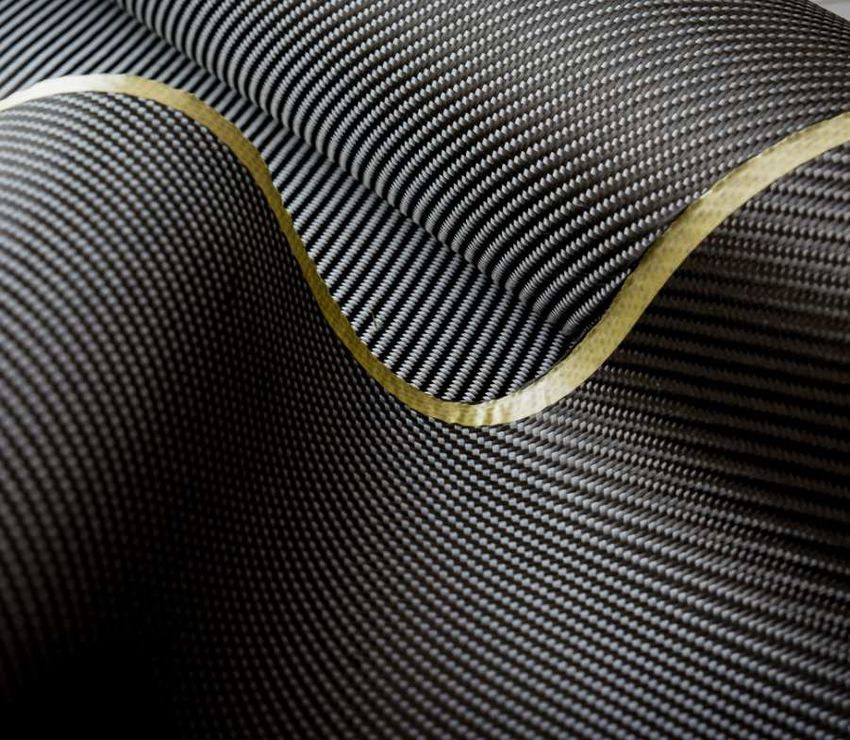
ZEBRA PROJECT
First 100% recyclable
2018 2019 2020 2025 2030 2018 2019 2020 2025 2030 wind turbine blades
1. Absolute target vs 2015 for GHG (greenhouse gases) , EFPI vs 2012 for Energy, VOC (volatile organic compounds) and COD (chemical oxygen demand)
7 FY 2020 RESULTS AND OUTLOOK / 25 FEBRUARY 2021
STRONG IMPROVEMENT IN CSR RECOGNITION
                                                      2015   2019               2020
                                                                                            The Sustainability Yearbook 2021
                                                       42     65                     79     BRONZE AWARD

                                                                                  Based     6th in DJSI World
                                                                                 on SAM
                                                                                            First integration in 2020

                                                       BB     A                      A

                      (Climate)                        C      B                      A-

                                                                                Top 1%

           Other ratings                                       1st decile (global)            Europe120 &
                                                                    June 2020             Eurozone 120 indices

8    FY 2020 RESULTS AND OUTLOOK / 25 FEBRUARY 2021
INVESTMENTS TO CAPTURE SUSTAINABLE GROWTH CARRIED ON
                                                                         PVDF
                                     Polyamide 12                                                      PVDF         NEW
                                                                 +50% capacity
                                +25% global capacity               for batteries                       +35%
                                    in Changshu, CN           in Changshu, CN                          Changshu
                                                                                                       capacity

                                                                                   2020                       2022        €600m recurring and
                                                                                                                          exceptional CAPEX
                                                                                                                          in 2020

                                                       2020
             2022                                                                          2020
                                                                                                                          2 major high return
                                                                                           Industrial adhesives           projects driven by
                                                   2020                                                                   sustainability broke
                                                                                               World-scale plant
                                                                                                      in Nara, JP
                                                                                                                          ground in 2020
                                                                              2022
                                                                                                                          CAPEX > €500m by 2024
    Fluorine chemistry
                                                                                                                          bio-sourced PA11
    Innovative partnership with                                                                                           energy efficient HF supply
    NUTRIEN for the supply of AHF
    in Aurora, US (40 kt/yr)                                                              Polyamide 11
                                          Thiochemicals
                                                                                          +50% global capacity
                                     x2 methyl mercaptan                                  (including monomers)
                                    capacity in Kerteh, MY                                in Singapore

9         FY 2020 RESULTS AND OUTLOOK / 25 FEBRUARY 2021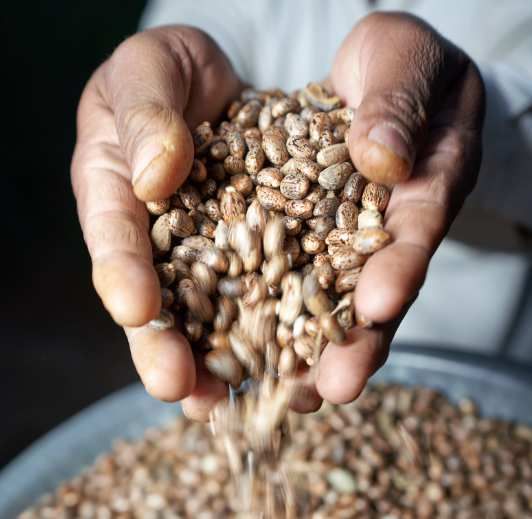
STRONG ENGAGEMENT OF OUR TEAMS

                            Quick implementation of safeguard measures
                            in the Covid environment
                                                                                     RECORD LOW INJURY RATE
                                To ensure safety of our employees
                                                                                   1.6
                                 To enable continuity of operations                                       1.4
                                 and support our customers and stakeholders                 1.3

                                                                                                                     1.0
                                 To adjust by more than €100m our
                                 operational expenses versus initial budget

                            Responsible and supportive
                            measures undertaken
                                                                                   2017    2018           2019       2020
                                 Decided not to use the French government’s
                                 assistance measures or furlough schemes                           TRIR
                                                                                           Number of accidents
                                                                                          per million hours worked
                                 Hand sanitizer to hospitals free of charge
                                 Donations from executive committee and managers

10    FY 2020 RESULTS AND OUTLOOK / 25 FEBRUARY 2021
DYNAMIC CASH ALLOCATION IN LINE WITH CMD GUIDELINES
Dividend proposal back at pre-Covid level
€2.50 per share 1 DIVIDEND (in €/share)
per financial year 2
In line with Group’s ambition to progressively increase shareholder return
Confidence in the development perspectives of the Group
Share buybacks starting in 2021
€300m program starting right after the closing of PMMA disposal 2.30 2.50 2.50
2.05 2.20
1.90
In line with Group’s capital allocation policy presented at CMD
1
These provisions include the restitution to shareholders of the €0.50 per share portion 2015 2016 2017 2018 2019 2020
of the dividend which had been retained in 2020 in the context of the pandemic
1. Dividend proposed at the shareholders’ annual general meeting of 20 May 2021
2. The dividend of each financial year is paid the following year
11 FY 2020 RESULTS AND OUTLOOK / 25 FEBRUARY 2021FY 2020 RESULTS
KEY TAKEAWAYS
Sales decrease of 8.1% vs FY’19 at constant currency
Back to growth in Q4’20:
€7,884m sales • Sales growth of 2.1% at constant scope and currency
• Significant volumes improvement (+5.2% YoY) with continued positive
momentum in construction, decorative paints and batteries, as well as
recovery in several industrial markets
Good resilience of Specialty Materials
€1,182m EBITDA Rebound in the fourth quarter:
• EBITDA broadly stable, reaching €289m (€295m in Q4'19)
15.0% EBITDA margin
• Strong growth in EBITDA of Adhesive Solutions (+15%) and Coating Solutions (+19%)
€391m adj. net income €5.11 adjusted EPS
High level, reflecting the excellent management of working capital
€651m free cash flow (11.8% of sales at end 2020) and strict control of capex (-€100m vs initial budget)
67% cash conversion 1
€1,910m Net debt 1.6x EBITDA 2020
(incl. hybrid bonds)
1. Free cash flow excluding €140m exceptional capex divided by EBITDA
13 FY 2020 RESULTS AND OUTLOOK / 25 FEBRUARY 2021STANDING OUR GROUND IN AN EXCEPTIONAL YEAR
Sales in €m
-4.3%
-4.7%
-1.7% +0.9%
Lower demand in Lower propylene Depreciation of US Functional Polyolefins
transportation, prices in Coating dollar and certain divestment on 1 June
general industry Solutions emerging currencies 2020
and oil & gas against the euro,
Challenging market particularly in H2’20 Positive contribution
Rebound in conditions in of 2020 bolt-on
8,738 construction, DIY Intermediates, acquisitions in
and decorative particularly Fluorogases Adhesives, as well as
paints in H2’20 ArrMaz in H1’20 7,884
Resilience in other
Industrial markets Specialty Materials
starting to improve businesses
in Q4’20
Strong growth in
batteries
2019 Volumes Prices Currency Scope 2020
14 FY 2020 RESULTS AND OUTLOOK / 25 FEBRUARY 2021VOLUME GROWTH RETURNED IN Q4 2020
Sales in €m
+5.2% -3.1%
-4.1%
-1.3%
Positive momentum +2% in Adhesive Further depreciation Functional
in construction and Solutions of US dollar and Polyolefins
decorative paints certain emerging divestment on
Resilience in currencies against 1 June 2020
Growth in batteries Advanced Materials the euro
Positive contribution
Improvement Impact of lower of bolt-on
in automotive propylene prices in acquisitions
Coating Solutions
2,053 Industrial markets
gaining momentum Continued challenging 1,985
market conditions in
Fluorogases
Q4’19 Volumes Prices Currency Scope Q4’20
15 FY 2020 RESULTS AND OUTLOOK / 25 FEBRUARY 2021ADHESIVE SOLUTIONS (25.5% OF 2020 GROUP SALES)
Q4’20 KEY FIGURES Q4’20 SALES DEVELOPMENT
In €m Q4’19 Q4’20 Change Volumes +0.7% HIGHLIGHTS
Sales 500 512 +2.4%
Prices +2.0%
● Strong performance in Q4’20 with
EBITDA 60 69 +15.0%
EBITDA up 15% YoY, and EBITDA margin
Currency (4.6)% up 150 bps at 13.5%, a record high
EBITDA margin 12.0% 13.5%
for a 4th quarter
REBIT 45 52 +15.6% Scope +4.3%
● +2.7% YoY organic growth in Q4’20
positive momentum in construction in the continuity
2020 KEY FIGURES 2020 SALES DEVELOPMENT of the 3rd quarter
volume improvement in engineering adhesives
In €m 2019 2020 Change
Volumes (4.1%)
Sales 2,055 1,996 (2.9)% ● Robust performance in 2020, reaching
Prices +0.5% same level as 2019, reflecting unique
EBITDA 264 261 (1.1)%
stability of the segment in challenging
EBITDA margin 12.9% 13.1% Currency (2.4)% conditions, with EBITDA margin
at 13.1%
REBIT 205 198 (3.4)% Scope +3.1%
16 FY 2020 RESULTS AND OUTLOOK / 25 FEBRUARY 2021ADVANCED MATERIALS (32% OF 2020 GROUP SALES)
Q4’20 KEY FIGURES Q4’20 SALES DEVELOPMENT
In €m Q4’19 Q4’20 Change Volumes +1.1% HIGHLIGHTS
Sales 663 644 (2.9)%
Prices (0.3)% ● Q4’20 performance impacted
EBITDA 132 123 (6.8)% mainly by negative currency effect
Currency (3.7)%
EBITDA margin 19.9% 19.1%
● Organic growth improving significantly in Q4’20
at +0.8% YoY (-11.8% YoY in Q3’20)
REBIT 69 57 (17.4)% Scope -
continued positive momentum in batteries
driven by innovation in sustainable growth platforms
2020 KEY FIGURES 2020 SALES DEVELOPMENT (mobility, electronics, lightweight materials)
In €m 2019 2020 Change
Volumes (8.3)%
● Resilient prices in 2020, despite lower volumes
Sales 2,693 2,527 (6.2)%
Prices (0.8)% ● FY’20 EBITDA margin remaining high
EBITDA 584 496 (15.1)% at 19.6%, cost savings and lower raw
Currency (1.5)%
materials mitigating lower volumes
EBITDA margin 21.7% 19.6%
REBIT 353 245 (30.6)% Scope +4.4%
17 FY 2020 RESULTS AND OUTLOOK / 25 FEBRUARY 2021COATING SOLUTIONS (24.5% OF 2020 GROUP SALES)
Q4’20 KEY FIGURES Q4’20 SALES DEVELOPMENT
In €m Q4’19 Q4’20 Change Volumes +14.5%
HIGHLIGHTS
Sales 477 489 +2.5%
Prices (8.4)% ● Significant YoY volume increase
EBITDA 58 69 +19.0% in Q4’20 (+14.5%), driven by the good
Currency (4.9)% momentum in decorative paints, industrial
EBITDA margin 12.2% 14.1% coatings, 3D printing and graphic arts
REBIT 28 39 +39.3% Scope +1.3%
● Strong EBITDA increase in Q4’20 (+19% YoY) and
EBITDA margin reaching 14.1% (+190 bps YoY)
2020 KEY FIGURES 2020 SALES DEVELOPMENT
● Prices negatively impacted in 2020 by the
In €m 2019 2020 Change
Volumes (1.2)% propylene price decrease
Sales 2,148 1,911 (11.0)%
Prices (9.4)% ● FY’20 EBITDA decreasing 15.8% YoY,
EBITDA 310 261 (15.8)% strongly impacted by non integrated
acrylic activities, and EBITDA margin
14.4% Currency (1.7)%
EBITDA margin 13.7% resisting well at 13.7%
REBIT 197 142 (27.9)% Scope +1.3%
18 FY 2020 RESULTS AND OUTLOOK / 25 FEBRUARY 2021INTERMEDIATES (18% OF 2020 GROUP SALES)
Q4’20 KEY FIGURES Q4’20 SALES DEVELOPMENT
In €m Q4’19 Q4’20 Change Volumes +6.3%
HIGHLIGHTS
Sales 408 334 (18.1)%
Prices (7.7)% ● Significant scope effect in Q4’20 sales
EBITDA 59 42 (28.8)% (-13.3% YoY) linked to Functional Polyolefins
disposal
Currency (3.4)%
EBITDA margin 14.5% 12.6%
● Volume increase in Q4’20 (+6.3% YoY)
REBIT 26 12 (53.8)% Scope (13.3)% driven by strong growth in Asia Acrylics
as well as good dynamic in PMMA, and negative
price effect (-7.7%) mainly in Fluorogases
2020 KEY FIGURES 2020 SALES DEVELOPMENT
● EBITDA at €42m, impacted mainly by Fluorogases
In €m 2019 2020 Change
Volumes (2.3)%
Sales 1,816 1,425 (21.5)%
● Sharp decrease of EBITDA in 2020
Prices (10.8)%
EBITDA 381 231 (39.4)% impacted by difficult market conditions
particularly in Fluorogases, and
EBITDA margin 21.0% 16.2% Currency (1.3)% EBITDA margin decreasing at 16.2%
REBIT 261 109 (58.2)% Scope (7.1)%
19 FY 2020 RESULTS AND OUTLOOK / 25 FEBRUARY 2021EXCELLENT CASH GENERATION
RECONCILIATION OF EBITDA TO NET CASH FLOW
EBITDA to cash conversion rate
In €m 2019 2020 Record high at 67%
EBITDA 1,457 1,182
Tax rate
Current taxes (142) (121) 22% of REBIT (excl. exceptional items)
Cost of debt (98) (75)
Change in working capital and fixed assets Tight management of working capital
payables 1
90 212
11.8% of sales at end December
Recurring capital expenditure (511) (460)
Others (including non-recurring items) (33) 53 Non-recurring items
include tax savings linked to the use
Free cash flow excluding exceptional capex 763 791
of tax losses for an amount of €55m in Q2’20
EBITDA to cash conversion rate 2 52% 67%
Exceptional capital expenditure (96) (140) Recurring capex
FREE CASH FLOW 667 651 5.8% of sales, in line with Group’s
5.5% guidance
Impact of portfolio management (729) 6
NET CASH FLOW (62) 657 M&A
Bolt-on acquisitions outflow offset by
1. Excluding non-recurring items and impact of portfolio management
Functional Polyolefins disposal inflow
2. Free cash flow excluding exceptional capex divided by EBITDA
20 FY 2020 RESULTS AND OUTLOOK / 25 FEBRUARY 2021FINANCIAL STRENGTH FULLY MAINTAINED
Financing resources
Net debt under control
1.6x EBITDA including
1,000 hybrid bonds
900
1.5%
700
Successful refinancing
1.5%
500 at attractive rates
400 Average maturity of 5.6 years
0.75%
2.75% 300 300
1.5%
150 0.125%
3.125%
Solid investment grade
2023 2024 2025 2026 2027 2028 2029 rating maintained
BBB+ stable outlook (S&P)
Baa1 stable outlook (Moody’s)
Senior bond Green bond Hybrid bond RCF
21 FY 2020 RESULTS AND OUTLOOK / 25 FEBRUARY 2021NET DEBT EVOLUTION (INCLUDING HYBRID BONDS)
In €m
2,331
1.6x EBITDA
25 3 1,910
196
140 6
(791)
2019 dividend (€168m)
Hybrid coupons (€28m)
Functional Polyolefins
disposal (€242m) offset
by bolt-on acquisitions
31/12/2019
Free cash Exceptional M&A Dividends Share FX and 31/12/2020
flow * capex buyback others
* Excluding exceptional capex
22 FY 2020 RESULTS AND OUTLOOK / 25 FEBRUARY 2021EXECUTION OF OUR SUSTAINABLE STRATEGY AS A KEY PRIORITY
A UNIQUE COMBINATION OF EXPERTISE IN SUSTAINABLE MATERIALS

       A SPECIALTY MATERIALS LEADER

        offering the most innovative
         and sustainable solutions
         to address our customers’
       current and future challenges                   Specialty
                                                       Materials
                                IN 2021

           Mid to high single digit
           organic sales growth
       expected in Specialty Materials

24    FY 2020 RESULTS AND OUTLOOK / 25 FEBRUARY 2021
SUSTAINABLE INNOVATION DRIVING ORGANIC GROWTH
5 R&D PLATFORMS SALES CONTRIBUTION
Thanks to our sustainable innovations,
we expect to generate
NEW €400m new sales by 2024 and €1bn by 2030
PORTFOLIO SUSTAINABILITY ASSESSMENT
Lightweight
materials
New energies NEW Target
65% of our sales contributing significantly
to the UN Sustainability Development Goals by 2030
Natural resources Currently at 50% on 72% of sales assessed
management
BIO-SOURCED OR RECYCLABLE SOLUTIONS
CIRCULAR ECONOMY
Electronic Home efficiency NEW COMMITTEE AT BOARD LEVEL
WATER MANAGEMENT solutions & insulation
Creation of a new Innovation &
Sustainable Growth committee
25 FY 2020 RESULTS AND OUTLOOK / 25 FEBRUARY 20212021 GROWTH PRIORITIES IN ADHESIVE SOLUTIONS
High value offering through launch of new product ranges and technology differentiation
Construction Industrial adhesives
DIY Wall & flooring Sealants Engineering
Hygiene Films & powders
New products "One floor" New PU range adhesives
Purefix Born2Bond™™ Brilliance™ Prochimir, Fixatti
Benefit from recent acquisitions Deliver growth through new capacities
LIP, Danish leader in tile adhesives,
waterproofing systems & floor
preparation World-scale industrial adhesives
plant in Nara (Japan)
Fixatti, producer of high-performance
thermobonding adhesive powders New MS sealant capacity
expansion in Giessen
Ideal Work, specialized in high-added (Netherlands)
value decorative flooring technologies
26 FY 2020 RESULTS AND OUTLOOK / 25 FEBRUARY 2021BOSTIK ON TRACK TO DELIVER ITS MID-TERM TARGET
16%
14%
13.1%
Reach 14% EBITDA margin
12.9% in 2021
10.3%
Three balanced drivers
Grow high margin solutions
264 261 Strengthen operational excellence
158 Roll out acquisition strategy
and implement synergies
2014 2019 2020 2021 2024
EBITDA EBITDA margin
27 FY 2020 RESULTS AND OUTLOOK / 25 FEBRUARY 20212021 GROWTH PRIORITIES IN ADVANCED MATERIALS
Develop new business through innovative and sustainable products Benefit from diversified end-markets recovery
5% General industry
High growth in clean mobility 5%
Specialty polyamides for fuel lines & EV/HEV cooling circuits Nutrition & Water
9%
Kynar® PVDF in batteries 38% Electronics & Energy
Composites for highly pressurized hydrogen tanks & Rilsan® PA11 for liners 12% Consumer Goods
Transportation
15% Paint & Coatings
Disruptive innovation in the sports market 16%
Building & Construction
Pebax® foam for light and high energy return sports shoes outsoles
Fully recyclable sports shoes 2020 data
Capitalize on new 2020 capacities and M&A
Increased demand for bio-based products
Specialty polyamides for bio-based glasses and toys +50% PVDF battery grades capacity in China
Carelflex® services and DMDS in biofuels
Sensio® bio-based surfactants for detergents NEW +35% PVDF capacity in China by 2022
+25% PA12 global capacity in China
Strong use of 3D printing technology in healthcare x2 capacity of methyl mercaptan in Malaysia
High performance polymers for orthotics, swabs, orthopedic soles…
Commercial synergies and growth linked to integration
of ArrMaz
28 FY 2020 RESULTS AND OUTLOOK / 25 FEBRUARY 2021VERY SIGNIFICANT POTENTIAL IN BATTERIES
Innovative solutions to optimize performance of Li-ion batteries
Lithium-ion batteries market
A leader in PVDF for Li-ion battery cells Battery pack weight
reduction and heat transfer
Foranext® electrolyte salts
Anode - Cathode +
Electric vehicles
Rilsan® PA11 for bus bar
30+% CAGR protection and cooling lines
2019-2024 1 Elium® recyclable
Graphistrength®
conductive
composite and
additive carbon Rilsan® PA11 for casing
nanotubes Bostik thermal conductive
Kynar® PVDF
adhesives
Kynar®
coated PVDF
separator binder
Other applications
Well positioned to capture growth
New capacities in China Continued Innovation
New Battery Lab New electrolyte salts
Consumer eBikes Energy Strong partnerships (EU Commission battery project)
in Pierre-Bénite, France
electronics Storage Systems with major players for next generations
CATL, ATL, Saft…
1. Market growth for battery electric vehicles - McKinsey center for Future of Mobility
29 FY 2020 RESULTS AND OUTLOOK / 25 FEBRUARY 2021HIGH RETURN PA11 PLANT IN SINGAPORE TO SUPPORT GROWTH FROM 2022
Polyamide 11, a unique material +50% capacity in Asia
100% bio-based, from castor oil World scale PA11 plant in Singapore (including
monomer) and downstream capacities in China
High performance (mechanical and heat resistance)
Start-up expected in 2022
€450m CAPEX and €100m EBITDA at maturity
LIGHTWEIGHT RENEWABLE RECYCLABLE HIGHLY DURABLE Successfull issuance of our first green bond for €300m
Diversified end-markets with high growth potential
Sports 3D Printing Clean Mobility Consumer Products Consumer Electronics Bio-based textile
30 FY 2020 RESULTS AND OUTLOOK / 25 FEBRUARY 20212021 GROWTH PRIORITIES IN COATING SOLUTIONS
Capture end-market growth Further commercial excellence initiatives
Focus on innovation with low-VOC, Global key account management improvements
bio-based products and high value-added resins
Synaqua® waterborne resins for paints
Optimizing sales function organization
Sarbio® monomer and oligomer range made from renewable
raw materials for applications in a wide range of markets Increased customer focus and cross-selling
Decorative paints and industrial coatings
Ramp-up new capacities in fast growing regions
Enlarged product offering driven by sustainability
+30% Sartomer photocure resins in China,
started in April 2019
(3D printing and electronics)
3D printing Further expansion being considered
Sartomer’s N3xtDimension® custom UV-curable liquid resins
Capitalize on recent bolt-ons Low-VOC powder coating resins plant
in India, started in February 2019
(industrial and architectural coatings)
Electronics & 5G
90 kt Clear Lake acrylic acid reactor in the
Sartomer specialty resins for high definition Printed Circuit Board, US, started in October 2019
meeting the challenges of new 5G mobile technology (paints, water treatment, adhesives…)
31 FY 2020 RESULTS AND OUTLOOK / 25 FEBRUARY 2021STRENGTHENED INTEGRATION OF THE COATING SOLUTIONS SEGMENT
GROWTH
Activities organized for a globally coherent approach towards markets
Acrylic Coating Coating
monomers Resins Additives
PERFORMANCE Additives
Support functions Acrylic Acid Resins
organized for scale
& efficiency UV Specialties
Cross-BUs: Key account management, integrated global supply chain, HR, R&D,
marketing & development
32 FY 2020 RESULTS AND OUTLOOK / 25 FEBRUARY 2021STRATEGIC REVIEW OF INTERMEDIATES UNDERWAY
Closing of PMMA disposal Review in progress in Fluorogases
Proposed disposal of PMMA Focus on specialty businesses Investigate strategic alternatives
business to Trinseo 1 for €1,137m for emissive applications
Next step of our strategic review in
Intermediates after PMMA disposal
Regulatory landscape recently
clarified in the US on HFCs
In 2021, define scope, business plan,
Closing expected mid-2021 High-value intermediates for carve-out and exploration of
fluoropolymers deconsolidation options
Fluorospecialties for electronics,
Executed in a timely manner
insulation, batteries..
Valuing the activity at
9.3x 2020e EBITDA Electrolyte salts for batteries (as part
Assess the best path and timing to
of EU commission battery project) generate value taking into account
market conditions evolution
1. The proposed disposal is subject to the approval of the relevant
antitrust authorities and to an information and consultation
process involving Arkema’s employee representative bodies
33 FY 2020 RESULTS AND OUTLOOK / 25 FEBRUARY 2021WELL POSITIONED TO BENEFIT FROM A REBOUND IN 2021 AND BEYOND
Start of the year marked by an increase in the level of global demand in the continuity of fourth-quarter
2020, in an uncertain environment. Q1’21 EBITDA expected to rise by around 10% YoY, including a
negative currency impact of €15 million
In 2021, excluding a significant resumption of the pandemic:
EBITDA of Specialty Materials (82% of Group’s sales in 2020) should grow by around 10% compared to
2020 at constant currency 1
Bostik EBITDA margin should reach 14% in 2021, in line with its 2024 trajectory, thanks to the benefits of its positioning in the
construction and high performance industrial adhesives, its operational excellence initiatives, as well as its acquisition strategy
Significant rebound in Advanced Materials, driven by innovation in batteries, electronics, lightweight materials,
sporting goods and filtration, as well as by higher demand in certain industrial markets, animal nutrition and crop
protection
Coating Solutions earnings supported by the growth momentum and sustainable innovation in the paints,
electronics and 3D printing markets
Intermediates EBITDA in 2021 to be at a comparable level to 2020 at constant currency 1 and scope
PMMA closing expected mid 2021
On-going execution of the mid term strategy
1. With the assumption of a €/$ rate of 1.2 for 2021, the impact on 2020 EBITDA is estimated at a negative €30 million for Specialty Materials and a negative €10 million for Intermediates
34 FY 2020 RESULTS AND OUTLOOK / 25 FEBRUARY 2021DISCLAIMER
The information disclosed in this document may contain forward-looking statements with respect to the financial condition, results of operations, business
and strategy of Arkema.
In the current context, where the Covid-19 epidemic continues to spread across the world, and the evolution of the situation as well as the magnitude of
its impacts on the global economy are highly uncertain, the retained assumptions and forward looking statements could ultimately prove inaccurate.
Such statements are based on management’s current views and assumptions that could ultimately prove inaccurate and are subject to material risk
factors such as among others, changes in raw material prices, currency fluctuations, implementation pace of cost-reduction projects, developments in
the Covid-19 situation, and changes in general economic and business conditions. These risk factors are further developed in the 2019 Universal
Registration Document.
Arkema does not assume any liability to update such forward-looking statements whether as a result of any new information or any unexpected event
or otherwise.
Further information on factors which could affect Arkema’s financial results is provided in the documents filed with the French Autorité des marchés
financiers.
Financial information since 2005 is extracted from the consolidated financial statements of Arkema. Quarterly financial information is not audited.
The business segment information is presented in accordance with Arkema’s internal reporting system used by the management.
The main performance indicators used by the Group are defined in the 2019 Universal Registration Document. As part of the analysis of its results or to
define its objectives, the Group uses in particular the following indicators:
EBITDA margin: corresponds to EBITDA as a percentage of sales, EBITDA equaling recurring operating income (REBIT) plus recurring depreciation and
amortization of tangible and intangible assets
REBIT margin: corresponds to the recurring operating income (REBIT) as a percentage of sales
Free cash flow: corresponds to cash flow from operations and investments excluding the impact of portfolio management
EBITDA to cash conversion rate: corresponds to the free cash flow excluding exceptional capital expenditure divided by EBITDA
35 FY 2020 RESULTS AND OUTLOOK / 25 FEBRUARY 2021You can also read