Wi-Fi performance testing of home broadband routers - Technical Report - Research Document: Ofcom
←
→
Page content transcription
If your browser does not render page correctly, please read the page content below
Wi-Fi performance testing of home
broadband routers
Technical Report

Research Document:
Publication Date: 13 May 2020
Contents
Section
1. Overview                             1
2. Introduction                         3
3. Routers under test                   5
4. Measurement configuration            6
5. Summary of our test results          12
6. Comments on our findings             24

Annexes
A1. Detailed description of the tests   26
A2. Network and Wi-Fi settings          31
Wi-Fi performance testing of home broadband routers – Technical Report

1. Overview
This report provides an overview, technical details and the anonymised results of our Wi-Fi
performance testing on fifteen home broadband routers. It is intended for a technical audience with
some prior knowledge of Wi-Fi performance and test metrics. For a more high-level summary of our
findings, please refer to our 2020 Home Broadband Performance Report.
As home broadband connection speeds increase, the wireless link between the router and devices
used around the home can become a performance bottleneck and have a detrimental impact on the
user experience. Broadband providers recognise this and have started using Wi-Fi performance as a
selling feature in marketing campaigns.
Currently, there is little independent information available regarding the performance of Wi-Fi and
associated customer premises equipment (CPE) router hardware to help people make an informed
decision when choosing a broadband service provider or router.
As part of Ofcom’s 2020 Home Broadband Performance Report, we carried out a programme of Wi-
Fi performance measurements on CPE routers available from the leading broadband providers and
two third-party devices. The results are presented in this technical report, which is being published
alongside the 2020 Home Broadband Performance Report which covers measurements taken in
November 2019. This will not only enhance the information available to consumers but also provide
an incentive for providers to continue to invest in better routers and in-home Wi-Fi performance.

What we found
All but one of the current routers we tested could deliver unattenuated Wi-Fi speeds that were
higher than the advertised speeds of broadband services they are supplied with. We also found that
speeds can drop significantly as people move their devices further away from the router.
Newer routers generally out-performed older devices. People struggling for the broadband speeds
they need who are using older routers can improve their Wi-Fi experience by requesting a newer
router from their provider.
Some older devices did not support services in the 5GHz band. Speed and connectivity tend to be
better at 5GHz, and the next generation of Wi-Fi products (Wi-Fi 6) will further improve
performance.

This overview is a simplified high-level summary. The remainder of this technical report describes
the tests undertaken and the anonymised test results.

                                                                                                      1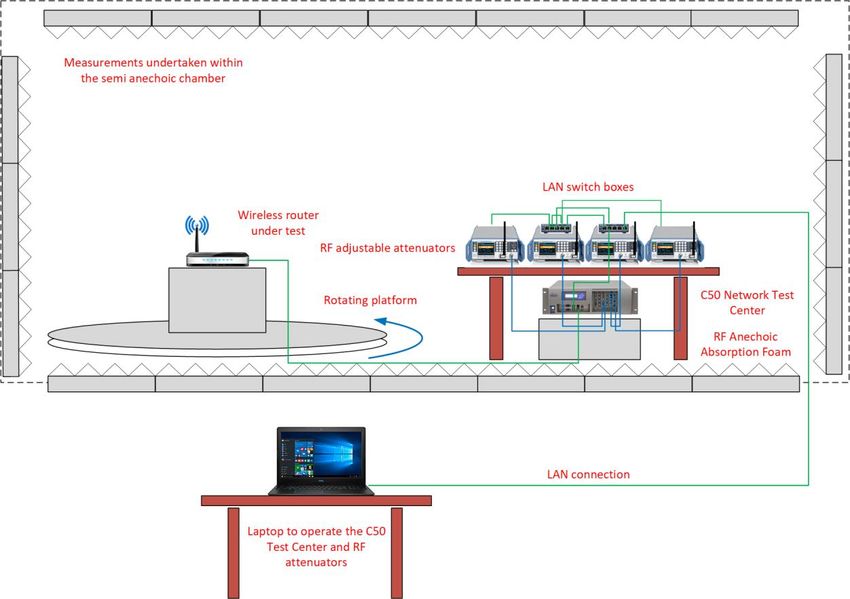
Wi-Fi performance testing of home broadband routers – Technical Report

How we carried out this research
We completed a series of tests on fifteen routers, comprising of seven routers currently distributed
by the main broadband providers when a new broadband package is taken, six legacy routers widely
used by consumers and two current third-party routers representing different price brackets.
Each router was tested while connected by multiple client devices to assess how it performed. We
tested for maximum throughput (speed) and over increased distances to understand how the
throughput rate reduced (range versus rate). We also looked at the consistency of the Wi-Fi signal
strength from different locations around the router (spatial consistency).
We based our testing on a methodology developed by Broadband Forum and published in a
document known as TR-398 (Wi-Fi In-Premises Performance Testing). We chose this approach as TR-
398 is freely available and we wanted our testing to be transparent. Furthermore, several UK
broadband providers are members of Broadband Forum and therefore have had opportunity to
contribute towards the development of TR-398.
During our testing, and following discussion with the providers, we have found some limitations in
TR-398 which mean that the results may not necessarily be representative of the maximum
performance that could be obtained under optimum conditions. Some features which are designed
to optimise Wi-Fi performance, such as Band Steering, Auto Channel Scanning and Channel
Optimisation, are excluded from TR-398. MESH networks and other solutions designed to enhance
in-home performance are also excluded. Our measurements were performed in a semi-anechoic
chamber (see Figure 2). This improves the repeatability of the testing but negates technologies such
as MIMO antennas, which are designed to improve performance in a multipath environment.
As such, we have chosen to anonymise the data as the publication of router-level results could be
confusing and misleading for consumers.

                                                                                                     2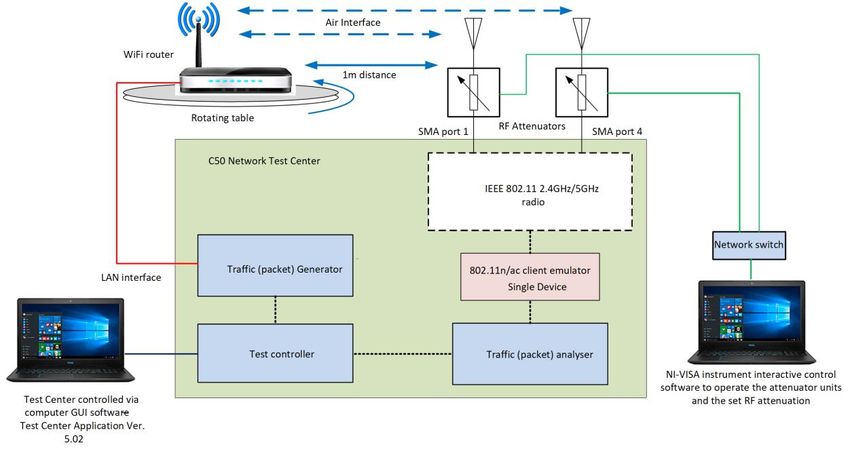
Wi-Fi performance testing of home broadband routers – Technical Report

2. Introduction
Wi-Fi has developed from the initial IEEE802.11 base standard released in 1997 and, although the
various communication layers and protocols are defined and well documented, it is not until
recently that there has been a common performance testing reference to which Wi-Fi products such
as domestic Wi-Fi routers can be measured.
At the Mobile World Congress in February 2019, the Broadband Forum1 launched the first in-home
Wi-Fi performance test method document; TR-398 - Wi-Fi In-Premises Performance Testing (TR-
398). This edition was specifically developed for IEEE 802.11n and IEEE 802.11ac compliant Access
Points. A second revision of this document is due to be published later in 2020 to encompass the
latest Wi-Fi developments, including the IEEE802.11ax (Wi-Fi 6) standard and wireless mesh
technologies.
TR-398 provides a set of performance test cases and a framework to verify the performance
between an Access Point – the Wi-Fi component of a domestic router – and one or more client
devices (for example a laptop, tablet, wireless speaker and other smart devices). TR-398 describes
the test set-up, equipment configuration requirements and test procedures.
The test cases specified are intended to replicate several in-home deployment scenarios. Equipment
performance is quantified using the key metrics of receiver sensitivity, throughput, coverage,
interference and stability to verify:
    1.   RF Performance
    2.   Bandwidth
    3.   Stability
    4.   Interference
    5.   Capacity
    6.   Coverage
We chose four of the test scenarios as the basis of our testing, as these are considered to provide a
set of key metrics to the overall performance for a home Wi-Fi router. The test cases are
summarised in Table 1 and a full description of the test methodology can be found in Annex A1.

1The Broadband Forum is a non-profit organisation composed of the industry’s leading broadband proponents, focused on
broadband innovation, standards and ecosystem development: https://www.broadband-forum.org/about-bbf
                                                                                                                    3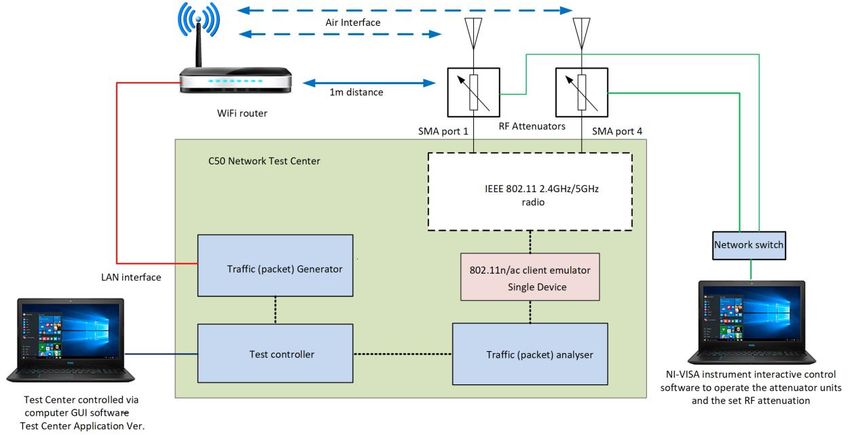
Wi-Fi performance testing of home broadband routers – Technical Report

Table 1: Summary of test cases
              Test Case                                             Test Description
 Maximum Connection Test                 Verification that the Wi-Fi router can support 32 devices
                                         simultaneously connected with minimal packet loss and
                                         disassociations taking place.
 Maximum Throughput Test                 This measures the maximum throughput performance of the
                                         Wi-Fi router. The test is conducted by connection through the
                                         Wi-Fi interface with a client device placed a short distance
                                         away.
 Range Versus Rate Test                  This measures the throughput as the distance between the
                                         router and a client device increases. The increase in range is
                                         simulated by adding additional attenuation to the signal path.
 Spatial Consistency Test                This verifies the Wi-Fi signal consistency at different angles
                                         around the router.

The remainder of this document is structured as follows:
          •    Section 3 provides information on the routers we tested;
          •    Section 4 provides information on the measurement set-up;
          •    Section 5 presents an overview of the test cases and the results;
          •    Section 6 provides some commentary on the main findings from our testing.
We are also publishing the anonymised results as an interactive Power BI presentation alongside this
technical report.

                                                                                                          4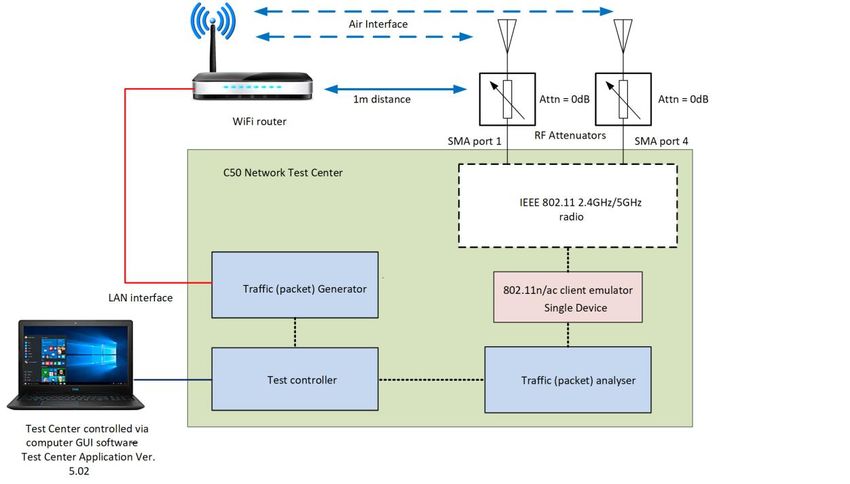
Wi-Fi performance testing of home broadband routers – Technical Report

3. Routers under test
A total of 15 routers were tested2: seven current CPE routers (i.e. those which are currently being
provided by six of the major broadband providers), six older legacy CPE routers which are still being
used by domestic customers and two third-party routers. The third-party routers were purchased
from Amazon’s UK website and selected as they were the top-selling models at the time of purchase.
Of the two third-party routers, TP-Link’s Archer C50 is a budget-priced unit and Netgear’s Nighthawk
X6 is a more expensive unit. Both are included in the results as current models.
Table 2: Current routers supplied by the major broadband providers
                     Provider                                Router name
                     BT                                      Smart Hub
                     BT                                      Smart Hub 2
                     KCOM                                    Technicolor – DGA2231
                     Plusnet                                 Plusnet Hub One
                     Sky                                     Sky Q Hub
                     Talk-Talk                               Wi-Fi Hub
                     Virgin Media                            Hub 3

Table 3: Legacy routers supplied by the major broadband providers
                     Provider                                Router name
                     BT                                      Home Hub 5
                     KCOM                                    Technicolor – TG589
                     Plusnet                                 Technicolor – 582n
                     Sky                                     Sky Hub 3
                     Talk-Talk                               HG635
                     Virgin Media                            Super Hub 2 AC

Table 4: Third-party routers
                     Manufacturer                            Router name
                     TP-Link                                 Archer C50
                     Netgear                                 Nighthawk X6

2Note that the order of the routers has been randomised in our results and does not reflect the order shown in these
tables.
                                                                                                                       5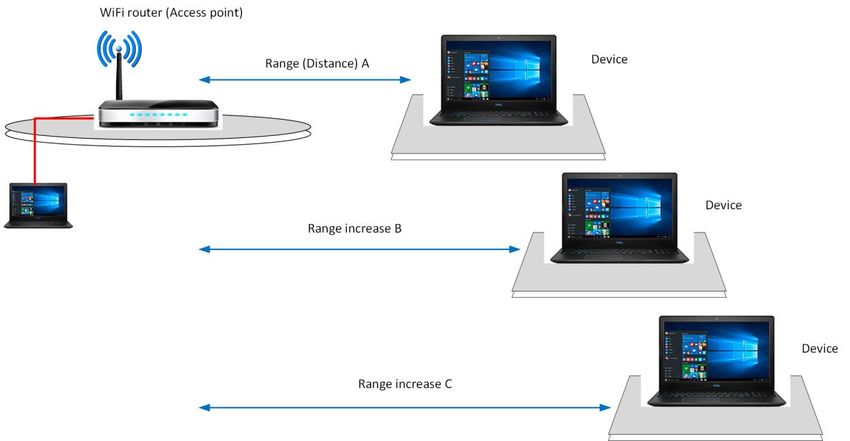
Wi-Fi performance testing of home broadband routers – Technical Report
4. Measurement configuration
Test Environment
Wi-Fi performance is easily impacted by external factors including attenuation of the Wi-Fi signal by
physical obstruction, the operation of neighbouring Wi-Fi networks and interference caused by
nearby appliances, such as microwave ovens operating in the same frequency band (2.4GHz). To
mitigate these external factors and provide a controlled measurement environment, we carried out
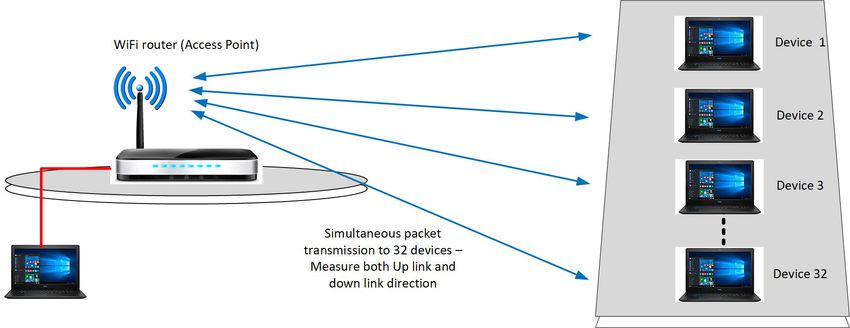
the tests in our semi-anechoic chamber at Ofcom’s test facility in Baldock. The chamber also benefits
from a rotating platform to allow precise angular measurement for the spatial consistency test.
Figure 1: Schematic view of test configuration
6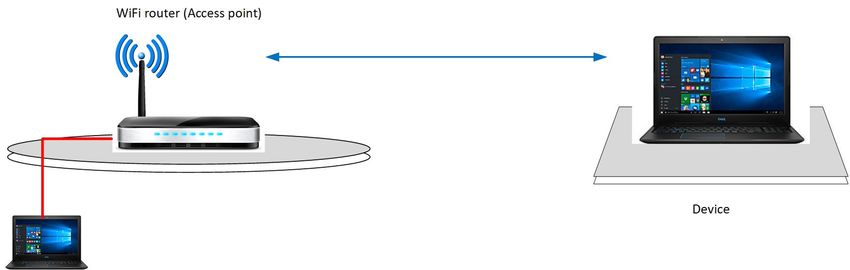
Wi-Fi performance testing of home broadband routers – Technical Report

Figure 2: Equipment configured inside the semi-anechoic chamber

Network Emulation
To overcome some of the practicalities of performing the tests, we decided to use a dedicated
network test set, the Spirent C50 Network TestCenter3. This equipment is designed for undertaking
network testing by generating and analysing traffic packet data to measure performance.
The C50 HWB-21 Network TestCenter comprises of a primary layer (2-3) network traffic generator
(data packet blaster) and analyser. It is also fitted with two IEEE 802.11 Wi-Fi radio cards to enable
network access point measurement of IEEE802.11ac SU-MIMO and MU-MIMO client devices
operating in the 5GHz band and legacy IEEE802.11n/ac clients operating in either 2.4GHz or 5GHz
bands.
The four tests only required the dual band 2.4/5GHz radio card (NIC slot 1) providing 2x2 MIMO
output spatial streams from the TestCenter SMA ports 1 and 4.
To reduce the level of Wi-Fi signal as a result of a client device being positioned further from the
router as described for the range versus rate test, TR-398 details the use of RF attenuators added to
the Wi-Fi signal path. For this, precision controllable RF attenuator units were connected between
the RF output of the TestCenter IEEE802.11 Wi-Fi card (NIC) and the associated antenna. During the
initial equipment set-up, RF attenuators were connected to all four radio SMA ports although only
two ports were required for the tests. Both attenuator units were remotely operated via LAN using

3   https://www.spirent.com/products/testcenter
                                                                                                         7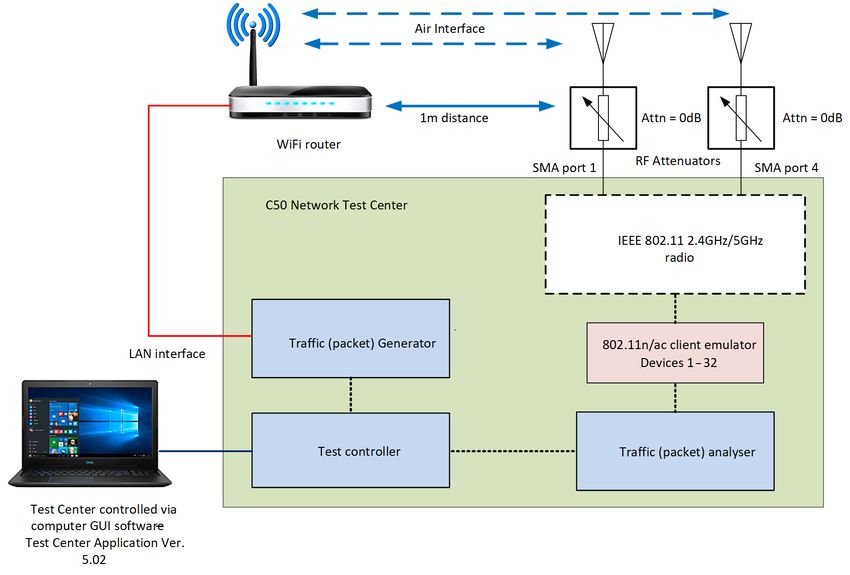
Wi-Fi performance testing of home broadband routers – Technical Report

the National Instrument NI-VISA instrument interactive control software application to set the
required attenuation values.
The TestCenter multi-client facility provided the means to emulate the simultaneous connection of
32 client devices to the router under test over the Wi-Fi air interface, as required by the TR-398
maximum connection test.
To perform the measurements, a closed circuit is set up between C50 TestCenter and the router.
This is established by connecting a LAN Ethernet cable from the TestCenter to the router under test
and transmitting data wirelessly over the air interface from the router back to the TestCenter NIC
radio card, which is simulating one (or more) client devices. This enables the TestCenter to analyse
sent and received packet data from the internal traffic generator.
Figure 3: C50 TestCenter configuration

The C50 TestCenter is operated through a Software GUI application. The command sequencer
function enables creation of test scripts to semi-automate the testing process and provide
measurement repeatability across all the routers being tested.
Spirent TestCenter Application software Version 5.02 was installed on a computer laptop to provide
the user interface (GUI) and operate the C50 TestCenter remotely a LAN Ethernet connection.

                                                                                                       8
Wi-Fi performance testing of home broadband routers – Technical Report
Test Configuration
TR-398 stipulates certain requirements for carrying out the tests. These requirements formed part of
the TestCenter analyser and generator set-up configuration, along with various measurement
timings written within the test scripts.
The LAN interface card used by the C50 TestCenter had the capability to support data speeds of at
least 1Gbits/s and provided the Ethernet connectivity to test router.
Goodput and UDP
We used goodput data throughput as the measurement metric to describe the number of useful
information bits delivered over a network per unit of time. Goodput is an application-level of
communication which excludes protocol overhead bits and retransmitted data packets. Goodput
was chosen as this is considered a good measurement of performance by network managers as it
relates to HTTP and ‘user experience’.
• A code file (file size of 100,000 bytes for 2.4GHz testing and 10,000,000 bytes for 5GHz
testing) transaction was simulated and continuously conducted during the
measurement time.
• Each fragment of the file was sent continuously to the operating system that the test
software is running on, with payload size determined by the operating system.
User Datagram Protocol (UDP) traffic with fixed controlled packet size was used for the maximum
connection test, as specified by TR-398.
• A code file (file size of 730,000) transaction was simulated in the UDP connection and
this transaction was continuously conducted during the measurement time.
• The UDP payload size was set as 1,460 bytes (note: this leads to 1,472-byte Ethernet
Frame Size with 20-bytes IP header and 8-byte UDP header.)
Propagation path and separation distance between devices
To facilitate repeatable testing, TR-398 explains that the wireless propagation channel between the
test router and the TestCenter (emulating the client devices) needs to be controlled. A physical
separation distance of 1m between the test router and the TestCenter was used in the semi-
anechoic chamber and RF attenuator units were used to simulate further increases in separation.
Since the propagation environment within the chamber is representative of free space path loss, the
effective separation distance can be increased by increasing the attenuation on the path according
to the path loss formula:
Path loss (dB) = 20*log10 f (GHz) + 20*log10 d (metres) + 32.45
Router settings
All current routers were tested as supplied by the providers. We did not make any changes to the
configuration settings or to the firmware, except where stipulated by TR-398 to perform the tests.
We accept that this could mean the routers were not configured to give the optimum performance
9Wi-Fi performance testing of home broadband routers – Technical Report
for each test. However, we consider that most consumers would use their router “out of the box”,
with the settings configured by their broadband provider at the time of installation.
The settings we used during testing are shown in Table 5.
Table 5: Router configuration settings used in testing
Configuration Parameter Default Value
SSID name Ofcom-24 (for IEEE802.11n, 2.4GHz tests)
Ofcom-5 (for IEEE802.11ac, 5GHz tests)
Enable SSIS Yes
DHCP, firewall and DOS protection Off
Broadcast SSID Yes
Enable WMM Yes
Authentication mode WPA2 - Personal
Encryption mode AES
IP address 192.168.1.1 / 225.225.225.0
We tested both the downlink (router to client) and uplink (client to router) Wi-Fi performance in
both the 2.4GHz and 5GHz frequency bands (although not all devices tested supported 5GHz). We
disabled the band not in use to prevent the router from switching bands during testing. In the
2.4GHz band all measurements were made on channel 6, and at 5GHz all measurements were made
on channel 36, as required by TR-398.
Table 6: Configuration for testing in the 2.4GHz band
Configuration Parameter Default Value
Channel Channel 6
Channel bandwidth 20 MHz
IEE standard 802.11n
Table 7: Configuration for testing in the 5GHz band
Configuration Parameter Default Value
Channel Channel 36
Channel bandwidth 20/40/80 MHz (router default setting)
IEE standard 802.11ac
10Wi-Fi performance testing of home broadband routers – Technical Report
Duration of tests and statistical significance
Each test was run over a period of 120 seconds. We found that there is an initial period after the test
starts before the data rate stabilises (i.e. when the data rate ramps up), and a further period at the
end of the test when the data rate tails-off. We excluded these two periods from the data processing
in order to get more reliable results.
Figure 4: Exclusion of data rate ramp-up and tail-off
Due to limitations on test time, we only ran each test once and we only included one sample of each
router. We acknowledge that running the tests multiple times and including more than one sample
of each router could give different results.
Other test settings stipulated by TR-398
At the start of each test and as part of the test script sequence, connection of the C50 TestCenter to
the test router was established through Address Resolution Protocol (ARP) and Wi-Fi association.
The following conditions were followed as stipulated in TR398:
• Flow generation shall be IPv4.
• No delay is to be introduced once a measurement has started.
• No data rate limitation will be set for traffic flow.
• Data will not be compressed.
• Window size is set as 64 kilobytes.
11Wi-Fi performance testing of home broadband routers – Technical Report
5. Summary of our test results
Maximum Connection Test
Purpose: To determine router throughput performance when connected to multiple client devices
simultaneously.
Figure 5: Maximum connection test
The maximum connection test verifies that the Wi-Fi router can support up to 32 devices
simultaneously connected and with minimal packet loss.
The measurement is calculated by sending and receiving data packets over 120 seconds. Based on
the number of packets sent by the router and received by the 32 simulated client devices, we
calculated the downlink packet error rate i.e. how many packets were missed and not acknowledged
by any of the devices. Similarly, the uplink packet error rate was calculated from how many packets
were missed and not acknowledged by the router from the devices during the 120 second test
duration.
Figure 6: Maximum connection test: percentage of data packets delivered over 2.4GHz download
12Wi-Fi performance testing of home broadband routers – Technical Report
Figure 7: Maximum connection test: percentage of data packets delivered over 2.4GHz upload
Figure 8: Maximum connection test: percentage of data packets delivered over 5GHz download
Figure 9: Maximum connection test: percentage of data packets delivered over 5GHz upload
13Wi-Fi performance testing of home broadband routers – Technical Report
Maximum Throughput Test
Purpose: To measure the maximum achievable data throughput of the router.
Figure 10: Maximum throughput test
This test is designed to measure the maximum throughput (in Mbit/s) at which the system can
process units of information over 120 seconds. Data was transmitted over Wi-Fi between the router
and the simulated client device generated by the TestCenter. The distance between router and
client was set at 1m. Both downlink and uplink speeds were measured and recorded for each band
(2.4GHz and 5GHz).
As it took time for the data connection to stabilise, we excluded the initial data ramp-up and tail-off
from the results. Based on this distribution, the average maximum throughput over the duration of
the test was calculated.
Figure 11: Maximum throughput test: 2.4GHz
14Wi-Fi performance testing of home broadband routers – Technical Report
Figure 12: Maximum throughput test: 5GHz
Range Versus Rate Test
Purpose: To measure the achievable throughput as the range (or distance) increases between the
router and client device.
Figure 13: Range versus Rate test
The range versus rate test measures the baseband uplink and downlink throughput rate for varying
range (distances) between the client device and router. As the distance between the router and
device is increased the magnitude (signal strength) of the uplink and downlink Wi-Fi signals are
reduced. Consequently, the throughput drops resulting in the Wi-Fi link adopting a more robust
modulation scheme (Modulation Coding Scheme (MCS) index). We simulated distance by the
addition of attenuation in the Wi-Fi signal path between router and client device. During testing it
15Wi-Fi performance testing of home broadband routers – Technical Report
was noted that there was little performance difference between 0dB and 6dB steps, and between
6dB and 12dB, so the 6dB measurement was omitted in the interests of reducing test time.
To maximise the value of this test, additional attenuation values were added to identify the point at
which the Wi-Fi connection between the router and client device was lost. When plotted, this
illustrates the degradation in router rate performance more effectively than attenuation values in
isolation as described in TR-398. As with the Maximum Throughput test results, the test time was
trimmed to exclude the ramp-up and tail-off of the connection and the median average throughput
was calculated.
In the following figures the attenuation value on the x-axis is in addition to the free space path loss
calculated over 1m distance. At 2.4GHz, 0dB attenuation in the figures represents a total loss of
40.2dB (so, for example, 25dB attenuation represents a total loss of 65.2dB). At 5GHz, 0dB
attenuation represents a total loss of 46.7dB (so, for example, 25dB attenuation represents a total
loss of 71.7dB).
Figure 14: Range vs rate test: 2.4GHz download results for legacy routers
Figure 15: Range vs rate test: 2.4GHz download results for current routers
16Wi-Fi performance testing of home broadband routers – Technical Report
Figure 16: Range vs rate test: 2.4GHz upload results for legacy routers
Figure 17: Range vs rate test: 2.4GHz upload results for current routers
Figure 18: Range vs rate test: 5GHz download results for legacy routers
17Wi-Fi performance testing of home broadband routers – Technical Report
Figure 19: Range vs rate test: 5GHz download results for current routers
Figure 20: Range vs rate test: 5GHz upload results for legacy routers
Figure 21: Range vs rate test: 5GHz upload results for current routers
18Wi-Fi performance testing of home broadband routers – Technical Report
The table below can be used to convert the attenuation values shown in Figure 14 to Figure 21 into
equivalent distance, under ideal free space path loss conditions.
Table 8: Conversion of attenuation to distance under ideal conditions
Attenuation (dB) Equivalent distance (m)
0 1
10 3.16
20 10
30 31.6
40 100
Spatial Consistency Test
Purpose: To verify the consistency of the Wi-Fi signal at different angles around the router.
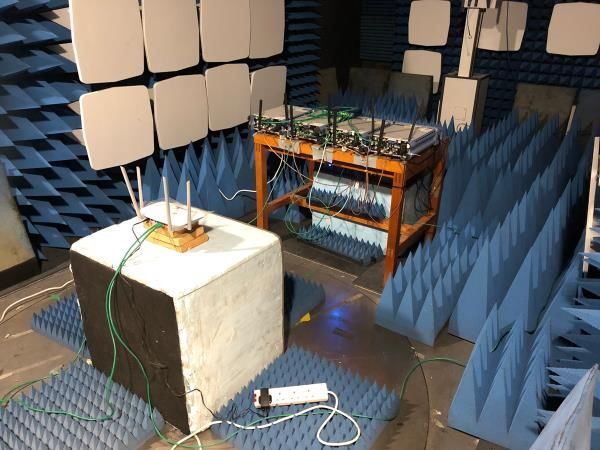
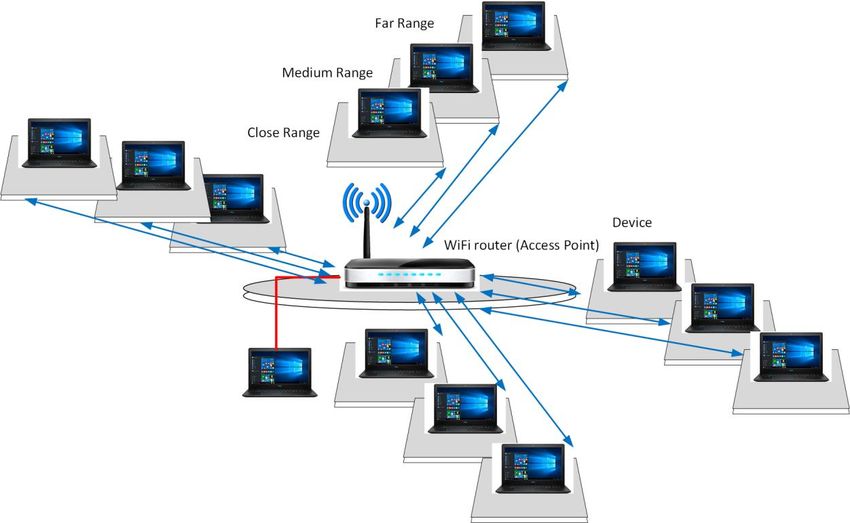
Figure 22: Spatial consistency test
This test verifies Wi-Fi consistency in the spatial domain by measuring uplink and downlink
throughput performance by the client device accessing the router from different directions and
distances. This test is repeated at three different distances representing strong, medium and weak
Wi-Fi signals. The increase in distance was simulated by adding additional attenuation to the Wi-Fi
path (see Table 9 in Annex A1). Both uplink and downlink tests were carried out at 30° intervals as
the router was rotated through 360°.
19Wi-Fi performance testing of home broadband routers – Technical Report
Figure 23: Median average throughput (Mbit/s) by angle and attenuation: 2.4GHz download,
legacy routers
Throughput scale
Low High
Figure 24: Median average throughput (Mbit/s) by angle and attenuation: 2.4GHz download,
current routers
Throughput scale
Low High
Figure 25: Median average throughput (Mbit/s) by angle and attenuation: 2.4GHz upload, legacy
routers
Throughput scale
Low High
20Wi-Fi performance testing of home broadband routers – Technical Report
Figure 26: Median average throughput (Mbit/s) by angle and attenuation: 2.4GHz upload, current
routers
Throughput scale
Low High
Figure 27: Median average throughput (Mbit/s) by angle and attenuation: 5GHz download, legacy
routers
Throughput scale
Low High
Figure 28: Median average throughput (Mbit/s) by angle and attenuation: 5GHz download, current
routers
Throughput scale
Low High
21Wi-Fi performance testing of home broadband routers – Technical Report
Figure 29: Median average throughput (Mbit/s) by angle and attenuation: 5GHz upload, legacy
routers
Throughput scale
Low High
Figure 30: Median average throughput (Mbit/s) by angle and attenuation: 5GHz upload, current
routers
Throughput scale
Low High
Figure 31 below presents an alternative way of viewing the spatial consistency results for one
example router. The results are shown in 30° increments around the router and for the three
attenuator settings representing strong, medium and weak Wi-Fi signal strength.
The results for all the devices we tested can be found in the accompanying interactive report.
22Wi-Fi performance testing of home broadband routers – Technical Report
Figure 31: Alternative view of the spatial consistency results for one router
2.4GHz 5GHz
Download
Upload
23Wi-Fi performance testing of home broadband routers – Technical Report
6. Comments on our findings
Our testing has highlighted certain limitations with the test approach used in the current version of
TR-398.
TR-398 stipulates carrying out tests within a controlled environment, such as a semi-anechoic
chamber, to maintain testing repeatability and limit the effects of external factors such RF
interference or multipath. However, although this provides consistent, repeatable results in the lab,
it does not reflect the typical in-home environment and excludes any optimisation that requires a
live broadband connection. TR-398 also does not provide any guidance on the client device antenna
characteristics or orientation, which could influence the results.
The latest iteration of CPE routers from major providers have features designed to optimise Wi-Fi
performance such as band steering, auto channel scanning and channel optimisation. This aspect of
router performance is not considered in the current version of TR-398. MESH networks and other
multiple access point solutions designed to enhance in-home Wi-Fi performance were excluded
from the testing.
Processing and collating all the data created additional complexity due to the number of routers
tested and the resulting individual test files generated by the TestCenter (c.2,500). Consequently, we
were not able to review a stable data set and assess the results/anomalies until all the testing was
completed.
The performance of one of the current routers was significantly lower than that of the others. We
believe that this may have been due to an issue with the router that we tested and/or its
compatibility with the test equipment, something that wasn't identified until reviewing the results
after the testing was completed.
We found some inconsistencies between the results obtained from the Maximum Throughput test,
and those of the Range Versus Rate at 0dB attenuation and the 0o Spatial Consistency test at the
strong signal level. As these tests are effectively the same, the difference in results was not
expected. To produce consistent, robust results reflecting true performance, the tests would need to
be repeated a number of times to attain a result average. This would require a much longer testing
period than we had available and is a limitation of the TR-398 test procedure.
We believe that the maximum throughput rate achieved by the latest CPE routers was limited by the
configuration parameters set by TR-398 and likely to be a major contributing factor to the reduced
performance results, particularly for the closer ranges.
We also think that the low throughput values recorded during the spatial consistency test for some
of the angles (particularly for strong and medium signals) may be the result of ‘null’ spots at specific
angles within the antenna polar profile. Within the normal home, any ‘null’ effects would be limited
by the multipath environment and multiple antennas within the router. However, it is useful to note
that small changes to the router orientation could improve signal strength and coverage where
consumers are experiencing lower throughput.
24Wi-Fi performance testing of home broadband routers – Technical Report
We found that even within the test environment changing the router angle by a few degrees could
result in signal recovery and throughput improvement. TR-398 does not explain the rationale for the
30o rotation intervals and this interval coarseness could be considered as a test limitation.
The Spatial Consistency test also only includes coverage in the horizontal axis and takes no account
of spatial coverage within the vertical axis. The coverage profile of many CPE routers, especially the
newer units, are designed around a typical home environment where clients are likely to access the
router from various locations, including upper floors such as bedrooms. This scenario is not captured
within the scope of the TR-398 test.
TR-398 does not explain why the number of client device is set to 32 for the Maximum Connection
test. This prevented two of the routers we tested from associating and completing the maximum
connection tests. We understand that the standard firmware configuration for these routers limits
the maximum client connection number to less than 32, but this value can be increased if required in
the configuration settings.
In summary we conclude that the result anomalies are in general due to variability in the test data
and the test methodology used in TR-398, rather than due to the performance of the routers
themselves. However, our testing highlighted that new routers tend to provide better performance
and user experience than older legacy models, and that Wi-Fi performance tends to be better over
the 5GHz band than the 2.4GHz band.
25Wi-Fi performance testing of home broadband routers – Technical Report
A1. Detailed description of the tests
Maximum connection test
The test configuration is shown in Figure 32 below.
Figure 32: Maximum connection test
Test procedure
• The test router was placed at 1m from the TestCenter.
• The TestCenter was configured to emulate the simultaneous Wi-Fi connection of 32
client devices with the router. Where it was not possible to associate 32 devices, the
device count was reduced to 16 to enable completion of the tests.
• A UDP connection (1,460 packet size) was used for the packet transmission during the
test as stipulated by TR398.
• The Ethernet LAN connection and association to the Wi-Fi network was established
between the TestCenter and router.
• For IEEE 802.11n devices, the relevant test script was loaded into the TestCenter
(except for the routers that did not support 32 devices, where the 16-device test script
was used). Both the router and TestCenter were configured for 2.4GHz operation.
• For IEEE 802.11ac devices, the relevant script was loaded and both the router and
TestCenter were configured for 5GHz operation.
26Wi-Fi performance testing of home broadband routers – Technical Report
• The following test sequence was performed:
- For 802.11n devices, measurement of the uplink and downlink UDP packet loss
over the test periods of 120 seconds and with a traffic rate of 2Mbit/s through
each device. The number of packets transmitted and received were recorded to
determine the packet error rate.
- For 802.11ac devices, measurement of the uplink and downlink UDP packet loss
over the test periods of 120 seconds and with a traffic rate of 8Mbit/s through
each device. The number of packets transmitted and received were recorded to
determine the packet error rate.
• The initial ramp-up of data at the start of the 120s test period, and tail-off at the end,
was removed to derive the results.
Maximum throughput test
The test configuration is shown in Figure 33 below.
Figure 33: Maximum throughput test
Test procedure
• The test router was placed at 1m from the TestCenter.
• The TestCenter was configured for single client device Wi-Fi connection.
• Goodput packet generation was used as the measurement metric for the test.
• The Ethernet LAN connection and association to the Wi-Fi network was established
between the TestCenter and router.
27Wi-Fi performance testing of home broadband routers – Technical Report
• For IEEE802.11n devices, the relevant test script was loaded into the TestCenter and
both the router and TestCenter were configured for 2.4GHz operation.
• For IEEE802.11ac devices, the relevant script was loaded and both the router and
TestCenter were configured for 5GHz operation.
• The following test sequence was performed:
− Measurement of the uplink and downlink maximum achieved goodput over the test periods
of 120 seconds.
• The initial ramp-up of data at the start of the 120s test period, and tail-off at the end,
was removed to derive the results.
Range versus Rate test
The test configuration is shown in Figure 34 below.
Figure 34: Range versus rate test
Test procedure
• The test router was placed at 1m from the TestCenter.
• The TestCenter was configured as a single client device Wi-Fi connection.
• Goodput packet generation was used as the measurement metric for the test.
• The Ethernet LAN connection and association to the Wi-Fi network was established
between the TestCenter and router.
• For IEEE802.11n devices, the relevant test script was loaded into the TestCenter and
both the router and TestCenter were configured for 2.4GHz operation.
• For IEEE802.11ac devices, the relevant script was loaded and both the router and
TestCenter were configured for 5GHz operation.
• The attenuation on the Wi-Fi path was incrementally increased, thereby reducing the
Wi-Fi signal level to simulate a client device being positioned further from the router or
28Wi-Fi performance testing of home broadband routers – Technical Report
as a result of a physical obstruction such as a wall blocking and attenuating the signal
the path.
• The following test sequence was performed:
− Measurement of the uplink and downlink maximum achieved goodput over the test periods
of 120 seconds.
− The attenuation was increased, and the test sequence was repeated until the TestCenter
radio client device was no longer able to associate with the router.
− At the point where the Wi-Fi connection failed, the attenuation was reduced to re-establish
connectivity and then increased in small increments to find the exact attenuation value of
Wi-Fi failure.
• The initial ramp-up of data at the start of the 120s test period, and tail-off at the end, was
removed to derive the results.
Spatial consistency test
The test configuration is shown in Figure 35 below.
Figure 35: Spatial consistency test
Test procedure
• The test router was placed at 1m from the TestCenter.
• The TestCenter was configured as a single client device Wi-Fi connection.
• Goodput packet generation was used as the measurement metric for the test.
• The Ethernet LAN connection and association to the Wi-Fi network was established
between the TestCenter and router.
29Wi-Fi performance testing of home broadband routers – Technical Report
• For IEEE802.11n devices, the relevant test script was loaded into the TestCenter and
both the router and TestCenter were configured for 2.4GHz operation.
• For IEEE802.11ac devices, the relevant script was loaded and both the router and
TestCenter were configured for 5GHz operation.
• The starting attenuation settings for the strong, medium and weak signal levels were
chosen as a result of the attenuation values used during the range versus rate tests.
Table 9: Attenuator settings for spatial consistency test
2.4 GHz band 5 GHz band
Strong signal 6 dB 6 dB
Medium signal 15 dB 18 dB
Weak signal 20 dB 30 dB
• The following test sequence was performed:
- The turntable was set to 0° and attenuation set to the strong signal level values.
- Measurement of the uplink and downlink maximum achieved goodput over the
test periods of 120 seconds.
- The turntable was rotated in 30° steps (through 360°) and the uplink and downlink
goodput measurement repeated.
- The test sequence was repeated for other attenuation values representing medium
and weak signal strengths.
• The initial ramp-up of data at the start of the 120s test period, and tail-off at the end,
was removed to derive the results.
30Wi-Fi performance testing of home broadband routers – Technical Report
A2. Network and Wi-Fi settings
To operate the TestCenter, RF attenuators and to access the router settings manager, an IPv4
network was set up using LAN switch boxes. The IP address allocation was as follows:
• Management network is 10.75.101.0/24:
- C50 management IP – 10.75.101.91
- Controller PC IP – 10.75.101.90
- R&S RSC 1 Attn – 10.75.101.11
- R&S RSC 2 Attn – 10.75.101.12 (not used during tests)
- R&S RSC 3 Attn – 10.75.101.13 (not used during tests)
- R&S RSC 4 Attn – 10.75.101.14
• Test network is 192.168.1.0/24
- Router under test LAN IP – 192.168.1.1
- Router under test LAN Client/Server – 192.168.1.100
- Controller PC IP to manage router under test – 192.168.1.222
- Wi-Fi Clients – 192.168.1.x (test dependent, but can be changed but not
overlapping with the IP’s set above)
Prior to undergoing measurements, the Wi-Fi channel was configured as follows:
• Configure SSID as: Ofcom-24 (for IEEE802.11n, 2.4GHz tests)
• Ofcom-5 (for IEEE802.11ac, 5GHz tests)
• Configure WPA2 with pre-shared key: test1234
• Configure IP address to: 192.168.1.1/ 255.255.255.0
Note it was not possible to set the IP address for one of the devices under test which was fixed to
192.168.0.1. Therefore, the TestCenter Device IPV4 address and the IPv4 Default gateway settings
for the radio and LAN emulated interface configuration had to be changed to 192.168.0.x
The attenuator units were remotely operated via LAN using the National Instrument NI-VISA
instrument interactive control software application to set the required attenuation values using
SCipy commands.
31You can also read