Monthly Epidemiological Bulletin - Coronavirus (COVID-19) - Northern Ireland - Public Health Agency
←
→
Page content transcription
If your browser does not render page correctly, please read the page content below
Coronavirus (COVID-19)

Monthly Epidemiological
Bulletin

              Northern Ireland

         Up to week 29 (19 July 2020)
COVID-19 Monthly Epidemiological Bulletin Up to week 29 (19 July 2020)
Summary - Up to week 29 (19 July 2020)
To week 29, there have been a total of 5,866 laboratory confirmed
cases1 of COVID-19, including 844 registered COVID-19 deaths2 in
Northern Ireland.
COVID-19 case epidemiology
5,866 laboratory confirmed cases (84% from HSC
laboratories)
60% of total cases are female
28% of cases tested in HSC laboratories reside in Belfast
(Local Government District)
33% of total cases are from the National Testing
Programme, NIAS, private nursing home residents,
pathology services, GPs and hospices
Care home outbreaks (suspected and confirmed)
180 suspected/confirmed COVID-19 outbreaks reported
Involving 164 care homes (35.1% of all Northern Ireland
care homes)
The highest proportion of outbreaks (45.9%) were reported
from the Southern Trust area
1
Virological reports and the National Testing Programme
2
NISRA; 2020 - up to 10 July 2020
1COVID-19 Monthly Epidemiological Bulletin Up to week 29 (19 July 2020)
Primary care syndromic surveillance
In week 29:
In-hours Acute Respiratory Infections (ARI) and COVID-19
consultation rate: 17.6 per 100,000 population
Out-of-hours (OOH) ARI consultation rate: 21.4 per 100,000
population
OOH COVID-19 consultation rate: 3.4 per 100,000
population
Sentinel testing
Testing started 27 April 2020
Number of individuals tested in total: 233 (1.3% positivity)
COVID centres
Testing started 15 June 2020 (one COVID centre: BHSCT)
Virology data from the COVID centre became available
from 1 July 2020
Number of individuals tested 15 - 30 June 2020: 182 (all
negative)
Number of individuals tested 1 - 19 July 2020: 144 (all
negative)
Critical care surveillance
134 confirmed COVID-19 individuals reported to the PHA
through the COVID-19 critical care online reporting system
The majority of reported critical care cases were male (72%)
The median age of cases was 58 years (range 26 – 81
years)
2COVID-19 Monthly Epidemiological Bulletin Up to week 29 (19 July 2020)
Mortality surveillance
In week ending 19 July 2020, the proportion of COVID-19
deaths registered was 3%. From the beginning of 2020 to
week ending 19 July 2020 the proportion was 9%
Excess deaths were reported in weeks 13-22; mainly in
those over 65 years
Testing surveillance virology
Number of individuals tested in total: 136,687 (4.3%
positivity)
Number of individuals tested in;
o HSC laboratories: 95,775 (70% of total tests)
o National Testing Programme: 40,912 (30% of total
tests)
3COVID-19 Monthly Epidemiological Bulletin Up to week 29 (19 July 2020)
Introduction
COVID-19 is a new illness that can affect your lungs and airways. It's
caused by a type of virus called SARS-CoV2 (coronavirus).
The Public Health Agency (PHA) Health Protection team has developed
this report with the primary focus of looking at the demographic
characteristics (age, sex and geographical location) of people affected
by the virus. It also looks at some of the wider impact of the virus on the
healthcare system, comparing recent trends in activity with historic
norms.
There is a large amount of data being regularly published regarding
COVID-19 (for example, the Department of Health Dashboard and
Deaths involving coronavirus in Northern Ireland by the Northern Ireland
Statistics and Research Agency). This report presents data from existing
and newly developed PHA Health Protection surveillance systems that
monitor COVID-19 activity in Northern Ireland and complements the
range of existing data currently available.
As this is an emerging pandemic the systems used will constantly evolve
and the complexity of the analysis will increase. All updates will be
documented in “what’s new” section below.
Unless otherwise stated, data is presented using epidemiological weeks
(a standardised method of counting weeks [Monday-Sunday] to allow for
the comparison of data year after year). This is dependent on the data
available and comparisons not yet possible due to the recent emergence
of this novel virus.
There is a large amount of data being regularly published regarding
COVID-19 (for example, Department of Health COVID-19 Daily
Dashboard Updates and NISRA Deaths Registered Dashboard). This
bulletin complements the range of existing data currently available.
4COVID-19 Monthly Epidemiological Bulletin Up to week 29 (19 July 2020)
What’s new
In this edition we have added information about:
1. An update on the sentinel GP Practice testing programme. Data is
now available but further work is ongoing to improve the quality so
it is subject to change.
2. An update on COVID centres testing: virology data is available
from the Belfast COVID centre from 1st July. Work is ongoing to
improve the quality so it is subject to change.
5COVID-19 Monthly Epidemiological Bulletin Up to week 29 (19 July 2020)
Contact tracing
Contact tracing is the process of identifying, assessing, and managing
people who have been exposed to a disease to prevent onward
transmission (WHO). Contact tracing can help break the chains of
transmission of COVID-19 and is an essential public health tool for
controlling the virus.
Contact tracing seeks to limit and prevent the spread of infections such
as COVID-19. It works by identifying a confirmed case and asking them
who they have been in contact with. Individual contacts are considered
high risk if they have spent more than 15 minutes in close contact with a
confirmed case without personal protection. This means that those who
have casually passed by someone on the street will not be considered
high risk. The person with a confirmed infection and their close contacts
will be given advice regarding symptom management and the need to
self-isolate to prevent wider spread of the virus. This advice is based on
information available on the PHA website and includes social distancing,
handwashing and cleaning in the home to help protect people who are at
risk. We can also advise people on how to best look after those in their
care.
The most up-to-date contact tracing management service update (issued
16 July 2020) can be found here*.
*These are experimental performance and activity data and provide a snapshot of
contact tracer activity. Data reported relates to a live operational system which
includes case and contact activity in progress or in a queue. It is based on manually
recorded information and data extracted from current contact tracing systems and
reporting methods and parameters may change over time. Automatic reporting in
future may create a temporary transitional discontinuity in figures. Data should not be
compared with other published figures as they will not align. Due to current relatively
small case numbers there may be high variability in daily activity data.
6COVID-19 Monthly Epidemiological Bulletin Up to week 29 (19 July 2020)
Case epidemiology
200 7000
180
Cumulative total of confirmed cases
6000
Number of confirmed cases
160
140 5000
120
4000
100
3000
80
60 2000
40
1000
20
0 0
Cases (HSC laboratory) Cases (National Testing Programme) Cumulative Postive Cases
Figure 1. Laboratory confirmed COVID-19 cases by sample date and source (HSC
Laboratory testing and the National Testing Programme), 2020
Figure 1 represents the number of new daily cases reported to the PHA
(bars) and the cumulative number of cases (dashed line). Reporting is
likely to be incomplete for the most recent days due to natural delays in
samples reaching the labs, being tested and the information being
reported.
Throughout July we continue to see smaller daily peaks relating to
localised clusters as lockdown measures have been eased.
7COVID-19 Monthly Epidemiological Bulletin Up to week 29 (19 July 2020)
80+
70 - 79
60 - 69
Age group
50 - 59
40 - 49
30 - 39
20 - 29
10 - 19
0-9
800 600 400 200 0 200 400 600 800
Number of confirmed cases
Male (HSC laboratory) Female (HSC laboratory)
Male (National Testing Programme) Female (National Testing Programme)
Figure 2. Laboratory confirmed cases, by age and sex and source (HSC
Laboratory testing and the National Testing Programme), 2020
80+
70 - 79
60 - 69
50 - 59
Age group
40 - 49
30 - 39
20 - 29
10 - 19
0-9
2000 1500 1000 500 0 500 1000 1500 2000
Rate per 100,000 population
Male Female
Figure 3. Laboratory confirmed cases per 100,000 population, by age and sex,
for all testing data combined, 2020
Presentation of rates per 100,000 enables monitoring of cases taking into account different population
8COVID-19 Monthly Epidemiological Bulletin Up to week 29 (19 July 2020)
Table 1. Laboratory confirmed COVID-19 cases, by sex, for all testing data combined
Sex
Age Group
Male Female Total*
0-9 23 23 46
10 - 19 60 102 162
20 - 29 279 507 786
30 - 39 284 481 765
40 - 49 338 536 874
50 - 59 396 557 953
60 - 69 244 259 503
70 - 79 280 260 540
80+ 458 778 1,236
Unknown - - -
Total 2,362 3,503 5,865
*Unknown sex for one case
Table 2. Laboratory confirmed COVID-19 cases, by Trust, for all testing data
combined
Trust Area Total cases
Belfast 1,355
Northern 752
South Eastern 821
Southern 728
Western 290
Other* 1,920
Unknown -
Northern Ireland 5,866
*Other cases includes those from the National Testing Programme, NIAS, private nursing home residents, pathology services,
GPs and hospices
9COVID-19 Monthly Epidemiological Bulletin Up to week 29 (19 July 2020)
Newry, Mourne And Down
Mid Ulster
Mid And East Antrim
Lisburn And Castlereagh
Fermanagh And Omagh
Derry And Strabane
Causeway Coast And Glens
Belfast
Armagh, Banbridge And Craigavon
Ards And North Down
Antrim And Newtownabbey
0 200 400 600 800 1000 1200 1400 1600
Number of confirmed cases
Cases (HSC laboratory) Cases (National Testing Programme)
Figure 4. Laboratory confirmed cases, by Local Government District (LGD) and
source (HSC Laboratory testing and the National Testing Programme), 2020
10COVID-19 Monthly Epidemiological Bulletin Up to week 29 (19 July 2020)
Northern Ireland
Newry, Mourne And Down
Mid Ulster
Mid And East Antrim
Lisburn And Castlereagh
Fermanagh And Omagh
Derry And Strabane
Causeway Coast And Glens
Belfast
Armagh, Banbridge And Craigavon
Ards And North Down
Antrim And Newtownabbey
0 50 100 150 200 250 300 350 400 450
Rate per 100,000 population
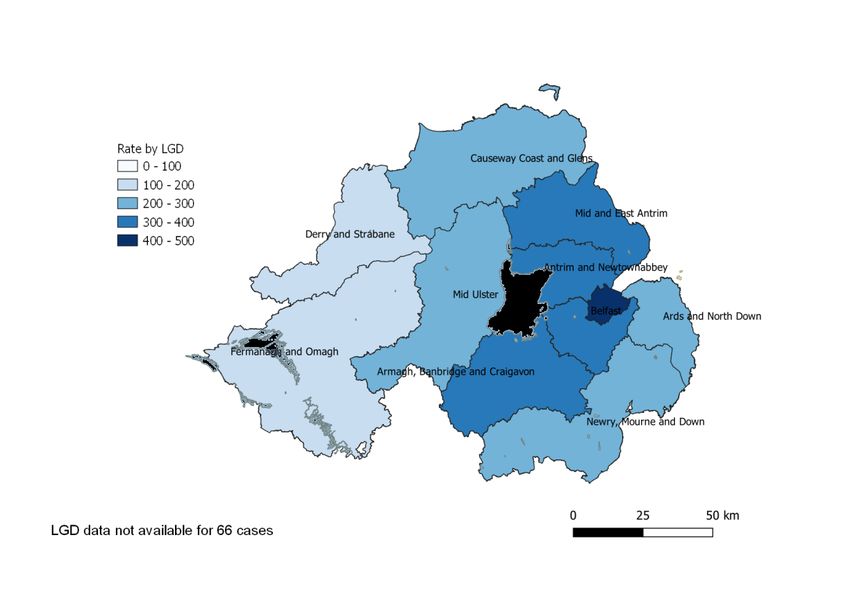
Figure 5. Laboratory confirmed cases per 100,000 population, by Local
Government District (LGD), for all testing data combined, 2020
LGD data not available for 66 cases. Presentation of rates per 100,000 enables monitoring of cases taking into account different
population sizes.
Source: HSC Trust laboratory reports and the National Testing Programme
11COVID-19 Monthly Epidemiological Bulletin Up to week 29 (19 July 2020)
Deprivation
An analysis of COVID-19 related health inequalities relating positive test
cases and COVID-19 related admissions between the most and least
deprived areas of Northern Ireland, including variations across age, sex
and urban and rural areas was published by Department of Health on 17
June 2020.
As at 26 May 2020, the infection rate in the 10% most deprived areas
(379 cases per 100,000 population) was a fifth higher than the rate in the
10% least deprived areas (317 cases per 100,000) and two-fifths higher
than the NI average (272 cases per 100,000). The admission rate for
COVID-19 (confirmed or suspected cases) in the 10% most deprived
areas (581 admissions per 100,000) was almost double the rate in the
10% least deprived areas (317 admissions per 100,000).
12COVID-19 Monthly Epidemiological Bulletin Up to week 29 (19 July 2020)
Care home outbreaks
30 200
180
Cumulative number of care home outbreaks
25
160
Number of care home outbreaks
140
20
120
15 100
80
10
60
40
5
20
0 0
9 10 11 12 13 14 15 16 17 18 19 20 21 22 23 24 25 26 27 28 29
Epidemiological Week
No of care home outbreaks Cumulative care home outbreaks
Figure 6. Confirmed and suspected COVID-19 care home outbreaks in Northern
Ireland, 2020
13COVID-19 Monthly Epidemiological Bulletin Up to week 29 (19 July 2020)
50%
45%
Proportion of care homes
40%
35%
30%
25%
20%
15%
10%
5%
0%
9 10 11 12 13 14 15 16 17 18 19 20 21 22 23 24 25 26 27 28 29
Epidemiological Week
BHSCT NHSCT SEHSCT SHSCT WHSCT NI
Figure 7. Proportion of care homes with confirmed/suspected COVID-19 in Northern
Ireland by Trust, 2020
Table 3. Proportion of care homes with confirmed/suspected COVID-19 outbreaks in
Northern Ireland, by Trust
Cumulative total of
% of care homes Total number of care
Trust Area care homes with
with outbreaks homes
outbreaks in 2020
Belfast 33 39.8% 83
Northern 42 31.6% 133
South Eastern 35 31.8% 110
Southern 34 45.9% 74
Western 20 29.9% 67
Northern Ireland 164 35.1% 467
To week 29, a total of 180 suspected/confirmed COVID-19 care home
outbreaks were reported, involving 164 care homes (35.1% of all Northern
Ireland care homes). 16 care homes have reported more than one outbreak.
The highest proportion of care homes with suspected/confirmed COVID-19
outbreaks (45.9%) were reported from the Southern Trust area.
Source: PHA Health Protection duty room reports from care homes
14COVID-19 Monthly Epidemiological Bulletin Up to week 29 (19 July 2020)
Primary care syndromic surveillance
350
Week 9: First NI case; introduction of GP COVID-19 codes
300
Week 11: Self-isolation advice issued
250
Week 12: UK stay at home directive announced
Rate per 100,000 population
200
150
100
50
0
40 42 44 46 48 50 52 2 4 6 8 10 12 14 16 18 20 22 24 26 28 30 32 34 36 38
Epidemiological Week
ILI 5y ave ILI ARI 5y ave ARI ARI & COVID-19
Figure 8. In-hours consultation rates for influenza- like illness (ILI), acute
respiratory infections (ARI) and COVID-19
The ARI consultation rate trend during 2019/20 increased from week 40
to a peak in week 48 (284.1 per 100,000 population), before declining.
The trend pattern for ILI is similar although rates are much smaller. The
peak occurred earlier than the previous five year average reflecting the
earlier 2019/20 influenza season.
In week 11 ARI consultation rates dramatically fell from 182.8 per
100,000 to 66.6 per 100,000 in week 12, which coincides with the
introduction of self-isolation advice, the stay at home directive
(“lockdown”) and a change to primary care delivery in managing COVID-
19 cases.
15COVID-19 Monthly Epidemiological Bulletin Up to week 29 (19 July 2020)
250 16 4%
Rate per 100,000 population
Rate per 100,000 population
14
200
12 3%
Proportion of calls
10
150
8 2%
100 6
4 1%
50
2
0 0 0%
40 43 46 49 52 3 6 9 12 15 18 21 24 27 30 33 36 39 9 11 13 15 17 19 21 23 25 27 29
Epidemiological Week Epidemiological Week
Proportion of calls
2018-19 2019-20 Rate per 100,000 population
Figure 9. Out-of-hours (OOH) Figure 10. Out-of-hours (OOH)
consultation rates for ARI, 2018/19 – consultation rates for COVID-19, 2020
2019/20
The ARI consultation rate in primary care out-of-hours (OOH) trend
during 2019/20 increased from week 40 to a peak in week 52 (144.2 per
100,000 population), before declining. In week 10 ARI consultation rates
in OOH increased from 76.0 to 108.1 per 100,000 by week 12, before
dramatically falling again to 55.2 per 100,000 in week 13. This follows a
similar trend to in-hours consultations.
The COVID-19 consultation rate in OOH centres during 2020 started
increasing from week 17. It peaked in week 18 at 14.4 per 100,000
before declining. A similar trend was seen in terms of proportion of calls
related to COVID-19, though this proportion has so far remained small.
This trend coincides with the introduction of GP COVID-19 codes and the
change from using established respiratory codes, such as ARI, to
COVID-19.
16COVID-19 Monthly Epidemiological Bulletin Up to week 29 (19 July 2020)
Sentinel testing
Table 4. COVID-19 activity in Northern Ireland Sentinel GP Practices*, week 29, 2020
Period Individuals tested Number positive Proportion positive
Current week 17 - 0.0%
Total 233 3 1.3%
*Sentinel testing programme started 27 April 2020; members of the public so excludes individuals tested in a care home setting
and healthcare workers. Work is ongoing to improve the quality of data to identify sentinel samples so it is subject to change.
COVID centre testing
Table 5. COVID-19 activity in Northern Ireland COVID Centres*, week 29, 2020
Period Individuals tested Number positive Proportion positive
Current week 48 - 0.0%
Total 144 - 0.0%
* One COVID centre operational from 15 June 2020 (BHSCT); virology data in table above from 01 July 2020. Data provided
from the COVID centre directly reported 182 individuals tested between 15 June and 30 June 2020 inclusive. All results were
negative. This data is subject to change as we continue to quality assure the COVID centre information against virology.
Source: HSC Trust laboratory reports and the National Testing Programme
17COVID-19 Monthly Epidemiological Bulletin Up to week 29 (19 July 2020)
Critical care surveillance
40
35
Number of confirmed ICU/HDU cases
30
25
20
15
10
5
0
9 10 11 12 13 14 15 16 17 18 19 20 21 22 23 24 25 26 27 28 29
Epidemiological Week
Figure 11. ICU/HDU COVID-19 cases by sample result week, 2020
80+
70 - 79
60 - 69
50 - 59
Age groups
40 - 49
30 - 39
20 - 29
10 - 19
5-9COVID-19 Monthly Epidemiological Bulletin Up to week 29 (19 July 2020)
To week 29, there have been 134 individuals admitted to critical care
with confirmed SARS-CoV2 reported to the PHA. Week 14 saw the
highest number of ICU reports with a positive result (n=38).
Of the 134 individuals, 72% (n=96) were male. The ages ranged from 26
years to 81 years, with a median age of 58 years.
Source: PHA COVID-19 critical care surveillance online reporting system
19COVID-19 Monthly Epidemiological Bulletin Up to week 29 (19 July 2020)
Mortality surveillance
Medical Certificate of Cause of Death for confirmed /
suspected COVID-19
The Northern Ireland Statistics and Research Agency (NISRA) provide
the weekly number of registered respiratory and COVID-19 deaths
each Friday (here). In week ending 10 July 2020, the proportion of
COVID-19 deaths registered was 3%, and from the beginning of 2020 to
week ending 10 July 2020 the proportion of COVID-19 deaths registered
was 9%.
All-cause excess deaths
500
450
400
Number of deaths
350
300
250
200
Number of deaths Number of deaths (corrected)
150
100
50 Baseline Upper 2 z score limit
0
Year and epidemiological week
Figure 13. Weekly observed and expected number of all-cause deaths in all
ages, week 40 2017 - week 29 2020
In 2020, excess all-cause deaths were reported in epidemiological
weeks 13 to 22. This increase in deaths happened outside the influenza
season and at a time when we know flu was not circulating (here). This
suggests the excess mortality was likely driven by COVID-19 deaths.
Excess deaths were mainly in those over 65 years, which is in line with
20COVID-19 Monthly Epidemiological Bulletin Up to week 29 (19 July 2020)
the age profile of COVID-19 deaths.
Despite delay correction, reported mortality data is still provisional due to
the time delay in registration and observations which can vary from week
to week; not all registrations for the current week will have been included
this bulletin.
Source: Northern Ireland Statistical Research Agency (NISRA)
21COVID-19 Monthly Epidemiological Bulletin Up to week 29 (19 July 2020)
Virology testing surveillance
2500 30%
25%
Total number of individuals tested
2000
Proportion positive
20%
1500
15%
1000
10%
500
5%
0 0%
Total individuals tested (National Testing Programme)*
Total individuals tested (HSC laboratory)*
Proportion Positive
* Total individuals tested include those that were reported as indeterminate
Figure 14. Daily number of individuals tested for SARS-CoV2 and proportion
positive, by source (HSC Laboratory testing and the National Testing
Programme), 2020
To week 29, the total number of individuals tested was 136,658;
positivity 4.3%.The daily proportion testing positive remains relatively
low, but increased in recent weeks due to localised clusters as lockdown
measures have been eased.
22COVID-19 Monthly Epidemiological Bulletin Up to week 29 (19 July 2020)
Table 6. COVID-19 activity in Northern Ireland, for all testing data combined, week 29,
2020
Period Individuals tested Number positive Proportion positive
Current week 8,529 75 0.9%
Total 136,687 5,866 4.3%
Table 7. COVID-19 activity in Northern Ireland (HSC laboratory), week 29, 2020
Period Individuals tested Number positive Proportion positive
Current week 5,082 9 0.2%
Total 95,775 4,911 5.1%
Table 8. COVID-19 activity in Northern Ireland (National Testing Programme), week
29, 2020
Period Individuals tested Number positive Proportion positive
Current week 3,447 66 1.9%
Total 40,912 955 2.3%
Global situation
Globally, up to 19 July 2020, WHO has been notified of 14,073,176
confirmed cases of COVID-19, including 597,583 related deaths.
23COVID-19 Monthly Epidemiological Bulletin Up to week 29 (19 July 2020)
Appendix
PHA Health Protection COVID-19 surveillance systems
The PHA Health Protection Directorate has established the following
surveillance systems to monitor COVID-19 activity across the spectrum
of community and heath care settings. As new systems are developed
they will be added to this report.
Case epidemiology
SARS-CoV2 testing was first developed by the National Reference
Laboratory (Public Health England) for all of the United Kingdom on 24
January 2020. On 7 February 2020, SARS-CoV2 testing was developed
locally by the Regional Virus Laboratory, Belfast Health and Social Care
(HSC) Trust and performed testing across Northern Ireland. Since 23
March, 28 March, 3 April and 13 May respectively, Northern HSC Trust,
Southern HSC Trust, Western HSC and South Eastern HSC Trust
laboratories, have been performing SARS-CoV2 testing.
The PHA Health Protection Directorate laboratory surveillance system
collates SARS-CoV2 laboratory data on all tests from HSC Trust
laboratories.
As an individual may have more than one test for clinical purposes, the
laboratory data is then collated to enable monitoring of individuals rather
than tests performed by laboratories. This is done using the Organism-
Patient-Illness-Episode (OPIE) principle, a standard approach used
across the UK.3 The episode length used nationally is 6 weeks (42
days), and is being reviewed as more data becomes available.
If an individual is infected on two separate occasions by the same
organism (within the episode of infection) they will be represented by
one distinct record. The exception to this is if the first result is negative
which is followed by a positive result on a second occasion, the positive
3
Public Health England. 2016. Laboratory reporting to Public Health England: A guide for diagnostic laboratories.
[ONLINE] Available at:
https://assets.publishing.service.gov.uk/government/uploads/system/uploads/attachment_data/file/739854/PHE_
Laboratory_Reporting_Guidelines.pdf. [Accessed 21 April 2020]
24COVID-19 Monthly Epidemiological Bulletin Up to week 29 (19 July 2020)
result will be recorded rather than the negative. If an individual is
infected on two separate occasions by the same organism (outside the
episode of infection with recovery implied) they will be represented by
two distinct records, regardless of the test result.
All laboratories report a standardised data set which includes individual
demographics, test result and source (location) at the time the specimen
was taken. Data is collated to produce information on the number and
trend of individuals tested at HSC Trust laboratories and the number and
trend of confirmed cases in Northern Ireland and at HSC Trust or Local
Government District level, overall and by age and sex.
National Testing Programme
The National Testing Programme in Northern Ireland consists of drive
through (regional test sites), mobile test unit sites, home testing and
satellite testing of nursing homes.
Everyone in Northern Ireland with symptoms of coronavirus is now
eligible for testing.
Testing is prioritised through the website gov.uk for essential workers
who are self-isolating because they are symptomatic, or have household
members who are symptomatic, to help enable essential workers to
return to work as soon as safe.
Testing is available for the general public through the website nhs.uk.
Testing for non-HSC essential workers and the general public is
currently conducted in drive-through sites operating in Belfast,
Enniskillen, Derry/Londonderry and Portadown. In addition there is a
mobile testing unit currently operating within Northern Ireland.
Home testing can be requested by any individual meeting the criteria
with a test kit(s) being mailed to the individual and household contacts.
Tests are processed in laboratories outside the normal health and social
care network and data fed back to the Public Health Agency via the
Business Services Organisation.
25COVID-19 Monthly Epidemiological Bulletin Up to week 29 (19 July 2020)
The data has been included in the case epidemiology and virology
testing surveillance sections. This data should be interpreted with
caution, when interpreted alongside the HSC laboratory data, because it
includes testing undertaken as part of the outbreak response i.e.
possibly asymptomatic people with a certain age, gender or area profile.
Testing numbers may be skewed to different local government districts
depending on whether an outbreak was detected and managed.
For more information see here.
Care home outbreak surveillance
A care home is a term that includes all nursing homes and residential
homes in Northern Ireland that are registered with the Regulation and
Quality Improvement Agency (RQIA) and can either be HSC Trust or
independent sector owned.
All care homes have a requirement to notify the PHA Health Protection
duty room of suspected outbreaks of any infectious disease. A
suspected outbreak of COVID-19 occurs when two or more residents
and/or staff meet the case definitions for suspected COVID-19,
confirmed COVID-19, influenza-like illness or worsening shortness of
breath.
The PHA Health Protection Directorate care home outbreak surveillance
system collects and collates data on all initial notifications of suspected
COVID-19 outbreaks from the duty room clinical records.
The care home COVID-19 outbreak surveillance system is updated
every day to reflect public health management. If the risk assessment
subsequently excludes an outbreak of the initial notification then the
surveillance data will be updated.
Currently, care homes with multiple facilities, i.e. nursing and residential,
but the same name may be reported as one outbreak, rather than two (if
both units are affected) which may underestimate the number of care
homes affected.
26COVID-19 Monthly Epidemiological Bulletin Up to week 29 (19 July 2020)
Primary care surveillance
a. GP in-hours respiratory syndromic surveillance
The GP in-hours respiratory-related syndromic surveillance system
collects and analyses anonymised respiratory-related data from over
320 GP practices via the Apollo GP Flu Surveillance System (Wellbeing
Software), hereafter referred to as Apollo. This covers approximately
98% of the population.
Based on standardised definitions and extracted using READ codes in
the GP Clinical Systems, respiratory-related data is collected on:
Influenza Like Illness (ILI)
Acute Respiratory Infections (ARI)
Suspected COVID-19 (introduced late March 2020).
Data is analysed on a weekly basis to produce trends of ARI, ILI and
COVID-19 consultation rates for Northern Ireland and at HSC Trust
level.
GP out-of-hours syndromic surveillance
The GP respiratory-related syndromic surveillance system collects and
analyses anonymised ARI, ILI and COVID-19 data from five OOH
practices via Apollo. This system covers 100% of the population and
complements the existing GP surveillance systems that cover in-hours
consultations.
Data is analysed on a weekly basis to produce trends of ARI, ILI and
COVID-19 consultation rated for Northern Ireland and at HSC Trust
level. The system also monitors the number of unscheduled visits and
calls to GPs every day during evenings, overnight, on weekends and on
public holidays.
b. Sentinel testing
The GP sentinel testing surveillance system builds on the existing flu
sentinel testing system where 36 general practices (‘spotter’ practices),
representing approximately 11% of practices across Northern Ireland,
27COVID-19 Monthly Epidemiological Bulletin Up to week 29 (19 July 2020)
are commissioned to carry out flu testing in suspected influenza-like
illness.
Individuals registered at a spotter practice with symptoms of suspected
COVID-19 and who are well enough to self-care in their own home are
referred to a Trust testing facility for testing. The service commenced in
13 spotter practices in Belfast and South Eastern HSC Trust locality at
the end of April and is currently being rolled out to the other 23 practices
in Northern, Southern and Western HSC Trust localities.
Laboratories reports from spotter practices are identified from the
laboratory (virology) surveillance and are collated to produce information
on the number of individuals tested and the number of confirmed cases.
c. COVID centre testing
A COVID centre is a separate facility created as an extension of primary
care to help direct suspected COVID positive patients for assessment.
This keeps practices free to deal with any other medical problems.
Triage will still occur at the practice, via phone followed by referral to the
centre if required.
There are three categories of patient that might be assessed at a COVID
centre:
1. patients symptomatic for COVID, or already test positive who are
clinically worsening: there will also be direct pathways for
investigation and/or admission from the centre
2. patients where there is diagnostic uncertainty: symptoms similar to
COVID but could be another clinical problem ranging from
tonsillitis to meningitis requiring an assessment to exclude or
confirm
3. patients being discharged from hospital: this group will grow with
time but on many occasions will still have a need for clinical
assessment and follow up.
Centres are staffed by GPs, helped by other members of staff, including
nurses, health care workers etc.
28COVID-19 Monthly Epidemiological Bulletin Up to week 29 (19 July 2020)
Centres run from 8am to 10pm and see patients after triage and referral
(by CCG) from the practice.
Patients can either be seen in their car outside the centre if a
straightforward examination is needed, or brought into the centre for
assessment. Patients are told to wait in their car until phoned to come in
to prevent any crowding or grouping of patients.
Centres are hosted by the trusts and operate in each trust area.
Critical care surveillance
The PHA Health Protection COVID-19 critical care online reporting
system captures the incidence of COVID-19 infections in critical care
and aims to improve the understanding of severe disease.
This system should complement critical care data collected by the
Health and Social Care Board for service planning purposes and the
publicly available reports on COVID-19 in critical care Northern Ireland
by the Intensive Care National Audit and Research Centre (iCNARC)
(here).
Data is collected on all individuals admitted to an Intensive Care Unit
(ICU) or High Dependency Unit (HDU) with a positive SARS-CoV2
result, from either before or during the ICU/HDU admission.
As the online reporting system is newly developed, the quality of the
data will continue to improve as it is validated against other information
sources.
Mortality surveillance
Medical Certificate of Cause of Death for confirmed/suspected
COVID-19
The traditional method for examining the number of deaths, and the
range of causes of death, takes information from death certificates that
are reported to the General Registrar’s Office (GRO). The death
certificate contains two parts. Part 1 describes the immediate causes of
death and Part 2 provides information on related conditions that may
also have contributed to death. The numbers of deaths from COVID-19
29COVID-19 Monthly Epidemiological Bulletin Up to week 29 (19 July 2020)
are based on COVID-19 being recorded on any part of the death
certificate (i.e. Part 1 or Part 2).
These include all deaths in which a doctor feels that COVID was either a
direct or indirect cause of death. It includes confirmed cases (deaths
with a positive laboratory result) and probable or suspected cases,
where a doctor assesses that COVID was a cause of death but there is
either no lab test or the test was negative. It captures deaths in all
settings, such as hospitals, care homes, hospices and the community. It
takes up to five days for most deaths to be certified by a doctor,
registered and the data processed, meaning these deaths will be
reported on about a week after they occurred.
All-cause excess deaths
The PHA Health Protection Directorate reports the weekly number of
excess deaths from any cause for Northern Ireland using the Mortality
Monitoring in Europe (EuroMOMO) model. EuroMOMO provides a
coordinated, timely and standardised approach to monitoring and
analysing mortality data across the UK and Europe, to ensure that
signals are comparable between countries. Further information is
available here.
Based on mortality data supplied by NISRA, EuroMOMO produces the
number of expected and observed deaths every week, corrected for
reporting delay and standardised for the population by age group and
region. Excess mortality is reported if the number of observed deaths
exceeds the number of expected deaths, and is defined as a statistically
significant increase in the number of deaths reported over the expected
number for a given point in time.
30COVID-19 Monthly Epidemiological Bulletin Up to week 29 (19 July 2020)
Case definitions
Case definitions are determined by Public Health England, on the advice
of the New and Emerging Respiratory Virus Threats Advisory Group
(NERVTAG). As the pandemic evolves and more evidence emerges the
definitions will change to ensure individuals are appropriately identified.
Suspected case of COVID-19 (as of 18 May 2020)
Patients who meet the following criteria (inpatient definition):
requiring admission to hospital (a hospital practitioner has decided
that admission to hospital is required with an expectation that the
patient will need to stay at least one night) AND
have either clinical or radiological evidence of pneumonia OR
acute respiratory distress syndrome OR
influenza like illness (fever ≥37.8°C and at least one of the
following respiratory symptoms, which must be of acute onset:
persistent cough (with or without sputum), hoarseness, nasal
discharge or congestion, shortness of breath, sore throat,
wheezing, sneezing OR
a loss of, or change in, normal sense of taste or smell (anosmia) in
isolation or in combination with any other symptoms
Patients who meet the following criteria and are well enough to remain in
the community
new continuous cough OR
high temperature OR
a loss of, or change in, normal sense of taste or smell (anosmia)
Individuals with any of the above symptoms but who are well enough to
remain in the community should follow the stay at home guidance and
get tested.
Clinicians should be alert to the possibility of atypical presentations in
patients who are immunocompromised.
Alternative clinical diagnoses and epidemiological risk factors should be
considered.
31COVID-19 Monthly Epidemiological Bulletin Up to week 29 (19 July 2020)
Confirmed case of COVID-19
An individual with clinical symptoms and a positive SARS-CoV2
specimen result.
Critical care COVID-19 case
A case that has either been admitted to an ICU/HDU in Northern Ireland
with a pre-existing positive result for SARS-CoV2, or received a positive
result for SARS-CoV2 post-admission to ICU/HDU.
Medical Certificate of Cause of Death for confirmed/suspected
COVID-19
NISRA define a death associated with COVID-19 as one where COVID-
19 or suspected COVID-19 was mentioned anywhere on the death
certificate, including in combination with other health conditions.
Influenza-like Illness (ILI)
Acute respiratory disease with sudden onset of symptoms and:
at least one systemic symptom (fever ≥37.8°C, myalgia, malaise,
headache) AND
at least one respiratory symptom: cough (with or without sputum),
shortness of breath (and/or wheezing), sore throat, nasal
discharge, sneezing or congestion
32COVID-19 Monthly Epidemiological Bulletin Up to week 29 (19 July 2020)
Further Information
This bulletin is produced by the Health Protection Surveillance Team on
behalf of the Director of Public Health. Correspondence should be
directed to: Professor Hugo van Woerden, Director of Public Health,
Public Health Agency, 12 – 22 Linenhall Street, Belfast, BT2 8BS. Email:
hugo.vanwoerden@hscni.net.
© Public Health Agency: 23 July 2020.
33You can also read