Economic activity and social change in the UK, real-time indicators: 13 May 2021
←
→
Page content transcription
If your browser does not render page correctly, please read the page content below
Statistical bulletin

Economic activity and social change in the
UK, real-time indicators: 13 May 2021
Early experimental data and analysis on economic activity and social change in the UK.
These faster indicators are created using rapid response surveys, novel data sources
and experimental methods.

Contact:                           Release date:                      Next release:
Issie Davies                       13 May 2021                        20 May 2021
faster.indicators@ons.gov.uk
+44 (0)1633 651583

                                   Notice
13 May 2021
This bulletin was previously published in the Coronavirus section of the website. It has a new title and page
location from this week (13 May 2021) onwards, but will continue to present real-time indicators of economic
activity and social change. All previous versions of the bulletin can be found on the Coronavirus and the latest
indicators for the UK economy and society previous releases page.

20 May 2021
On 20 May 2021 we revised the online weekly price changes dataset to correct an issue that affected the results
for week ending 9th May. The issue was caused by a change in processing which resulted in some incorrectly
matched products. Changes at the aggregate level were small but the headline growth did change from 0.0% to
0.1%. No other time periods in the prices data were affected by this, and the data have been revised in the latest
release.

                                                                                                               Page 1 of 23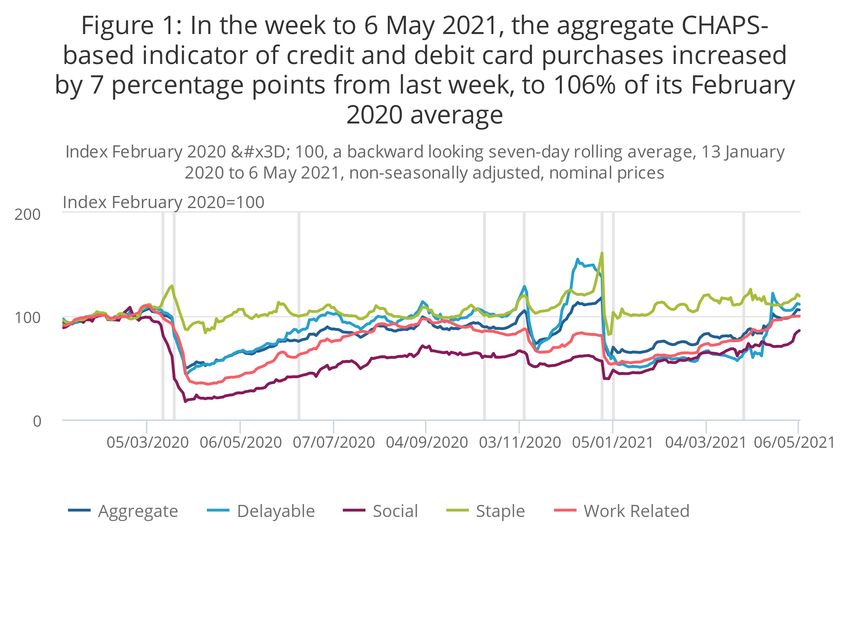
Table of contents
1. Main points

2. Latest indicators at a glance

3. UK spending on debit and credit cards

4. Business impacts and insights

5. Value Added Tax returns

6. Online job adverts

7. OpenTable seated diner reservations

8. Retail footfall

9. Ship visits

10. Social impact of the coronavirus

11. Roads and traffic camera data

12. Data

13. Glossary

14. Measuring the data

15. Strengths and limitations

16. Related Links

                                           Page 2 of 23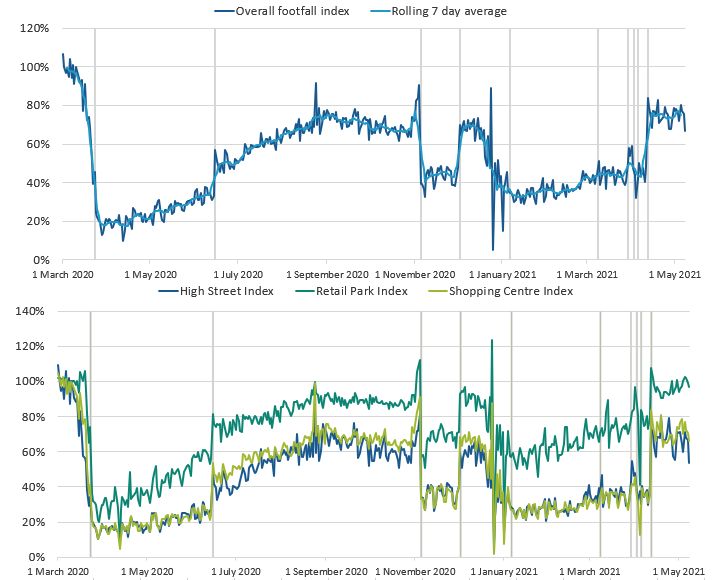
1 . Main points
In the week to 6 May 2021, the aggregate CHAPS-based indicator of credit and debit card purchases
increased by 7 percentage points from the previous week to exceed pre-pandemic levels at 106% of its
February 2020 average; this was in-part driven by a notable rise in “social” spend (which refers to things
such as travel and eating out) (Bank of England’s CHAPS data). See Section 3.
According to initial results from Wave 30 of the BICS (19 April to 2 May 2021), the proportion of the
workforce of all UK businesses on furlough was 11%, a slight decrease from 13% in the previous wave
(Business Insights and Conditions Survey (BICS)). See Section 4.
In March 2021, a net 7% of 34,940 firms reported an increase in turnover compared with March 2020; this
was driven by turnover estimates increasing in all major industries (services, production, construction, and
agriculture) (Her Majesty’s Revenue and Customs). See Section 5.
On 7 May 2021, the proportion of UK online job adverts for "catering and hospitality" was above pre-
pandemic levels at 103% of its February 2020 average level, an increase of 46 percentage points since 9
April 2021, just before hospitality restrictions began to ease in the UK (Adzuna). See Section 6.
In the week to 10 May 2021, the average estimate of UK-seated diners was 60% of its level in the
equivalent week of 2019; down 5 percentage points from the previous week but still consistently higher
than levels seen before the recent easing of restrictions across the UK (OpenTable). See Section 7.
In the week to 8 May 2021, overall retail footfall in the UK saw a weekly decrease of 4% and was at 75% of
the level seen in the equivalent week of 2019; this level remains consistent with that seen in recent weeks,
since the easing of lockdown restrictions in England on 12 April 2021, when footfall volumes grew
substantially higher (Springboard). See Section 8.
There was an average of 323 daily ship visits in the week ending 9 May 2021, a decrease of 10% from the
previous week (358) but broadly unchanged when compared with the equivalent week in 2019 (321)
(exactEarth). See Section 10.
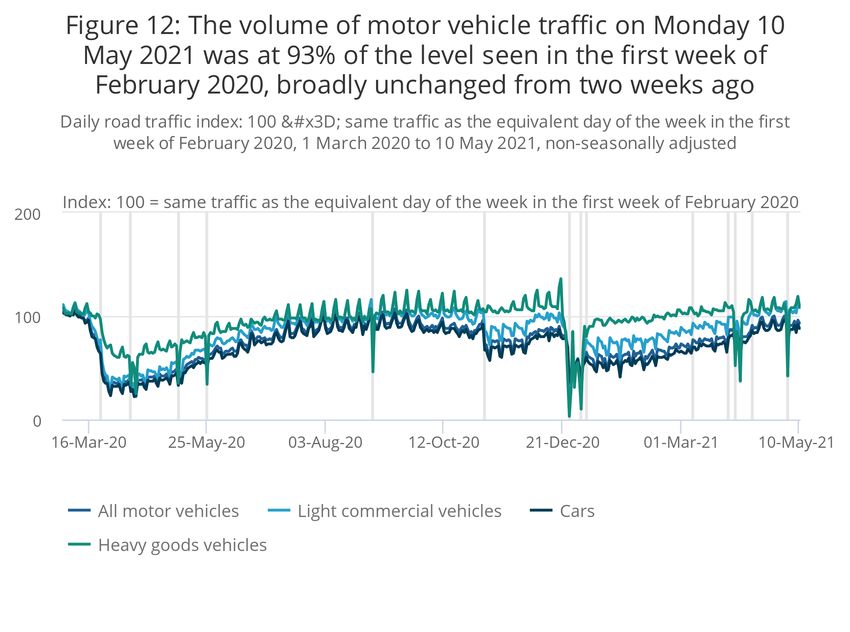
The volume of motor vehicle traffic on Monday 10 May 2021 was at 93% of the level seen in the first week
of February 2020, broadly unchanged from two weeks ago (Department for Transport (DfT)). See Section
11.
There were 13,768 company incorporations in the week to 7 May 2021, an 11% decrease from the
previous week (15,476), but 19% higher than the equivalent week in 2019 (11,558) (Companies House).
See the accompanying dataset.
There were 6,019 voluntary dissolution applications in the week to 7 May 2021, a 14% decrease from the
previous week (6,976) but 34% higher than the equivalent week of 2019 (4,505) (Companies House). See
the accompanying dataset.
The overall price of items in the online food and drink basket was unchanged in the latest week ending 9
May 2021; the main downward contribution came from "bread and cereals", but this was offset mostly by
price increases for "sugar, jam, syrup, chocolate and confectionery" (Online price collection). See
accompanying dataset.
Results presented throughout this bulletin are experimental and may be subject to revision.
2 . Latest indicators at a glance
This week, the following indicators are featured in this section of the bulletin only:
Page 3 of 23Companies House company incorporations and voluntary dissolution applications
Online price changes
Energy Performance Certificate (EPC) lodgements
3 . UK spending on debit and credit cards
These data series are experimental faster indicators for estimating UK spending on credit and debit cards. They
track the daily Clearing House Automated Payment System (CHAPS) payments made by credit and debit card
payment processors to around 100 major UK retail corporates. These payments are the proceeds of recent credit
and debit card transactions made by customers at their stores, both via physical and via online platforms.
More information on the indicator is provided in the accompanying Bank of England methodology article.
Companies are allocated to one of four categories based on their primary business:
"staples" refers to companies that sell essential goods that households need to purchase, such as food and
utilities
"work-related" refers to companies providing public transport or selling petrol
"delayable" refers to companies selling goods whose purchase could be delayed, such as clothing or
furnishings
"social" refers to spending on travel and eating out
Page 4 of 23Figure 1: In the week to 6 May 2021, the aggregate CHAPS-based indicator of credit and debit card
purchases increased by 7 percentage points from last week, to 106% of its February 2020 average
Index February 2020 = 100, a backward looking seven-day rolling average, 13 January 2020 to 6 May 2021, non-seasonally
adjusted, nominal prices
Source: Office for National Statistics and Bank of England calculations
Notes:
1. Users should note the daily payment data is the sum of card transactions processed up to the previous
working day, so there is a slight time lag when compared with real-life events on the chart.
2. The vertical lines indicate key events. In order, the events are: PM COVID-19 announcement; lockdown
begins; some non-essential shops allowed to reopen; local COVID-19 alert levels; national restrictions
begin in England; Christmas Eve; lockdown begins in England and Scotland; ‘stay at home’ rule ends in
England; re-opening of non-essential shops, and pubs and restaurants (outdoors) in England.
3. Percentage point difference is derived from current week and previous week index before rounding.
Figure 1 shows changes in the value of CHAPS payments received by large UK corporates from their credit and
debit card processors, "merchant acquirers".
In the week to 6 May 2021, the CHAPS-based indicator of credit and debit card purchases in aggregate
increased by 7 percentage points from the previous week to 106% of its February 2020 average. In this latest
week, "social" spending rose by 12 percentage points, "delayable" by 6 and "staples" by 5 percentage points,
whilst "work-related" was broadly unchanged. In the latest week, both "staples" and "delayable" spending were
above their February 2020 levels at 119% and 111% respectively. On the other hand, "social" and "work-related"
spending were at 86% and 100% of their average levels in February 2020, respectively. The latest increase
follows the easing of restrictions in Northern Ireland on 30 April 2021 and Scotland and Wales on 26 April 2021.
Page 5 of 23The full data time series available for data on UK spending on debit and credit cards can be found in the
accompanying dataset.
4 . Business impacts and insights
Initial results from Wave 30 of the Business Insights and Conditions Survey (BICS) cover the reference period 19
April to 2 May 2021, with a response rate of 20.4% (7,922 responses). The survey was live for the period 4 to 11
May 2021.
These dates should be kept in mind in relation to local and national restrictions in place during the reference
period and the date when the business responded.
Figure 2: The proportion of the workforce of all UK businesses (excluding those
permanently ceased trading) on furlough has decreased to 11%, down from 13% in the
previous wave
Headline indicators from the Business Insights and Conditions Survey (BICS), 19 April to 11 May 2021
Notes:
1. Initial weighted results, Wave 30 of Office for National Statistics' (ONS') Business Insights and Conditions
Survey (BICS).
2. A detailed description of the weighting methodology and the weights used for each variable is available in
Business Insights and Conditions Survey (BICS).
3. Survey questions on stock level and capital expenditure are not included in Wave 30 survey results. These
questions will be rotated in future survey waves.
Download the data
Across all UK industries in Wave 30:
79% of businesses had been trading for more than the last two weeks (an increase from 73% in Wave 29)
4% of businesses had started trading within the last two weeks after a pause in trading
5% of businesses had paused trading but intend to restart in the next two weeks (broadly unchanged from
4% in Wave 29)
7% of businesses had paused trading and do not intend to restart in the next two weeks (a decrease from
10% in Wave 29)
4% of businesses had permanently ceased trading (broadly unchanged from 3% in Wave 29)
Page 6 of 23Table 1: 14% of currently trading businesses experienced an increase in turnover compared with what is
expected for this time of year, a rise from 6% in early January 2021
Impact on turnover, businesses currently trading, weighted by turnover UK, 19 April to 2 May 2021
All Industries
Turnover has increased by more than 50% 1%
Turnover has increased between 20% and 50% 4%
Turnover has increased by up to 20% 9%
Turnover has not been affected 43%
Turnover has decreased by up to 20% 15%
Turnover has decreased between 20% and 50% 10%
Turnover has decreased by more than 50% 9%
Not sure 9%
Source: Office for National Statistics – Business Insights and Conditions Survey (BICS)
Notes
1. Initial weighted results Wave 30 of the Office for National Statistics' (ONS') Business Insights and
Conditions Survey (BICS); all businesses.
2. Table may not sum to 100% because of rounding and percentages less than 1% being removed for
disclosure purposes.
3. Businesses were asked for their experiences for the reference period 19 April to 2 May 2021. However, for
questions regarding the last two weeks, businesses may respond from the point of completion of the
questionnaire (4 to 11 May 2021).
The initial result of 11% of businesses' workforce on furlough leave in April 2021 equates to approximately 2.8
million people. This number is based on multiplying the BICS weighted furlough proportions by HM Revenue and
Customs (HMRC) CJRS official statistics eligible employments1 for only those industries covered by the BICS
sample.
Notes for: Business impacts and insights
1. An "employment" in the HMRC CJRS Official Statistics is defined as anyone who meets the scheme
criteria set out within the published guidance, and data comes from the whole population of HMRC CJRS
claims (those applied) and PAYE Real Time Information systems (RTIs). The assessment of whether a
person was employed on the qualifying dates is based on the methodology used for the joint HMRC and
ONS statistics release, Earnings and employment from Pay As You Earn Real Time Information.
5 . Value Added Tax returns
New reporters
The new reporters index measures the number of UK firms sending Value Added Tax (VAT) returns to HM
Revenue and Customs (HMRC) for the first time, which is related to the number of firm creations.
Page 7 of 23Figure 3: There were 21,180 new VAT reporters in April 2021, this is above the April 2020 and April 2019
levels when there were 13,690 and 19,140, respectively
The number of new firm reporters, January 2015 to April 2021, non-seasonally adjusted, UK
Source: Her Majesty’s Revenue and Customs (HMRC)
Notes:
1. The three-month average for new reporters has been presented as a backward-looking rolling three-month
average. Previously, the rolling average calculation was presented at the midpoint. The change does not
affect the calculation of the series, and only shifts the time series forward one month.
There were 21,180 new VAT reporters in the UK in April 2021, a decrease of 16% from 25,320 in March 2021.
However, this is higher than the number seen in April 2020 (13,690) and in April 2019 (19,140). This is also
higher than the 2015 to 2019 longer-term average (20,908).
Business turnover estimates
Turnover diffusion indices are an aggregate measure used to track whether the majority of firms are reporting an
increase or decrease in turnover in their VAT returns. They are calculated as the percentage of firms with
increasing turnover minus the percentage with decreasing turnover.
The heatmap in Figure 4 is a visual way of showing the VAT diffusion indices based on the standard deviation
from their historical 2008 to 2019 average. Larger deviations are more darkly coloured, with red representing a
negative change, while teal represents a positive change when compared with the previous period.
Page 8 of 23Figure 4: A net 7% of 34,940 firms reported an increase of turnover in March 2021 compared
with March 2020
Heatmap of business turnover estimates, UK, diffusion index standard deviation from the mean, up to Quarter 1
(Jan to Mar) 2021 and March 2021. New reporters, UK, up to April 2021
Notes:
1. Agri - Agriculture, forestry and fishing, All - All industries, SA - Seasonally adjusted, NSA - Not seasonally
adjusted.
2. More information is available in the methodology article.
Download the data
The month-on-year all industry turnover estimate for March 2021 shows that a net 7% of 34,940 firms reported an
increase in turnover compared with March 2020. Across all major industries (services, production, construction,
agriculture), turnover estimates increased over this period.
The month-on-month all-industry turnover estimate for March 2021 compared with February 2021 shows an equal
number of 37,300 firms (net 0%) reported increasing or decreasing turnover compared with February 2021.
6 . Online job adverts
Job adverts by category
These figures are experimental estimates of online job adverts provided by Adzuna, an online job search engine,
by category and by UK countries and English regions. The number of job adverts over time is an indicator of the
demand for labour. The Adzuna categories used do not correspond to Standard Industrial Classification (SIC)
categories, so these values are not directly comparable with our Vacancy Survey.
Data for 30 April 2021 were unavailable in last week's release (6 May) so have been imputed using linear
interpolation. The latest data for 7 May 2021 are unaffected by this. Given the imputation of last week's data,
fortnightly comparisons are made in this week's bulletin rather than weekly to ensure meaningful analysis.
Figure 5: On 7 May 2021, UK online job adverts for "catering and hospitality" were 103% of
their February 2020 average volume, up 46 percentage points since 9 April 2021
Index of job adverts, average job adverts in February 2020, 4 January 2019 to 7 May 2021, non-seasonally
adjusted
Notes:
1. Further category breakdowns are included in the Online job advert estimates dataset and more details on
the methodology can be found in Using Adzuna data to derive an indicator of weekly vacancies.
Page 9 of 23Download the data
Excluding the "unknown" category, compared with 23 April 2021, the proportion of UK online job adverts on 7
May 2021 was at 107% of its February 2020 average level, an increase of 4 percentage points compared with
two weeks ago. This is the first time that there have been more online job adverts than the equivalent week of
2019.
The volume of online job adverts increased in 19 out of the 28 categories on Friday 7 May 2021. The largest
fortnightly increase was for "catering and hospitality", which rose by 22 percentage points to 103% of its February
2020 average level. This is a continuation of the recent strong upward trend for this category, having risen by 46
percentage points since 9 April 2021 just before the first easing of hospitality restrictions in the UK on 12 April
2021. This is also the first time this category has exceeded its February 2020 average level since 13 February
2020.
Another notable increase was in "transport / logistics / warehouse", which rose by 18 percentage points from a
fortnight ago to 235% of its February 2020 average level on 7 May 2021. This category has seen a substantial
rise since the start of the year, growing by 136 percentage points since 15 January 2021 and now exceeds both
2019 and 2020 levels in the latest week. It is thought that jobs within this sector are taking longer to fill and
accumulating, which is contributing in-part to the higher overall vacancy numbers for this category.
Job adverts by region
Figure 6: On 7 May 2021, the volume of online job adverts had increased in all UK countries
and English regions except Northern Ireland when compared with two weeks ago
Index of job adverts average job adverts in February 2020, 4 January 2019 to 7 May 2021, non-seasonally
adjusted
Download the data
On 7 May 2021, the number of UK online job adverts increased across all UK countries and English regions when
compared with two weeks ago, apart from in Northern Ireland, where job adverts decreased by 28 percentage
points. This notable decline for Northern Ireland can in part be attributed to a relatively large drop in adverts from
a single source. Users should also note more generally that the NI region is subject to higher fluctuation than
other regions due to its smaller sample size.
The largest fortnightly increase was recorded in the Yorkshire and The Humber, where the proportion of online
job adverts rose by 6 percentage points to 122% of its February 2020 average level
7 . OpenTable seated diner reservations
OpenTable is a leading provider of online restaurant reservations, with daily data being publicly available in their
The state of the industry dashboard. These data show the impact of recent events and restrictions on the
hospitality industry using a sample of restaurants on the OpenTable network across all channels, that is, online
reservations, phone reservations, and walk-ins.
Page 10 of 23Figure 7: In the week to Monday 10 May 2021, estimates of UK seated diners were at 60% of their level in
the equivalent week of 2019, a decrease of 5 percentage points from the previous week
Percentage of seated diners, 7-day average, year-on-two-year comparison, week ending 24 February 2020 to week ending 10
May 2021, UK, London and Manchester
Source: OpenTable
Notes:
1. Data show the percentage of seated diners when compared with the same week in 2019. For example,
Week 11 2021 is compared with Week 11 2019.
2. Please note that data for Manchester are only available from week ending 16 November 2020.
In the week to Monday 10 May 2021, the average estimate for UK seated diner reservations was 60% of the level
seen in the equivalent week of 2019. This follows a substantial increase since pubs and restaurants in England re-
opened on 12 April 2021, prior to which estimates were 0% of their 2019 level. However, this proportion of seated
diners as a percentage of their 2019 level has decreased by 5 percentage points from the previous week, the first
week to see a decrease in this figure since the re-opening of hospitality in England.
The equivalent figures for London in the week ending 10 May 2021 decreased slightly by 3 percentage points
from last week to 37% of its level in the equivalent week of 2019. However, estimates for seated diners in
Manchester saw a notable increase of 10 percentage points to 102% of its level in the equivalent week of 2019.
8 . Retail footfall
Page 11 of 23National retail footfall
National footfall figures are supplied by Springboard, a provider of data on customer activity. It measures the
following for overall UK retail footfall, as well as by high street, retail park, and shopping centre categories:
daily retail footfall as a percentage of its level on the same day of the equivalent week of 2019; for
example, Saturday 8 May 2021 is compared with Saturday 4 May 2019
total weekly retail footfall as a percentage of its level in the equivalent week of 2019
the percentage change in weekly footfall compared with the previous week; for example, Week 18 of 2021
is compared with Week 17 of 2021
Springboard's weekly data are defined over a seven-day period running from Sunday to Saturday; Week
18 of 2021 therefore refers to the period Sunday 2 May 2021 to Saturday 8 May 2021
Page 12 of 23Figure 8: In the week to 8 May 2021, overall retail footfall in the UK decreased by 4% from the previous
week and was at 75% of its level in the equivalent week of 2019
Volume of retail footfall, percentage compared with the equivalent day of the equivalent week of 2019, 1 March 2020 to 8 May
2021
Source: Springboard and the Department for Business, Energy and Industrial Strategy
Notes:
1. The vertical lines indicate key events. In order, the events are; first national lockdowns imposed; lockdown
restrictions begin to ease across the UK; circuit-breaker lockdown in England; regional restrictions begin in
England; national lockdown begins in England; re-opening of schools in England; "stay at home" rule ends
in England; Good Friday 2021; Easter Monday 2021; reopening of non-essential retail in England and
Wales.
According to Springboard, in the week to 8 May 2021, overall retail footfall in the UK saw a weekly decrease of
4% to 75% of the level seen in the equivalent week of 2019. This level is consistent with recent weeks since the
easing of lockdown restrictions in England on 12 April 2021 when footfall volumes grew substantially higher.
Consistent with the trend observed since the beginning of the year, in the week to 8 May 2021, footfall at retail
parks remained substantially higher than that at high streets and shopping centres, at 99% of its level in the
equivalent week of 2019. The equivalent figures for footfall at shopping centres and high streets were 73% and
64%, respectively.
All retail locations saw slight week-on-week decreases in footfall, with high streets seeing the largest decrease of
7%. Footfall at shopping centres decreased by 2%, while retail parks fell by 1% in the week ending 8 May 2021.
Page 13 of 23Figure 9: Retail footfall in the week to 8 May 2021 was strongest in Northern Ireland at 92% of its level in
the equivalent week of 2019
Volume of overall daily retail footfall, percentage of the level recorded on the same day of the equivalent week of 2019, UK
regions, 1 March 2020 to 8 May 2021
Source: Springboard and the Department for Business, Energy and Industrial Strategy
Notes:
1. Prior to 3 January 2021 daily indices were generated by comparing footfall against its level on the same
day of the equivalent week the year before. From this date onwards they were generated by comparing
footfall against its level on the same day of the equivalent week in 2019. For a two-day period, from 1
January 2021 to 2 January 2021 daily indices were therefore generated using a 2021 versus 2020
comparison.
According to Springboard, in the week to 8 May 2021, retail footfall was strongest in Northern Ireland at 92% of
the level seen in the equivalent week of 2019. In the same period, retail footfall was weakest in Wales and the
East Midlands, each at 71% of their level in the equivalent week of 2019. Across all UK regions, retail footfall
remains below its level in the equivalent week of 2019.
All countries and regions of the UK except for Northern Ireland saw decreases in retail footfall between the weeks
ending 1 May 2021 and 8 May 2021. Northern Ireland saw its second successive large weekly rise in footfall by
28% in the latest week. This follows the easing of lockdown restrictions in Northern Ireland on 30 April 2021, prior
to which its retail footfall levels were considerably lower. Meanwhile, the North & Yorkshire saw the largest week-
on-week decrease in retail footfall by 9%.
Page 14 of 239 . Ship visits
These shipping indicators are based on counts of all vessels, and cargo and tanker vessels. As discussed in
Faster indicators of UK economic activity: shipping, we expect the shipping indicators to be related to the import
and export of goods.
The coronavirus (COVID-19) pandemic first began to affect the level of shipping visits from the week ending 29
March 2020. For this reason, average ship visits in the latest week are compared with the equivalent week in
2019 rather than 2020.
Figure 10: There was anaverage of 323dailyship visits in the week ending 9 May 2021, a decrease of 10%
from the previous week (358) and broadly unchanged with the equivalent week in 2019 (321)
Daily movements in shipping visits, UK, seasonally adjusted, 1 December 2019 to 9 May 2021
Source: exactEarth
The 10% weekly decrease in average daily ship visits in the week ending 9 May 2021 can be attributed to
decreased activity in numerous UK ports including Southampton, Dover, Portsmouth and Felixstowe.
Page 15 of 23Figure 11: There was an average of 103 cargo and tanker ship visits in the week ending 9 May 2021, a 2%
decrease from the previous week (105) but 13% higher than the equivalent week in 2019 (91)
Daily movements in shipping visits, UK, seasonally adjusted, 1 December 2019 to 9 May 2021
Source: exactEarth
Notes:
1. See the accompanying dataset for the notable dates and weather events.
10 . Social impact of the coronavirus
This section includes some provisional results from the Opinions and Lifestyle Survey (OPN) covering the period
5 to 9 May 2021. The survey went out to 5,922 adults in Great Britain and had a response rate of 70%.
Further information to help understand the impact of the coronavirus (COVID-19) pandemic on people,
households, and communities in Great Britain, will be available in Coronavirus and the social impacts on Great
Britain due to be published 14 May 2021.
Travelling to work
In the period ending 9 May 2021, the proportion of working adults in Great Britain who in the last seven days:
Page 16 of 23travelled to work (either exclusively or in combination with working from home) remained unchanged from
the previous week at 60%
worked exclusively from home remained broadly unchanged from the previous week at 26%
neither travelled to work nor worked from home remained unchanged from the previous week at 13%
Shopping
Of the 95% of adults that reported they had left home in the last seven days, the proportion that did so to shop for
food and medicine remained unchanged from the previous week at 72%.
The proportion of these adults who shopped for things other than food and medicine in the last seven days saw a
slight increase of 2 percentage points to 30% compared with the previous week.
11 . Roads and traffic camera data
Road traffic in Great Britain
According to Department for Transport (DfT) non-seasonally adjusted road traffic data, the volume of all motor
vehicle traffic on Monday 10 May 2021 was 93% of the level seen on Monday of the first week of February 2020.
This is broadly unchanged from 94% recorded on Monday 26 April 2021. Week-on-two-week comparisons are
made this week to avoid comparing against the lower level of motor vehicle traffic seen in the previous week
because of the May Bank Holiday.
Compared with two weeks ago, light commercial vehicle traffic and heavy goods vehicle traffic both remained
broadly unchanged at 108% and 109% of the levels seen on the same day of the first week in February 2020,
respectively. Car traffic remained unchanged from two weeks ago at 88% of the level seen on the same day of
the first week in February 2020.
Page 17 of 23Figure 12: The volume of motor vehicle traffic on Monday 10 May 2021 was at 93% of the level seen in the
first week of February 2020, broadly unchanged from two weeks ago
Daily road traffic index: 100 = same traffic as the equivalent day of the week in the first week of February 2020, 1 March 2020 to
10 May 2021, non-seasonally adjusted
Source: Department for Transport road traffic statistics: management information
Notes:
1. The vertical lines indicate key events. In order, these events are: First National lockdowns imposed; Easter
Weekend; Bank holiday; Bank holiday; Bank holiday; National restrictions begin in England; Christmas
Day; New Year's Day; Lockdowns announced in England and Scotland; Easing of lockdown in England;
'Stay at home' rule ends in England; Easter Weekend; Reopening of non-essential retail in England; Bank
Holiday.
The daily DfT estimates are indexed to the first week of February 2020 and the comparison is with the same day
of the week. The data provided are useful as an indication of traffic change rather than actual traffic volumes.
More information on the methods, quality and economic analysis for these indicators can be found in the DfT
methodology article.
Traffic camera activity
Traffic cameras are a valuable source for understanding the level of activity in towns and cities as well as
changing patterns of mobility. Further information on the methodology used to produce these data is available in
our methodology article and Data Science Campus blog.
In the accompanying dataset, the following categories are available as non-seasonally adjusted, seasonally
adjusted and trend data:
Page 18 of 23cars
motorbikes (only available for London and the North East)
buses
trucks
vans
pedestrians and cyclists
The categories are available for the following regions, which give a broad coverage across the UK and represent
a range of different-sized settlements in urban and rural settings:
London
Greater Manchester
North East
Northern Ireland
Southend
Reading
In the week to 9 May 2021, traffic camera activity in London when compared with same week of 2020 (week
ending 3 May 2020) showed that average counts for:
cars were higher by 69%
motorbikes were lower by 5%
buses were higher by 26%
trucks were higher by 47%
vans were higher by 50%
pedestrians and cyclists were higher by 63%
Equivalent figures for the North East in the week to 9 May 2021 were as follows:
Page 19 of 23cars were higher by 57%
motorbikes were higher by 23%
buses were higher by 91%
Trucks were higher by 39%
vans were higher by 34%
pedestrians and cyclists were higher by 27%
Similarly, the equivalent figures for Greater Manchester in the week to 9 May 2021 were as follows:
cars were higher by 69%
buses were higher by 41%
trucks were higher by 7%
vans were higher by 34%
pedestrians and cyclists were higher by 36%
Data for all six available regions can be found in the accompanying dataset.
Page 20 of 2312 . Data
UK spending on credit and debit cards
Dataset | Released 13 May 2021
Experimental indicator for monitoring UK retail purchases derived from the Bank of England's Clearing
House Automated Payment System (CHAPS) data.
Shipping indicators
Dataset | Released 13 May 2021
Experimental weekly and daily ship visits dataset covering UK ports.
Traffic camera activity
Dataset | Released 13 May 2021
Experimental daily traffic camera counts data for busyness indices covering the UK.
Online job advert estimates
Dataset | Released 13 May 2021
Experimental job advert indices covering the UK online job market.
Company Incorporations and Voluntary Dissolutions
Dataset | Released 13 May 2021
The number of weekly Companies House Incorporations and Voluntary Dissolution applications accepted.
Value Added Tax
Dataset | Released 13 May 2021
Value Added Tax (VAT) turnover and expenditure diffusion indexes and new VAT reporters using data from
HM Revenue and Customs (HMRC) VAT returns.
Online weekly price changes
Dataset | Released 13 May 2021
Experimental estimates of online price changes for a selection of food and drink products from several large
UK retailers.
13 . Glossary
Faster indicator
A faster indicator provides insights into economic activity using close-to-real-time big data, administrative data
sources, rapid response surveys or Experimental Statistics, which represent useful economic and social concepts.
Company incorporations
Incorporations are when a company is added to the Companies House register of limited companies. This can
also include where an existing business applies to become a limited company, where it was not one before.
Voluntary dissolution applications
A voluntary dissolution application is when a company applies to begin dissolution proceedings. As such, they
effectively chose to be removed from the Companies House register. For a company to be eligible to voluntarily
dissolve, it should not have completed any trading activity for a period of three months.
Page 21 of 23New reporter
A new reporter is defined as a firm with a Value Added Tax (VAT) reference (that is, firm identification number)
which has not previously reported its VAT returns. New reporters are published within one month of the end of
the reporting period. The new reporting behaviour measure is classified by the month the data were received by
HM Revenue and Customs (HMRC), known as the receipt date, which is not necessarily the same as the
reference period (the period for which the VAT return is made).
Diffusion index
The diffusion index tracks the growth in turnover and expenditure of firms. It is constructed to lie between
negative 1 and 1. For example, if 65% of firms have increasing turnover, 30% have decreasing turnover and 5%
turnover remains unchanged, then the diffusion index is 0.35.
14 . Measuring the data
UK Coronavirus Restrictions
A full overview of coronavirus (COVID-19) restrictions for each of the four UK constituent countries can be found
here: -
England
Scotland
Wales
Northern Ireland
These restrictions should be considered when interpreting the data featured throughout this bulletin.
15 . Strengths and limitations
Information on the strengths and limitations of the indicators in this bulletin is available in the Coronavirus and the
latest indicators of the UK economy and society methodology.
Page 22 of 2316 . Related Links
Coronavirus (COVID-19) latest data and analysis
Webpage | Updated as and when data become available
Latest data on the coronavirus (COVID-19) in the UK and its effect on the economy and society.
Coronavirus and the social impacts on Great Britain: 14 May 2021
Bulletin | 14 May 2021
Latest indicators from the Opinions and Lifestyle Survey
Deaths registered weekly in England and Wales, provisional: week ending 30 April 2021
Bulletin | Released 11 May 2021
Provisional counts of deaths registered in England and Wales, including deaths involving COVID-19, in the
latest weeks for which data are available.
Coronavirus (COVID-19) Infection Survey, UK: 14 May 2021
Bulletin | Released 14 May 2021
Initial data from the COVID-19 Infection Survey (delivered in partnership with IQVIA, Oxford University and
UK Biocentre).
Page 23 of 23You can also read