Investor Presentation August 2020 - Mapletree ...

Page created by Angel Sims
 
CONTINUE READING
Investor Presentation August 2020 - Mapletree ...
Investor Presentation
August 2020
Investor Presentation August 2020 - Mapletree ...
Important Notice
This presentation shall be read in conjunction with Mapletree Industrial Trust’s (“MIT”) financial results for First Quarter
Financial Year 2020/2021 in the SGXNET announcement dated 21 July 2020.

This presentation is for information only and does not constitute an offer or solicitation of an offer to sell or invitation to
subscribe for or acquire any units in Mapletree Industrial Trust (“Units”).

The past performance of the Units and MIT is not indicative of the future performance of MIT or Mapletree Industrial Trust
Management Ltd. (the “Manager”).

The value of Units and the income from them may rise or fall. Units are not obligations of, deposits in or guaranteed by the
Manager or any of its affiliates. An investment in Units is subject to investment risks, including the possible loss of the
principal amount invested. Investors have no right to request the Manager to redeem their Units while the Units are listed. It is
intended that unitholders may only deal in their Units through trading on the Singapore Exchange Securities Trading Limited
(“SGX-ST”). Listing of the Units on the SGX-ST does not guarantee a liquid market for the Units.

This presentation may also contain forward-looking statements that involve risks and uncertainties. Actual future
performance, outcomes and results may differ materially from those expressed in forward-looking statements as a result of
risks, uncertainties and assumptions. Representative examples of these factors include general industry and economic
conditions, interest rate trends, cost of capital, occupancy rate, construction and development risks, changes in operating
expenses (including employees wages, benefits and training costs), governmental and public policy changes and the
continued availability of financing. You are cautioned not to place undue reliance on these forward-looking statements, which
are based on current view of management on future events.

Nothing in this presentation should be construed as financial, investment, business, legal or tax advice and you should
consult your own independent professional advisors.

2
Investor Presentation August 2020 - Mapletree ...
Contents

    01   Key Highlights
    02   Overview of Mapletree Industrial Trust
    03   Portfolio Update
    04   1QFY20/21 Financial Highlights
    05   Outlook and Strategy

3
Investor Presentation August 2020 - Mapletree ...
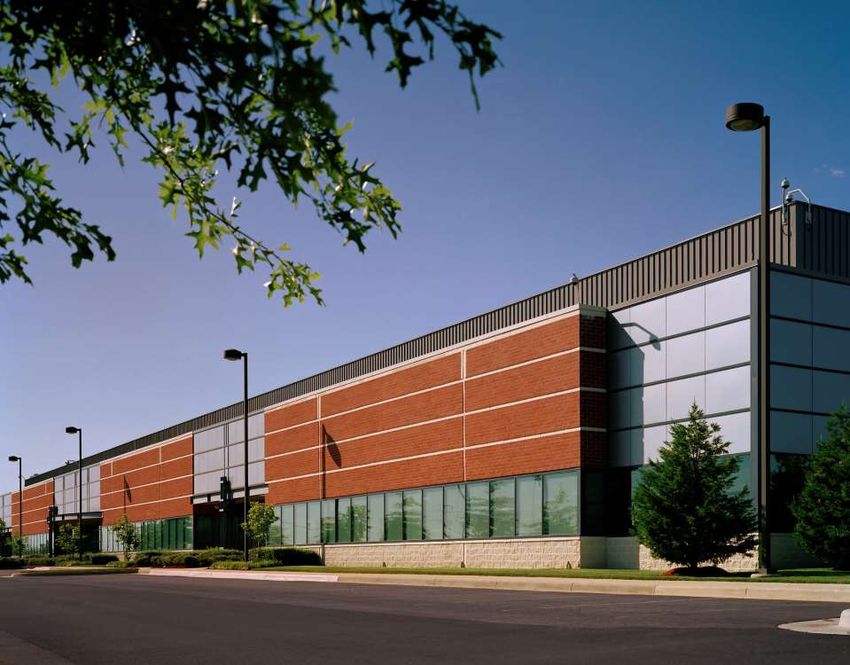
KEY HIGHLIGHTS

Data Centres, 44490 Chilum Place (ACC2), Northern Virginia
Investor Presentation August 2020 - Mapletree ...
Sustainable and Growing Returns
   Distributable Income                                                                                                                                                                                                                                   DPU
                                                                                           Distributable Income (S$ million)                                              DPU (cents)
        (S$ million)                                                                                                                                                                                                                                     (cents)

   100                                                                                                                                                                                                                                                       3.50
                                                                                                                                                                                                                                       3.13 3.16
                                                                                                                                                                                                                      3.07 3.08 3.10
    90                                                                                                                                                                               3.00
                                                                                                                                                                                                   2.95
                                                                                                                                                                                                          3.00 3.01
                                                                                                                                                         2.85 2.832.83   2.88 2.92          2.88                                                      2.87   3.00
                                                                                                                                        2.79 2.82 2.81
                                                                                                                                 2.73                                                                                                        2.85
    80                                                                                                               2.67 2.65
                                                                                                              2.60
                                                                                 2.43   2.47 2.512.512.51                                                                                                                                             70.6
                                                                   2.32
                                                                          2.37                                                                                                                                                            69.4 69.2          2.50
    70                                                      2.29
                                                  2.22 2.26
                                           2.16                                                                                                                                                                                  63.2 63.5
                                    2.05                                                                                                                                                                                     59.9
                             1.98                                                                                                                                                                                     58.3
    60                1.93                                                                                                                                                                         55.5
                                                                                                                                                                                                          56.9 56.7
                                                                                                                                                                                52.9 54.0 53.5                                                               2.00
                                                                                                                                                                         51.8
                                                                                                                                             50.350.4 51.5 50.6 51.1
                                                                                                                                 48.2 48.9
    50                                                                                                        45.4 46.0 46.7
               1.52
                                                                                                  42.6 42.8
                                                                                        41.1 42.2
                                                                          38.9 40.2                                                                                                                                                                          1.50
    40                                                 36.9 37.5 37.7
                                           35.2 35.8
                                    31.6
                      28.3 29.0
    30                                                                                                                                                                                                                                                       1.00
               22.3

    20
                                                                                                                                                                                                                                                             0.50
    10

       0                                                                                                                                                                                                                                                     0.00
               3Q¹ 4Q 1Q 2Q 3Q 4Q 1Q 2Q 3Q 4Q 1Q 2Q 3Q 4Q 1Q 2Q 3Q 4Q 1Q 2Q 3Q 4Q 1Q 2Q 3Q 4Q 1Q 2Q 3Q 4Q 1Q 2Q 3Q 4Q 1Q 2Q 3Q 4Q 1Q
               FY10/11          FY11/12                    FY12/13                  FY13/14               FY14/15                    FY15/16                 FY16/17                FY17/18                   FY18/19                FY19/20 FY20/21
DPU
                3.45                 8.41                    9.24                        9.92                 10.43                     11.15                 11.39                  11.75                     12.16                   12.24
(cents)
           1    MIT was listed on 21 Oct 2010.

   5
Investor Presentation August 2020 - Mapletree ...
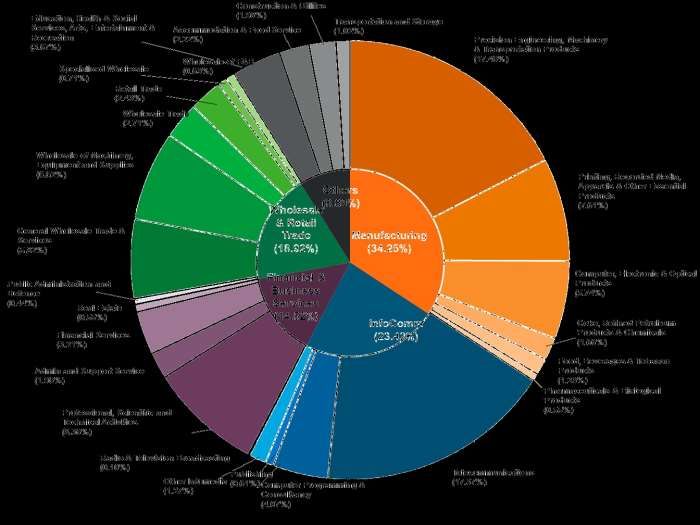
Portfolio Growth since IPO
                                                                                                                                                    FY19/20        FY20/21
    3 Asset Enhancement                                                                                                                             S$5.9b

      Initiatives (“AEI”)
    5 Build-to-Suit (“BTS”)                                                                                                          FY18/19
      Projects                                                                                                                       S$4.8b

    7 Acquisitions                                                                                                     FY17/18
                                                                                                                       S$4.3b

                                                                                                       FY16/17
                                                                                             FY15/16   S$3.7b
                                                                        FY14/15
                                                                                             S$3.6b
                                                     FY13/14            S$3.4b
                                                     S$3.2b                                                                                                      Acquisition
                                  FY12/13                                                                                                                          Remaining
                FY11/12           S$2.9b                                                                                                                          60% interest
                S$2.7b                                                                                                                                           in 14 US DCs
 FY10/11                                                                                                                                                          US$494m
 S$2.2b1                                                                     Acquisition                                          Acquisition                   BTS
                                                 AEI                                                      BTS
                                             Woodlands                        2A Changi                                             Upgraded                    Kolam
                                                                                                         1 & 1A
                                              Central                        North Street 2                                      7 Tai Seng Drive               Ayer 2
                                                                                                       Depot Close
                                                                                                                                     to a DC
                                              S$30m                              S$12m                  S$226m                                                 S$263m
                                                                                                                                     S$95m

                                                  BTS                              BTS                 Acquisition                    BTS                     Acquisition
              Acquisition                                                       26A Ayer
               11 Flatted                   K&S Corporate                                               40% interest               Mapletree                13 North
                                            Headquarters                         Rajah                 in14 US DCs²              Sunview Drive 1          American DCs3
               Factories
                                                S$50m                           Crescent                                             S$76m                    US$684m
               S$400m                                                                                   US$300m
                                                                                S$101m

                                              AEI                                                          AEI                    Acquisition
FY10/11         FY11/12            FY12/13 Toa Payoh
                                                 FY13/14                 FY14/15             FY15/16    FY16/17
                                                                                                        30A Kallang    FY17/18        FY18/19
                                                                                                                                  18 Tai Seng       FY19/20         FY20/21
                                               North 1                                                     Place                    S$268m
                                               S$40m                                                      S$77m

          1    Valuation of investment properties on 31 Mar at end of each financial year.
          2    Acquired through a 40:60 joint venture with MIPL.
     6    3    Acquired through a 50:50 joint venture with MIPL.
Investor Presentation August 2020 - Mapletree ...
1QFY20/21 Results Highlights
 Growth from acquisition and development projects offset by withholding of tax-exempt income
  distribution in 1QFY20/21
  •   1QFY20/21 Distributable Income: S$70.6 million ( 11.6% y-o-y)

 Tax-exempt income of S$7.1 million withheld in 1QFY20/21 for greater flexibility in cash
  management in view of the uncertainty from the COVID-19 pandemic
  •   1QFY20/21 DPU: 2.87 cents ( 7.4% y-o-y)
  •   Had the tax-exempt income distribution not been withheld: 1QFY20/21 DPU 3.19 cents
      ( 2.9% y-o-y)

 Underlining our strategy to improve portfolio resilience
  •  Reclassification of Data Centres as a standalone property segment
  •  Stronger focus on property segments with future growth potential: Data Centres, Hi-Tech Buildings
     and Business Park Buildings

 Extraordinary general meeting on proposed acquisition of remaining 60.0% interest in 14 data
  centres in the United States of America (the “United States”) from the Sponsor
  (the “US Acquisition”) to be held on 27 Aug 2020

 Capital management update
  •  Successfully raised S$410.0 million through a private placement to fund the US Acquisition in
     Jun 2020, which was 8.2 times covered at the top end of issue price range of S$2.800 per new unit

 Improved visibility with the inclusion into FTSE Straits Times Index on 22 Jun 2020

7
Investor Presentation August 2020 - Mapletree ...
Proposed Acquisition of 60% Interest in
14 Data Centres in the United States

                                    Acquisition of the remaining 60.0% interest in the 14 data centres located in the United States
Proposed Acquisition
                                    (the “MRDCT Portfolio”), which are currently held by MRDCT

Purchase
                                    US$210.9 million (approximately S$299.5 million2)
Consideration1

Total Acquisition
                                    US$218.0 million (approximately S$309.6 million)
Outlay

                                    (i) On the basis of a 100.0% interest in the MRDCT Portfolio: US$823.3 million
                                         (approximately S$1,169.1 million)
Agreed Value
                                    (ii) On the basis of a 60.0% interest in the MRDCT Portfolio: US$494.0 million
                                         (approximately S$701.5 million)

                                    (i) Mapletree DC Ventures Pte. Ltd., a wholly-owned subsidiary of Mapletree Investments Pte
                                         Ltd
Vendors
                                    (ii) Etowah DC Holdings Pte. Ltd., Hudson DC Holdings Pte. Ltd. and Redwood DC Holdings
                                         Pte. Ltd., each of which is a wholly-owned subsidiary of MRDCT

Method of Financing                 Proceeds from an equity fund raising and issuance of acquisition fee Units

     1    Derived from 60.0% of the adjusted net asset value of the MRDCT group (based on the pro forma completion statement of the MRDCT group as at 31 Mar 2020), after taking
          into account, among others, the Agreed Value, less (i) existing MRDCT group debt of US$450.0 million (approximately S$639.0 million) and (ii) estimated net liabilities of
          approximately US$21.8 million (approximately S$31.0 million).
8    2    Unless otherwise stated, an illustrative exchange rate of US$1.00 to S$1.42 is used in this presentation.
Investor Presentation August 2020 - Mapletree ...
Consolidation of Good Quality Portfolio of Data Centres

Agreed Value                           NLA                              WALE                                         Weighted Average Unexpired               Occupancy
                                                                                                                     Lease Term of Underlying                 Rate
                                                                                                                     Land

US$823.3m1                             2.3m sq ft2                      4.9 years3                                   100.0% Freehold4                         97.4%5

                                                                                                                                  Wisconsin

                                                                 Wisconsin                                                         1   N15W24250 Riverwood Drive, Pewaukee
                                                                              1
                                                                                      Michigan
                                                                                           2
                                                                                                                                  Michigan
                                                                                                         New Jersey                2   19675 W Ten Mile Road, Southfield
                                                                                                                 3
                                                                                                             4                    New Jersey

                                                                                                        Pennsylvania               3   2 Christie Heights, Leonia
California                                                             Tennessee
                                                                                                         6                        Pennsylvania
                                                                                  7                 5
                                                                                                                                   4   2000 Kubach Road, Philadelphia
                 14                                                                        9             North Carolina
                                                       11                              8       10                                 North Carolina
                                                            12
                                                       13                             Georgia                                      5   1805 Center Park Drive, Charlotte
Texas
                                                    Texas                                                                          6   5150 McCrimmon Parkway, Morrisville
11   1221 Coit Road, Plano
                                                                                                                                  Tennessee
12   3300 Essex Drive, Richardson
                                                                                                                                   7   402 Franklin Road, Brentwood
13   5000 Bowen, Arlington
                                                                                                                                  Georgia
California
                                                                                                                                   8   180 Peachtree, Atlanta
14   7337 Trade Street, San Diego
                                                                                                                                   9   1001 Windward Concourse, Alpharetta

                                                                                                                                   10 2775 Northwoods Parkway, Atlanta
        1    As at 31 Mar 2020 on the basis of a 100.0% interest in the MRDCT Portfolio.
        2    Excludes the parking decks (150 Carnegie Way and 171 Carnegie Way) at 180 Peachtree, Atlanta.
        3    By gross rental income as at 30 Jun 2020.
        4    Except for the parking deck (150 Carnegie Way) at 180 Peachtree, Atlanta. As at 31 Mar 2020, the parking deck has a remaining land lease tenure of approximately 35.8
             years, with an option to renew for an additional 40 years.
9       5    As at 30 Jun 2020.
Investor Presentation August 2020 - Mapletree ...
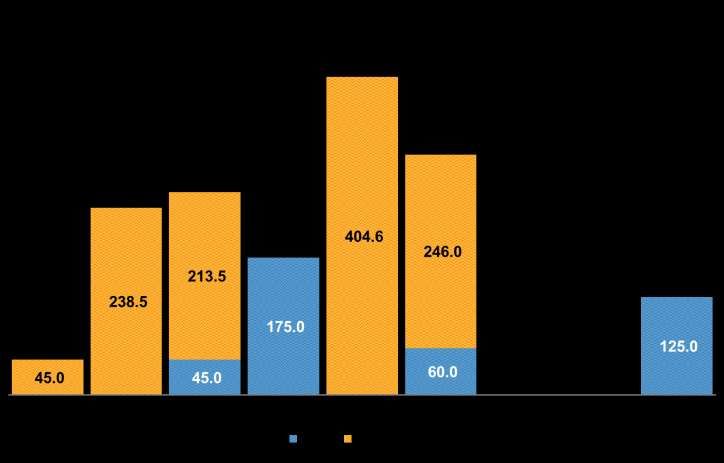
Proposed Divestment – 26A Ayer Rajah Crescent1

 Sale Price                                                                GFA                                            Completion

 S$125.0 million                                                     384,802 sq ft                                            4Q2020

                                                                        Exercise of option to purchase 26A Ayer Rajah
                                                                         Crescent by Equinix Singapore2
                                                                        Seven-storey data centre developed by MIT for
                                                                         Equinix in Jan 2015
                                                                        30-year land lease commenced on 22 May 2013
                                                                        Sale Price is 23.3% above development cost of
                                                                         S$101.4 million and in line with valuation of
                                                                         S$125.0 million3
                                                                        Contributed about 2.2% to MIT’s portfolio gross
                                                                         revenue in FY19/20
                                                                        Use of sale proceeds to fund committed investments,
                                                                         reduce existing debt and/or make distributions to
                                                                         unitholders
     26A Ayer Rajah Crescent                                            Distribution of profits (approximately S$19 million) to
                                                                         unitholders up to 3 years

 1    Subject to approval by JTC Corporation.
 2    Refers to the exercise of option to purchase 26A Ayer Rajah Crescent within the Lease Agreement between MIT and Equinix dated 1 Mar 2015. 26A Ayer Rajah
      Crescent is the only property in MIT’s portfolio with such option to purchase being granted to the tenant.
 3    Based on latest annual valuation as at 31 Mar 2020.
10
OVERVIEW OF
                          MAPLETREE INDUSTRIAL TRUST
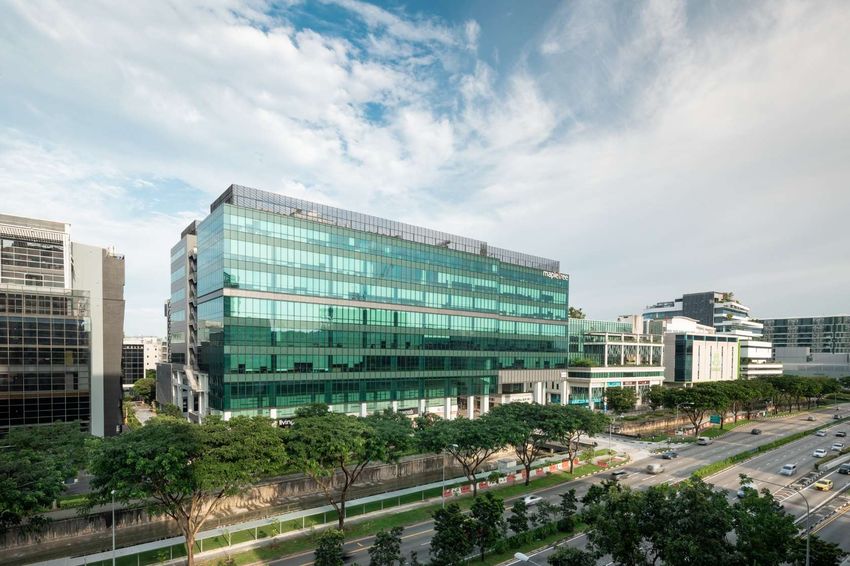
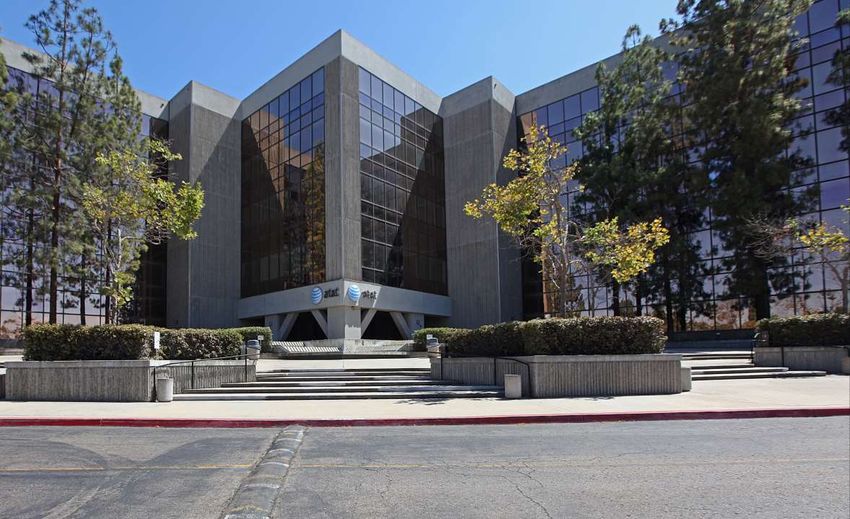
Hi-Tech Building, 18 Tai Seng
Overview of Mapletree Industrial Trust
                            Mapletree Investments Pte Ltd                                                Public & Inst
                                                                                                                                         MIPL
Sponsor                     (“MIPL”)                                                                     Unitholders

                                                                                                       72.6%                                27.4%
                            Owns 27.4% of MIT                                                                                                       Trustee

                            Focused on (i) industrial real estate
                            assets in Singapore, excluding                                                                                          Manager
Investment
                            properties primarily used for logistics
mandate
                            purposes and (ii) data centres
                                                                                                                         MIT Portfolio              Property
                            worldwide beyond Singapore                                                                                              Manager

                            114 properties valued at S$5.9 billion1
Portfolio
                            20.9 million2 sq ft NLA

                            Mapletree Industrial Trust
Manager                     Management Ltd.
                            100% owned by the Sponsor
                            Mapletree Facilities Services
Property                    Pte. Ltd.
Manager
                            100% owned by the Sponsor

Trustee                     DBS Trustee Limited

1   Based on MIT’s book value of investment properties as well as MIT’s interests of the joint         AUM by geography
    ventures with MIPL in a portfolio of 14 data centres in the United States and three fully fitted
    hyperscale data centres and 10 powered shell data centres in North America and included            Singapore                                        75.6%
    MIT’s right of use assets of S$25.2 million as at 30 Jun 2020.
2   Excludes the parking decks (150 Carnegie Way and 171 Carnegie Way) at 180 Peachtree.               North America                                    24.4%
12
Diverse Portfolio of 114 Properties

       DATA CENTRES                                         FLATTED FACTORIES
       Facilities used primarily for the storage and        High-rise multi-tenanted industrial buildings
       processing of data. These include core-and-shell     with basic common facilities used for light
       to fully-fitted facilities, which include building   manufacturing activities.
       fit-outs as well as mechanical and electrical
       systems.

       HI-TECH BUILDINGS                                    STACK-UP/RAMP-UP
                                                            BUILDINGS
       High specification industrial buildings with
       higher office content for tenants in technology      Stacked-up factory space with vehicular
       and knowledge-intensive sectors. Usually             access to upper floors. Multi-tenanted space
       fitted with air-conditioned lift lobbies and         suitable for manufacturing and assembly
       common areas.                                        activities.

       BUSINESS PARK BUILDINGS                              LIGHT INDUSTRIAL
                                                            BUILDINGS
       High-rise multi-tenanted buildings in specially
       designated “Business Park zones”. Serve as           Multi-storey developments usually
       regional headquarters for MNCs as well as            occupied by an anchor tenant for light
       spaces for R&D and knowledge-intensive               manufacturing activities.
       enterprises.

13
Healthy Returns since IPO

 COMPARATIVE TRADING PERFORMANCE SINCE IPO¹
                    400
                                                                                                                        MIT UNIT PRICE
                                                                                                                           +233.3%
                    350

                    300

                    250

                    200
                                                                                                              FTSE ST REITS INDEX
                                                                                                                    +21.8%
                    150

                    100

                     50                                                                                      FTSE STRAITS TIMES INDEX
                                                                                                                      -20.2%

                      0
                      Oct 10     Oct 11     Oct 12     Oct 13    Oct 14     Oct 15      Oct 16      Oct 17     Oct 18      Oct 19

                           Rebased MIT Unit Price         Rebased FTSE ST REITS Index            Rebased FTSE Straits Times Index

     MIT’s Return on                                                      Capital                  Distribution                           Total
     Investment                                                      Appreciation                         Yield                          Return
     Listing on 21 Oct 2010 to 24 Aug 2020                                  233.3%²                       110.7%³                    344.0%4

     ¹   Rebased MIT’s issue price of S$0.930 and opening unit prices of FTSE ST REITs Index and FTSE Straits Times Index on
         21 Oct 2010 to 100. Source: Bloomberg.
     ²   Based on MIT’s closing unit price of S$3.100 on 24 Aug 2020.
     ³   MIT’s distribution yield is based on DPU of S$1.030 over the issue price of S$0.930.
14   ⁴   Sum of distributions and capital appreciation for the period over the issue price of S$0.930.
87 Properties in Singapore

Total                         WALE        Weighted Average Unexpired          Occupancy
NLA                           (By GRI)1   Lease Term of Underlying Land1      Rate2

16.6m sq ft 3.4 years                     35.9 years                          90.2%

                                                                           Data Centres
                                                                           Hi-Tech Buildings
                                                                           Flatted Factories
                                                                           Business Park Buildings
                                                                           Stack-up/Ramp-up Buildings
                                                                           Light Industrial Buildings
     1   As at 30 Jun 2020.
     2   For 1QFY20/21.
15
27 Data Centres Across North America

Total                                        WALE                                 Weighted Average Unexpired                                         Occupancy
NLA1                                         (By GRI)2                            Lease Term of Underlying Land3                                     Rate4

4.3m sq ft                                   7.4 years                            Freehold                                                           98.7%

                                                                                                                      Ontario
                                                                                                                           1
                                                                                         Wisconsin
                                                                                               1

                                                                                                              1
                                                                                                      Michigan                                   1   Massachusetts
                                                                                                                           Pennsylvania
                                                                                                                                             1
                                                                                                                                1
                                                                                                                                         New Jersey
                                                                2

                                                             Denver                                                                 6    Virginia
                                   1

                            California                                                                    1                     2       North Carolina
                                                                                                     Tennessee
                                                        1
                                                 Arizona                                                          1    3
                                                                          1   3
     MRODCT Portfolio (13 data centres)                                                                       Georgia
                                                                         Texas
     MRDCT Portfolio (14 data centres)
     *Number of data centres indicated in the circles

     1    Excluded the parking decks (150 Carnegie Way and 171 Carnegie Way) at 180 Peachtree, Atlanta.
     2    As at 30 Jun 2020.
     3    All properties are sited on freehold land, except for the parking deck (150 Carnegie Way) at 180 Peachtree, Atlanta and 2055 East Technology Circle, Phoenix.
16   4    For 1QFY20/21.
Reputable Sponsor with Aligned Interest
 About the Sponsor, Mapletree Investments
      Leading real estate development, investment, capital and property management company
      As at 31 Mar 2020, the Sponsor owns and manages S$60.5 billion of assets across Asia Pacific,
       Europe, the United Kingdom and North America, of which S$12.5 billion is located in North America
      Right of first refusal to MIT over future sale of 50% interest in Mapletree Rosewood Data Centre Trust
       (“MRODCT”)

                                                                                                                Ontario                                311 South Wacker
                                                                                                                                                       Drive, Suite 520,
                                                                                                                     1                                 Chicago, IL 60606
                                                                                   Wisconsin
                                                                                         1

                                                                                                        1
                                                                                                Michigan                                   1   Massachusetts
                                                                                               M                     Pennsylvania          M
                                                                                                                                         1
                                                                                                                          1
                                                                                                                                   New Jersey
                                                               2

                                                             Denver                                                           6    Virginia
1 World Trade Center,                1
24th Floor, Long Beach,                                                                                                                                5 Bryant Park, 28th
                             California                                                             1                     2
CA 90831                                                                                                                          North Carolina       Floor, New York,
                                 M                                                             Tennessee
                                                                                                                                                       NY 10018
                                                         1                                              M
                                                  Arizona                     M
 M    MIPL's Offices in the US                                                                              1    3
                                                                      1   3
      MRODCT Portfolio (13 data centres)                                                                Georgia
                                                                      Texas                                                       180 Peachtree Street,
      Mapletree Redwood Data Centre Trust                                                                                         Suite 610, Atlanta, GA
      (“MRDCT”) Portfolio (14 data centres)                                                                                       30303
                                                                                  14800 Quorum Drive,
      *Number of data centres indicated in the circles                            Suite 287,
                                                                                  Dallas, TX 75254

17
PORTFOLIO
             UPDATE

Hi-Tech Buildings, build-to-suit project for HP
Portfolio Overview
                                                                       Singapore                      North American                                    Overall
                                                                        Portfolio                            Portfolio                                 Portfolio

         Number of properties                                                      87                                     27                                     114

         NLA (million sq ft)                                                     16.6                                   4.31                                 20.91

         Occupancy (%)
           1QFY20/21                                                             90.2                                   98.7                                 91.12
           4QFY19/20                                                             90.7                                   98.7                                 91.52

 SEGMENTAL OCCUPANCY RATES1

          99.2% 99.2%          98.4% 98.2%
                                                                                                     94.0% 93.7%                                  91.5%2 91.1%2
                                                       86.1% 85.9%            86.2% 85.4%
                                                                                                                           80.0%79.5%

          Data Centres        Hi-Tech Buildings       Business Park         Flatted Factories Stack-up/Ramp-up             Light Industrial          Overall
                                                        Buildings                                 Buildings                   Buildings              Portfolio

                                                 Left Bar (4QFY19/20)                              Right Bar (1QFY20/21)

     1    Excludes the parking decks (150 Carnegie Way and 171 Carnegie Way) at 180 Peachtree.
     2    Based on MIT’s 40% interest of the joint venture with MIPL in a portfolio of 14 data centres in United States through MRDCT and 50% interest of the joint venture
          with MIPL in three fully fitted hyperscale data centres and 10 powered shell data centres in North America through MRODCT.
19
Lease Expiry Profile

 EXPIRING LEASES BY GROSS RENTAL INCOME1
 As at 30 June 2020

     WALE based on date of commencement of leases (years)2

     Singapore Portfolio                                                    3.4

     North American Portfolio                                               7.4                                                  36.9%

     Overall Portfolio1                                                     4.2

                                                                        18.6%                        17.0%
                                           16.2%
              11.3%

            FY20/21                      FY21/22                      FY22/23                      FY23/24               FY24/25 & Beyond
     Data Centres (Singapore)             Data Centres (North America)        Hi-Tech Buildings                    Business Park Buildings
     Flatted Factories                    Stack-up / Ramp-up Buildings        Light Industrial Buildings

     1   Based on MIT’s 40% interest of the joint venture with MIPL in a portfolio of 14 data centres in United States through MRDCT and 50% interest
         of the joint venture with MIPL in three fully fitted hyperscale data centres and 10 powered shell data centres in North America through MRODCT.
     2   Refers to leases which commenced prior to and on 30 Jun 2020.
20
Large and Diversified Tenant Base

 TOP 10 TENANTS BY GROSS RENTAL INCOME1
 As at 30 June 2020

          8.0%                                  Over 2,000 tenants
                                                Largest tenant contributes 8.0% of Portfolio’s Gross Rental Income
                                                Top 10 tenants forms about 29.9% of Portfolio’s Gross Rental Income

                                                                                                        Hi-Tech Buildings      Data Centres

                         4.2%
                                        3.7%
                                                       3.0%           2.9%
                                                                                     2.5%

                                                                                                    1.7%           1.6%
                                                                                                                                  1.2%           1.1%

                     Global Social                   Global                                       Fortune 25                                  IT Solutions
                        Media                      Colocation                                    Investment                                     Provider2
                      Company2                      Provider2                                    Grade-Rated
                                                                                                  Company2
     1   Based on MIT’s 40% interest of the joint venture with MIPL in a portfolio of 14 data centres in United States through MRDCT and 50% interest
         of the joint venture with MIPL in three fully fitted hyperscale data centres and 10 powered shell data centres in North America through MRODCT.
     2   The identities of the tenants cannot be disclosed due to the strict confidentiality obligations under the lease agreements.
21
Tenant Diversification Across Trade Sectors1
                  No single trade sector accounted >18% of Portfolio’s Gross Rental Income

         By Gross Rental Income
         As at 30 Jun 2020

     1   Based on MIT’s 40% interest of the joint venture with MIPL in a portfolio of 14 data centres in United States through MRDCT and 50% interest
22       of the joint venture with MIPL in three fully fitted hyperscale data centres and 10 powered shell data centres in North America through MRODCT.
Singapore Portfolio Performance
Occupancy                                                                                                                                                                                                                                                                           Gross Rental Rate
                                                                                                                                                                                                                                                                                       S$ psf/mth
100%                                                                                                                                                                                                                                                                                            $2.50
                                    95.1% 95.0% 94.9% 95.0% 95.2% 95.4% 95.5%                                                                                 94.7% 94.6%
                        94.3% 94.5%                                           93.9%
                93.2%                                                                                                                           93.5% 93.8%                   93.0% 92.5%       93.1% 92.6%
        92.3%                                                                                       92.5%                                                                                 92.1%
                                                                                                            91.3% 90.7% 91.5% 90.8%                                                                                                                                                   90.7% 90.2%
                                                                                                                                    90.2%                                                                     90.4% 90.1%
                                                                                                                                                                                                                          89.6%                               89.8% 90.5% 90.2% 90.5%
90%                                                                                                                                                                                                                                   87.8%           87.7%
                                                                                                                                                                                                                                              86.2%

                                                                                                                                                                                                                                                                                    $2.12 $2.11
                                                                                                                                                                                                                                                                      $2.10 $2.10

80%                                                                                                                                                                                                                           $2.01
                                                                                                                                                                                                                      $1.97                                                                       $2.08
                                                                                                                                                                                                                                                              $2.07
                                                                                                                                                                                                        $1.95 $1.94
                                                                                                                                                                                                                                              $2.05
                                                                                                                                                                                                                                                      $2.04
                                                                                                                                                                                                                                                                                                          $2.00
                                                                                                                                                                      $1.90                                                           $2.02
                                                                                                                                                        $1.88 $1.89
                                                                                                                                                $1.86
70%                                                                                                                                                                                             $1.94
                                                                                                                                                                              $1.92 $1.92 $1.93
                                                                                                            $1.75
                                                                                                    $1.73
                                                                                    $1.71                                               $1.84
                                                                                            $1.70                           $1.82 $1.83

60%                                                                                                                 $1.77

                                                                            $1.68
                                $1.54 $1.53 $1.55
                        $1.52
                                                                    $1.61
                                                            $1.59
50%                                                 $1.56                                                                                                                                                                                                                                                 $1.50
                $1.49
        $1.45

40%

30%
                                                                                                                                                                                                                                                                                                          $1.00
20%

10%

 0%                                                                                                                                                                                                                                                                                                       $0.50
        3Q 4Q 1Q 2Q 3Q 4Q 1Q 2Q 3Q 4Q 1Q 2Q 3Q 4Q 1Q 2Q 3Q 4Q 1Q 2Q 3Q 4Q 1Q 2Q 3Q 4Q 1Q 2Q 3Q 4Q 1Q 2Q 3Q 4Q 1Q 2Q 3Q 4Q 1Q
       FY10/11              FY11/12                     FY12/13                         FY13/14                         FY14/15                     FY15/16                       FY16/17                   FY17/18                       FY18/19                         FY19/20 FY20/21

   23                                                                                                               Occupancy (LHS)                                   Rental Rate (RHS)
Rental Revisions (Singapore)

 GROSS RENTAL RATE (S$ PSF/MTH)1
 For Period 1QFY20/21
                                                                                                                                                    Before Renewal
                                                 $3.69 $3.62                                                                                        After Renewal
                         $3.08                                                                                                                      New Leases
                                                         $3.61
                                                                                                                                                    Passing Rent
                $2.40 $2.36
                                                                                          $1.71
                                 $1.93
                                                                                  $1.68 $1.66      3                                               $1.59 $1.63
                                                                                             $1.46                           $1.53
                                                                                                                  $1.29 $1.25
                                                                                                                                                            $1.41
                                                                                                                           $1.22

                                                                             2
                Hi-Tech Buildings           Business Park Buildings               Flatted Factories              Stack-Up/Ramp-Up                    Light Industrial
                                                                                                                      Buildings                         Buildings

Renewal                  33 Leases                       15 Leases                       105 Leases                      8 Leases                     6 Leases
Leases                 (132,728 sq ft)                 (108,852 sq ft)                 (291,090 sq ft)                (151,051 sq ft)               (46,276 sq ft)
New                        2 Leases                        1 Lease                        29 Leases                       2 Leases
                                                                                                                                                          N.A.4
Leases                   (2,693 sq ft)                   (3,638 sq ft)                  (75,066 sq ft)                  (7,029 sq ft)

     1   Gross Rental Rate figures exclude short term leases; except Passing Rent figures which include all leases.
     2   Excluded the rental rate for the sole new lease at Business Park Buildings for confidentiality.
     3   As a result of the redevelopment of the Kolam Ayer 2 Cluster, preferential rents were offered to existing tenants who relocated to alternative MIT premises.
         Excluding these new leases, the average rental rate for new leases would have been S$1.62 psf/mth.
24   4   Not applicable as there were no new leases secured in the quarter.
Healthy Tenant Retention (Singapore)

  LONG STAYING TENANTS                                             RETENTION RATE FOR 1QFY20/21

                             Up to 1 yr
                               8.7%
  >10 yrs                                                                                                                       100.0%
                                                                                93.3%      94.3%
   29.7%
                                              >1 to 2 yrs
                                                                                                                                              81.2%
                                                12.0%                                                  75.4%
                                                                                                                    70.6%

                             4 yrs or
                           less 35.7%
               More than                            > 2 to 3 yrs
                 4 yrs                                 7.7%
                64.3%

                                                   >3 to 4 yrs
                                                      7.3%           N.A.
                                           >4 to 5 yrs                 Data    Hi-Tech     Business     Flatted    Stack-up /     Light      Singapore
>5 to 10 yrs                                  4.8%
                                                                     Centres   Buildings     Park      Factories   Ramp-up      Industrial    Portfolio
   29.8%                                                           (Singapore)             Buildings               Buildings    Buildings

                                        As at 30 Jun 2020            Based on NLA.
                                        By number of tenants.        Not applicable for Data Centres (Singapore) as no leases were due for
                                                                     renewal.

  64.3% of the tenants have leased the properties for more than 4 years
  Tenant retention rate of 81.2% in 1QFY20/21
 25
Redevelopment – Kolam Ayer 2
 Property                                                                                                                       GFA                  Plot Ratio

 Kolam Ayer 2 Cluster                      Two Flatted Factories and an amenity centre                                    506,720 sq ft                      1.5

                                               New Hi-Tech Buildings, including a
 After Redevelopment                                                                                                      865,600 sq ft                      2.5
                                           seven-storey BTS Facility for Anchor Tenant

                                                                              Redevelopment of Kolam Ayer 2 Flatted Factory
                                                                               Cluster into a new high-tech industrial precinct at total
                                                                               project cost of S$263 million1
                                                                              Secured pre-commitment from a global medical
                                                                               device company headquartered in Germany (the
                                                                               “Anchor Tenant”) for about 24.4% of enlarged GFA
                                                                               (~211,000 sq ft)
                                                                              BTS Facility is 100% committed by Anchor Tenant for
                                                                               lease term of 15 + 5 + 5 years2 with annual rental
                                                                               escalations
                                                                              74 out of 108 existing tenants committed to new
     Artist’s impression of MIT’s new high-tech
     industrial precinct with BTS Facility on the left
                                                                               leases at alternative MIT clusters
                                                                              Site handed over to demolition contractor
                                                                              Completion in 2H2022
 1    Includes the book value of the Kolam Ayer 2 Cluster at S$70.2 million as at 31 Mar 2019 prior to the commencement of the redevelopment.
 2    Includes a rent-free period of 6 months distributed over the first six years. Anchor Tenant is responsible for all operating expense and property tax of the BTS Facility.

26
1QFY20/21
                                              FINANCIAL HIGHLIGHTS

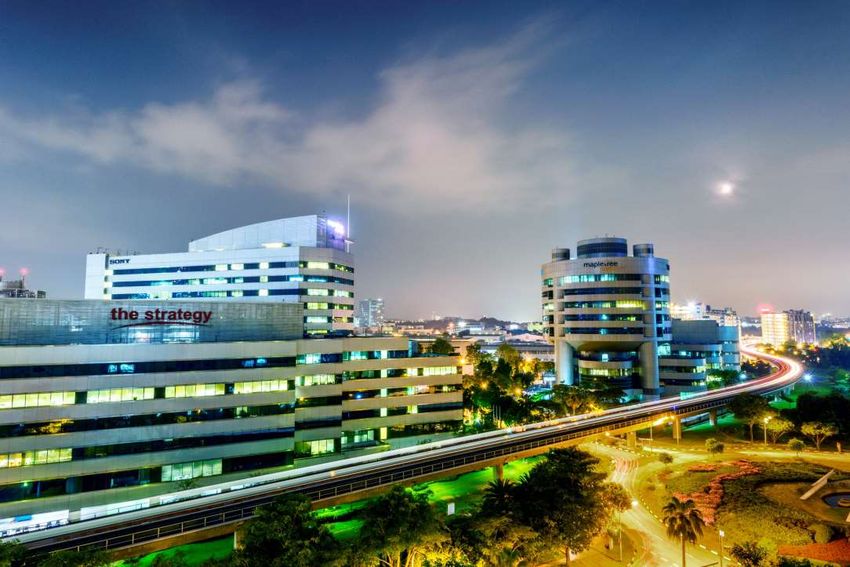
Business Park Buildings, The Strategy and The Synergy
Statement of Profit or Loss (Year-on-Year)
                                                                                                      1QFY20/21                       1QFY19/20
                                                                                                                                                                                 / ()
                                                                                                        (S$’000)                        (S$’000)
     Gross revenue                                                                                            99,106                           99,575                          (0.5%)

     Property operating expenses                                                                           (20,454)                         (21,656)                           (5.6%)

     Net property income                                                                                      78,652                           77,919                             0.9%

     Borrowing costs                                                                                        (10,568)                        (10,576)                           (0.1%)

     Trust expenses                                                                                           (9,337)                         (8,835)                            5.7%

     Share of joint ventures’ results1                                                                         13,748                            4,311                     >100.0%

     Profit for the period                                                                                     72,495                          62,819                           15.4%

     Net non-tax deductible items                                                                            (11,384)                         (3,332)                      >100.0%

     Distributions declared by joint ventures                                                                    9,447                           3,754                     >100.0%

     Amount available for distribution                                                                       70,5582                          63,241                            11.6%

     Distribution per Unit (cents)                                                                               2.872                             3.10                        (7.4%)

     1   Share of joint ventures’ results relates to MIT’s equity interest in the North American joint ventures with MIPL. The results of the joint ventures were equity accounted for at the
         Group level.
     2   As announced on 2 Jul 2020, MIT declared a Cumulative Distribution of 2.90 cents per unit for the period from 1 Apr 2020 to 1 Jul 2020, being the date immediately prior to
         the date on which the new units were issued pursuant to the private placement. The Cumulative Distribution comprises 2.87 cents per unit for the period from 1 Apr 2020 to 30
         Jun 2020 and an advanced distribution of 0.03 cent per unit for 1 Jul 2020. The Cumulative Distribution will be paid on 28 Jul 2020.

         Amount available for distribution includes tax-exempt income amounting to S$7.1 million withheld and not included in the 39th distribution (equivalent to distribution per unit of
28       0.32 cent). Had the tax-exempt income distribution not been withheld, DPU for 1QFY20/21 would be 3.19 cents.
Statement of Profit or Loss (Qtr-on-Qtr)
                                                                                                           1QFY20/21                       4QFY19/20
                                                                                                                                                                                    / ()
                                                                                                             (S$’000)                        (S$’000)

     Gross revenue                                                                                               99,106                         101,801                           (2.6%)
     Property operating expenses                                                                               (20,454)                         (23,545)                        (13.1%)
     Net property income                                                                                         78,652                           78,256                            0.5%
     Borrowing costs                                                                                            (10,568)                        (11,029)                          (4.2%)
     Trust expenses                                                                                              (9,337)                         (8,185)                          14.1%
     Net fair value gain on investment properties and investment
                                                                                                                           -                      50,798                                 **
     property under development
     Share of joint ventures’ results1                                                                            13,748                          60,897                        (77.4%)
     Comprising:
     - Net profit after tax                                                                                       13,748                          13,619                            0.9%
     - Net fair value gain on investment properties                                                                        -                      47,278                                 **
     Profit before income tax                                                                                     72,495                        170,737                          (57.5%)
     Income tax expense                                                                                                    -                            (7)                              **
     Profit for the period                                                                                        72,495                        170,730                          (57.5%)
     Net non-tax deductible items                                                                               (11,384)                      (111,419)                         (89.8%)
     Distributions declared by joint ventures                                                                       9,447                           9,842                         (4.0%)
     Amount available for distribution                                                                          70,5582                         69,1532                             2.0%
     Distribution per Unit (cents)                                                                                  2.872                           2.852                           0.7%

     ** Not meaningful

     1   Share of joint ventures’ results relates to MIT’s equity interest in the North American joint ventures with MIPL. The results of the joint ventures were equity accounted for at the
         Group level.
     2   Amount available for distribution includes tax-exempt income amounting to S$7.1 million withheld and not included in the 39th distribution (equivalent to distribution per unit of
29       0.32 cent). Had the tax-exempt income distribution not been withheld, DPU for 1QFY20/21 would be 3.19 cents.
Balance Sheet

                                                                                 30 Jun 2020                    31 Mar 2020                / ()

     Total assets (S$’000)                                                           5,297,002                      5,187,883              2.1%

     Total liabilities (S$’000)                                                      1,732,913                      1,627,762              6.5%

     Net assets attributable to Unitholders
                                                                                     3,564,089                      3,560,121              0.1%
     (S$’000)

     Net asset value per Unit (S$)1                                                          1.62                           1.62                -

     1   Net tangible asset per Unit was the same as net asset value per Unit as there were no intangible assets as at reporting dates.

30
Strong Balance Sheet

                                                                  30 Jun 2020                                    31 Mar 2020

     Total debt (MIT Group)                                   S$1,552.6 million                               S$1,434.1 million

     Weighted average tenor of debt                                 3.9 years                                      4.7 years

     Aggregate
                                                                      38.8%                                          37.6%
     leverage ratio1

     Strong balance sheet to pursue growth opportunities

      Raised S$410.0 million through a private placement in Jun 2020, which was 8.2 times
       covered at the top end of issue price range

      ‘BBB+’ rating with Stable Outlook by Fitch Ratings

      100% of loans unsecured with minimal covenants

 1    In accordance with Property Funds Guidelines, the aggregate leverage ratio includes proportionate share of aggregate leverage as well as
      deposited property values of joint ventures. As at 30 Jun 2020, aggregate leverage including MIT’s proportionate share of joint ventures is
      S$2,373.0 million.
31
Well Diversified Debt Maturity Profile
  New loans drawn from shorter tenor facilities to fund requirements in 1QFY20/21 and to
   provide cash reserve for potential working capital requirement
  More than S$300 million of committed facilities available for the remainder of FY20/21

 DEBT MATURITY PROFILE
 As at 30 June 2020

                       Weighted Average Tenor of Debt = 3.9 years
32
Risk Management
                                                                 30 Jun 2020      31 Mar 2020

     Fixed as a % of total debt                                      86.3%          73.4%

     Weighted average hedge tenor                                  4.0 years       3.8 years

     Weighted average all-in funding
                                                                      2.6%           2.9%
     cost for the quarter
     Interest coverage ratio for the
                                                                   7.9 times       7.7 times
     quarter
     Interest coverage ratio for the
                                                                   7.2 times       6.9 times
     trailing 12 months1

      ~88% natural hedge on proportionate share of North American portfolio value

      About 59% of 2QFY20/21 net US$ income stream are hedged into S$

 1    In accordance with Property Funds Guidelines with effect from 16 Apr 2020

33
OUTLOOK AND
Data Centres, 7337 Trade Street,
San Diego
                                      STRATEGY
Singapore Industrial Property Market
DEMAND AND SUPPLY FOR MULTI-USER FACTORIES                 DEMAND AND SUPPLY FOR BUSINESS PARKS

 Total stock for factory space: 38.9 million sq m
 Potential net new supply of 1.3 million sq m in 20201, of which
     •      Multi-user factory space accounts for 0.6 million sq m. This includes replacement space intended for
            lessees affected by JTC’s Industrial Redevelopment Programme
     •      Business park space accounts for 0.03 million sq m
     •      Moderation in quantum of industrial land released through Industrial Government Land Sales
            Programme since 2013
 Median rents for industrial real estate for 2Q20201
     •      Multi-user Factory Space: S$1.75 psf/mth (-1.1% q-o-q)
     •      Business Park Space: S$4.20 psf/mth (0.0% q-o-q)
35   1   JTC J-Space, 23 Jul 2020
Outlook
Singapore

 Challenging operating environment due to COVID-19 pandemic
  • Singapore economy contracted by 13.2% y-o-y in the quarter ended 30 Jun 2020, worsening from 0.3%
    contraction in the preceding quarter1
  • While business confidence remained downbeat for 3Q 2020, it has improved from previous quarter’s record
    low amid the easing of Circuit Breaker measures and the gradual opening of Singapore economy2

 COVID-19 (Temporary Measures) (Amendment) Act (the “Act”)
  • The Singapore Government expanded the rental relief for small and medium-sized enterprises (“SME”),
    which includes mandatory one-month rental relief to be provided by industrial landlords for eligible SME
    tenants who have suffered a significant drop in their average monthly revenue due to COVID-19
  • As at 30 Jun 2020, about 55% of MIT’s Singapore Portfolio (or 45% of the Overall Portfolio) (by gross rental
    income) are SME tenants

 Impact on Singapore Portfolio
  • MIT’s properties in Singapore had remained open during the Circuit Breaker period from 7 Apr 2020 to
    1 Jun 2020 to support tenants who provide essential services. Most of MIT’s tenants (by gross rental
    revenue) have continued or resumed their business operations
  • Estimated rental reliefs extended to tenants (COVID-19 Assistance and Relief Programme of up to S$13.7
    million as well as mandated rental reliefs under the Act) would amount to about S$20 million, which will
    affect MIT’s distributable income for FY20/21
  • As at 30 Jun 2020, rental arrears of more than one month stood at 1.0% of previous 12 months’ gross
    revenue. While this was an increase from the rental arrears ratio of 0.2% as at 31 Mar 2020, the Manager is
    proactively managing the situation by working with these tenants on rental restructuring plans

     1   Source: Ministry of Trade and Industry, 11 Aug 2020.
36   2   Source: Singapore Commercial Credit Bureau, 3Q2020.
Outlook
North America

 Resilient asset class with growth opportunities
  • According to 451 Research3, North America is the second largest data centre region in the world, which
    accounted for about 30% of the global insourced and outsourced data centre space by operational square
    feet. Leased data centre supply (by net operational square feet) and demand (by net utilised square feet) are
    expected to grow at a CAGR of 5% and 6% respectively between 2018 and 2024F
  • Amid the COVID-19 pandemic, both the United States and Canada have identified data centre workers as
    essential services. All MIT’s 27 data centres in North America had remained open during this period

     3   Source: 451 Research, LLC., 1Q2020.

37
Diversified and Resilient

                         Anchored by large and diversified tenant base with low dependence
                          on any single tenant or trade sector
    Stable and
                         Long leases in MIT’s data centres in Singapore and North America as
 Resilient Portfolio
                          well as build-to-suit projects to underpin portfolio resilience
                         Focus on tenant retention to maintain a stable portfolio occupancy

                         Raised about S$410.0 million from private placement to fund the
        Enhanced
                          US Acquisition
        Financial
                         Aggregate leverage ratio of 38.8% provides sufficient headroom for
        Flexibility
                          investment opportunities

        Growth by        Proposed acquisition of the remaining 60.0% interest in the 14 data
     Acquisitions and     centres in the United States
      Developments       Commenced works for redevelopment of the Kolam Ayer 2 Cluster

38
End of Presentation
For enquiries, please contact Ms Melissa Tan, Director, Investor Relations,
DID: (65) 6377 6113, Email: melissa.tanhl@mapletree.com.sg
You can also read