Paratransit as a Complement to Formal Transport Networks
←
→
Page content transcription
If your browser does not render page correctly, please read the page content below
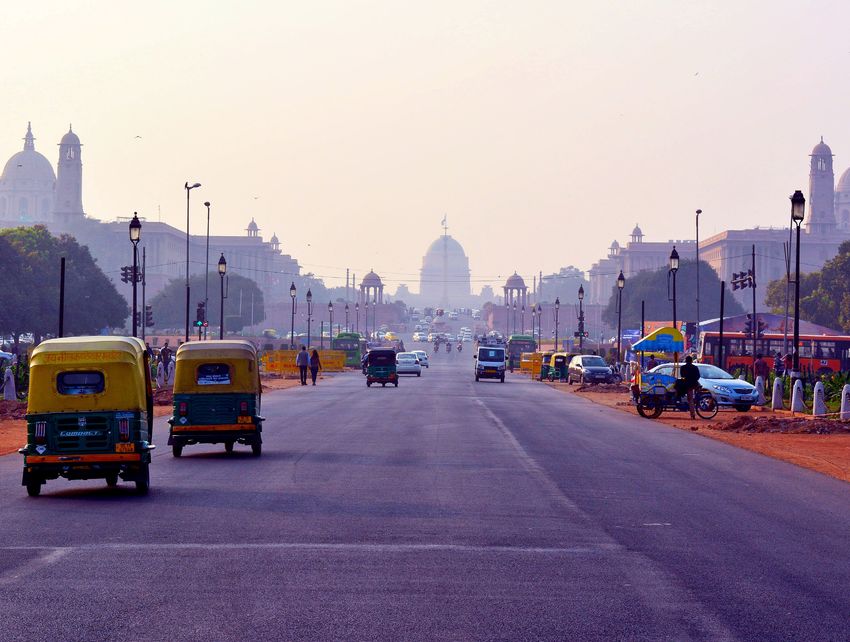
Focus Feature 6

      Paratransit as a
      Complement to
      Formal Transport
      Networks                                                                                                       Photo credits: Unspalsh

      P          aratransit    (sometimes    called    “informal
                 transport”) is an essential service for moving
                 people and goods in low- and middle-income
      countries. It includes the use of minibus taxis and other
      private vehicles for hire and is an increasingly popular
                                                                    oversight than formal public transport services.5 This
                                                                    can result in poorly maintained vehicles, unsafe driver
                                                                    behaviour and fierce competition among operators for
                                                                    routes and passengers.6 However, paratransit services are
                                                                    usually still subject to regulation on licencing, routes, and
      transport mode in rapidly urbanising cities in Africa, Asia   fares, making the term “informal transport” misleading.
      and Latin America. Paratransit users are often middle- and    Because these modes are viewed as less formal (and
      low-income individuals, or citizens who lack convenient       typically less desirable), planning and operations are
      and affordable access to formal transport services. This      often neglected. However, paratransit plays a critical role
      sidebar will focus on examples from Africa.                   in expanding collective transport options and providing
                                                                    vulnerable populations with access to essential services
      In some cities in Sub-Saharan Africa, up to 80% of
                                                                    and opportunities.
      the population relies on paratransit.1 For example, in
      Kampala, Uganda the fleet of private minibus taxis grew
                                                                    Some governments have made efforts to improve the
      5.4% annually since 2015, totalling 16,000 vehicles and
                                                                    quality of paratransit and to better integrate these informal
      carrying 82.6% of commuters that year.2 In South Africa,
                                                                    systems alongside more formal public transport services,
      the share of inhabitants using minibus taxis reached
                                                                    which declined around 30% per capita in developing
      44.1% in Gauteng province and 39.6% in the Eastern Cape
                                                                    country cities between 1995 and 2012.7 In African cities
      and Mpumalanga in 2018.3 Paratransit also drives local
                                                                    such as Cape Town, Dar es Salaam, Johannesburg
      employment, with the services directly employing around
                                                                                                                                               Photo Credit: Phuoc Anh Dang

                                                                    and Lagos, flexible and responsive paratransit services
      100,000 people in Kampala in 2015. 4
                                                                    provide a crucial supplement to formal bus rapid transit
                                                                    systems, which mainly serve transport demand along
      Paratransit operations often rely on privately owned,
                                                                    major travel corridors.8
      second-hand vehicles, which tend to face less government

238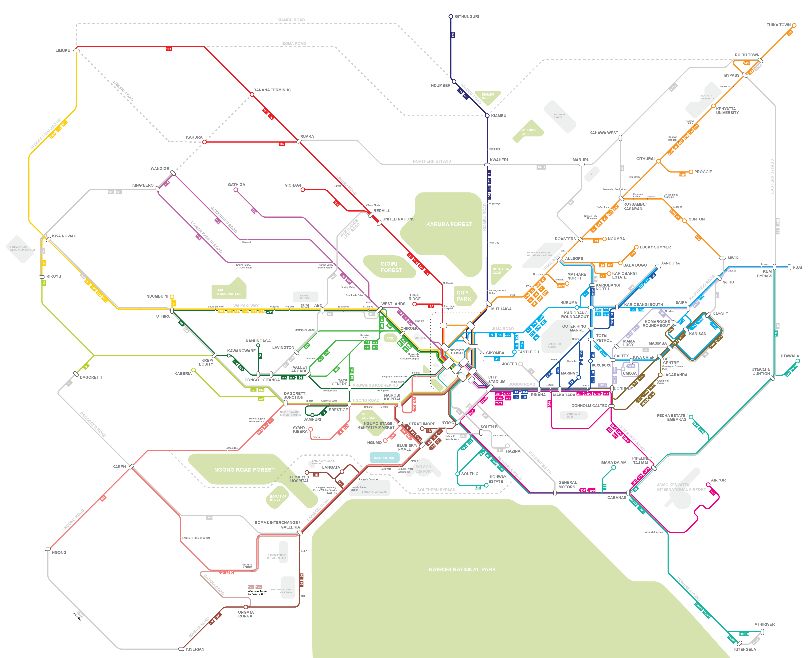
Focus Features
             S L O C AT T r a n s p o r t a n d C l i m a t e C h a n g e G l o b a l S t a t u s R e p o r t – 2 n d e d i t i o n

Technological interventions have helped to integrate                                                      can lead to uneven service quality, vehicle degradation,
paratransit with more formal networks. The use of                                                         and congestion, which increases emissions due to
geolocation data (via mobile phones) provides more                                                        frequent start-and-stop patterns and rapid acceleration
information on routes and stops, making it possible to                                                    and deceleration.12 However, large knowledge and
match passenger demand and supply and to improve the                                                      research gaps remain regarding both paratransit overall
efficiency of both informal and formal transport services.9                                               and its impacts on the environment and climate.13
The Digital Matatus project mapped informal bus services
across Nairobi, Kenya (see Figure 10), improving both                                                     Governments can take numerous policy actions around
accessibility for users and planning opportunities for                                                    paratransit, including increased regulation, imposing
city officials.10 However, additional efforts are needed to                                               vehicle maintenance requirements and supporting
move beyond mapping and towards improved paratransit                                                      electrification of minibus fleets.14 More applied research
planning in cities, so these services can complement                                                      and coordinated action on paratransit operations can
large-scale transport reform through bus rapid transit and                                                increase the potential impact of these policies on reducing
other corridor-based systems.                                                                             emissions and improving air quality in developing
                                                                                                          countries.15
Paratransit contributes to urban air pollution because the
vehicles are often old and poorly maintained and rely on
reconditioned diesel engines, which produce higher local
emissions.11 A lack of formal scheduling and fixed routes

Figure 1.	Map of paratransit services in Nairobi, Kenya

                                                                                                                                                                        239
Methodological Note
Tr a n s p o r t a n d C l i m a t e C h a n g e G l o b a l S t a t u s R e p o r t - 2 nd e d i t i o n
Annex: Methodological Note
Data usage
Time period for data: Secondary data:
The report strives to utilise the most recent SLOCAT relies on secondary data and
publicly available data and information information collected and provided
just prior to the time of publication (as of by SLOCAT partners and other entities
31 May 2021). The figures in the report and does not make use of any internal
were developed between September and modelling tools.
December 2020 using the most recent
data available.
Data on sustainable mobility: A call to action EDGAR provides estimates for fossil CO2 emissions from all
The report benefits directly from data collected by a wide range anthropogenic activities with the exception of land use, land-use
of stakeholders working in different areas of transport. change, forestry and the large-scale burning of biomass. The
main activities covered are CO2 emissions emitted by the power
Data are important for providing a comprehensive picture of the
sector (i.e., power and heat genertion plants), by other industrial
status of sustainable, low carbon transport and are essential for
combustion (i.e., combustion for industrial manufacturing and fuel
both policy and investment decision making. In these times of
production) and by buildings and other activities such as industrial
change, it is critical to upgrade data and policy collection and
process emissions, agricultural soils and waste. Transport activities
interpretation capacities to better understand progress and the
covered within EDGAR include road transport, non-road transport,
hurdles that must be addressed.
domestic aviation, and inland waterways on a country level, as well
The data limitations mentioned below are not new. Obtaining as international aviation and shipping.1
regular, reliable and public data across regions and transport
For the world, regions and countries, the CO2 emission data
modes remains an outstanding issue. When an increasing
(provided by EDGAR) span through 2019. In a few places in the
number of stakeholders are collecting data and policy information,
report, CO2 data for 2020 are shown to illustrate the impact of the
more and better open-access data and capacity building efforts
COVID-19 pandemic; however, these data are based on a different
for data interpretation are supported by many multi-stakeholder
methodology than the EDGAR dataset and should not be compared
partnerships in the sustainable, low carbon movement.
directly with the data from previous years.
If you share our passion for open-access data and knowledge
The latest CO2 emission data for individual transport modes are for
towards greater impact on policy and investment decision
2018 and have been compiled only at the global level. For passenger
making worldwide and/or would like to contribute data or
and freight transport, the data on global CO2 emissions are for 2017,
knowledge to our collective efforts on this report, please reach
as this is the latest year with robust data. Data on passenger activity
out to the research team in the SLOCAT Secretariat at tcc-
(passenger-kilometres) and freight activity (tonne-kilometres) –
gsr@slocatpartnership.org.
provided mainly in the country fact sheets – are based on the latest
available year, as indicated in the report analysis.
Specific data used in this report Information on greenhouse gas emissions – provided in CO2 equivalent
Data on emissions (CO2eq) – include not only CO2 but also methane, nitrous oxide, and
industrial gases such as hydrofluorocarbons, perfluorocarbons, sulphur
The data in this edition of the report point to the direct carbon
hexafluoride and nitrogen trifluoride.2 These data are less up-to-date. As
emissions from transport activity; they do not cover the indirect
of 31 May 2021, data on greenhouse gas emissions were not readily
emissions and land-use impacts associated with certain modes of
available for the period 2019-2020. In some cases, additional data
transport. The report primarily utilises CO2 emission data compiled in
sources were used to provide detailed information about other climate
the Emissions Database for Global Atmospheric Research (EDGAR)
pollutants besides CO2.
from the Joint Research Centre of the European Commission, as this
represents the most recent, comprehensive dataset on transport All data on CO2 and other greenhouse gas emissions, as well as
CO2 emissions. However, this global dataset does not convey in full CO2eq, are provided in metric tonnes.
detail the unique situations of individual countries.
240Methodological Note
Annex
Data on car ownership Criteria for selection
Information on car ownership rates is based on a global dataset The report covers policies, targets, emission reductions (achieved or
from the International Organization of Motor Vehicle Manufacturers envisioned) and market measures. To merit inclusion in the analysis,
(OICA), with the latest release (as of 31 May 2021) dating from the policies, projects and trends must have been announced or
2015.3 Although newer information is available for some individual completed between 2018 and 2020. Significant developments from
countries, using these data would hinder accurate global January through May 2021 were included when deemed relevant, with
comparisons. Data on passenger and commercial vehicle sales the understanding that the next edition of the Transport and Climate
were available only up to 2019. Change Global Status Report will cover a period starting in 2021.
Policy landscape data Pre- and post-COVID-19 pandemic trends
The policy-related information presented in this report is not intended The year 2020 was pivotal for the world, and the COVID-19
to be comprehensive. The data for the policy landscape indicators pandemic has had substantial impacts on many of the transport
provided in Section 3 were gathered through desk research unless trends monitored in this report. This edition attempts to differentiate
otherwise indicated. Barriers to accessing such information include between long-term trends and impacts due to the pandemic. To the
language and limited availability of information through online extent possible, the analysis notes “pre-pandemic” (up to the end
media (e.g., websites, press releases and news articles). of 2019 or latest by February 2020) and “during pandemic” trends
(starting in March 2020 until the end of 2020), as in some cases the
Data in country fact sheets
pandemic led to reversals in long-term trends, at least for a specific
Information in the fact sheets is based on desk research and
period of time. In each section, a box describes the impacts that the
on contributions from the national focal points. The data were
pandemic has had on specific regions and sub-sectors.
collected to the best of the authors’ knowledge and based on data
availability, and thus may not be complete or show the most recent
status. When no information was available for a given indicator, the Assembling the report
term “Not available” is used. Global Strategy Team
This edition of the report was guided by a global strategy team
Data gaps
consisting of 20 experts in the field who provided inputs over the
Major data gaps exist in areas where there is no globally accepted
span of six meetings between September 2019 and October 2020.
data collection methodology. For example, the mapping of cycling
Additionally, small group consultations were organised in February
and walking infrastructure is not currently done in all regions.
2021, following the peer review process.
Also, the modal share can be surveyed through different methods,
leading to inconsistencies in available data. In addition, data on Authors and contributors
paratransit (informal transport), a predominant form of transport The report was collaboratively drafted by 22 authors and contributors
in many parts of the world, are largely lacking. This results in an from 16 organisations, led by the SLOCAT Secretariat. This includes
incomplete picture of the impact of transport on climate change and additions and high-level inputs from the copy editor and from the
sustainable development. special advisor who also co-authored the Executive Summary.
Authors researched and compiled relevant facts and figures for
the five sections of the report, including the Focus Features, with
Methodological approach
supporting review and inputs from several other organisations.
Countries and regions
The report follows the M49 Standard of the United Nations Statistics Peer review: A peer review process was carried out from 18
Division.4 In total, 196 countries have official United Nations December 2020 to 20 January 2021 with 1,700 comments received
membership and are also party to the United Nations Framework from 74 reviewers. Each comment was individually reviewed by the
Convention on Climate Change. The available data have been put in SLOCAT Secretariat and considered in finalising the report.
a common structure for the United Nations member countries, regions
National focal points: The report benefited from the contributions
and income groups to enable a consistent assessment. Income groups
of voluntary national focal points, or experts from various regions
are based on the World Bank’s classification of 2019.5
and countries who have been essential to overcome language
Economic calculations and information barriers. A public call for participation to provide
The per capita and gross domestic product (GDP) calculations are information on policies and data resulted in several hundred initial
based on the United Nations World Population Prospects 2019 and registrations. Out of these registrations, 78 national focal points
on World Bank GDP data using constant 2010 USD.6 provided inputs through a first survey from 24 January to 3 February
2020; and through a second survey (focused on the country fact
Spatial and temporal scales
sheets) from 6 to 30 August 2020. All national focal points that
The geographic scale (global, national, city-level, etc.) as well as time
contributed to the surveys are listed in the Acknowledgements.
scale (annual, monthly, daily) used in this report depends largely on
the available dataset, as noted in the relevant figures and text. The
detailed data forming the basis of the calculations and analysis are
provided in the SLOCAT Transport Knowledge Base.7
241Endnotes
Tr a n s p o r t a n d C l i m a t e C h a n g e G l o b a l S t a t u s R e p o r t - 2 nd e d i t i o n
Endnotes
Focus Feature 6 | Paratransit as a Complement to
Formal Transport Networks
1 SLOCAT Partnership on Sustainable, Low Carbon Transport, “Informal transport,”
global Transport Knowledge Partnership, International Road Federation, https://
www.gtkp.com/themepage.php&themepgid=467 (accessed April 9, 2021).
2 I. Ndibatya and M. J. Booysen (2020), “Minibus taxis in Kampala’s paratransit
system: Operations, economics and efficiency,” Journal of Transport Geography,
Vol. 88, p. 102853, Elsevier Ltd, https://www.sciencedirect.com/science/article/pii/
S0966692320304415.
3 Government of South Africa, “Transport,” https://www.gov.za/about-sa/transport
(accessed April 9, 2021).
4 Ndibatya and Booysen, op. cit. note 2.
5 Ibid.
6 S. Dumba (2017), “Informal public transport driver behaviour and regulatory
policy linkage: An expose,” Journal of Transport and Supply Chain Management,
Vol. 11/0, AOSIS, https://doi.org/10.4102/jtscm.v11i0.315.
7 R. Kaenzig, D. C. Mettke and P. Mariano (2019), Reforming the (Semi-)informal
Minibus System in the Philippines: The ‘Public Utility Vehicle Modernization
Program’ Early Route Evaluation, Deutsche Gesellschaft für Internationale Zusam-
menarbeit (GIZ) GmbH, Bonn and Eschborn, https://www.changing-transport.org/
wp-content/uploads/2019-11_GIZ_Jeepney-Modernisation_Early-Evaluation_fi-
nal.pdf; C. Venter, A. Mahendra and D. Hidalgo (2019), From Mobility to Access
for All: Expanding Urban Transportation Choices in the Global South, World
Resources Institute, Washington, DC, https://files.wri.org/s3fs-public/from-mobility-
to-access-for-all.pdf.
8 J. M. Klopp and C. Cavoli (2019), “Mapping minibuses in Maputo and Nairobi: en-
gaging paratransit in transportation planning in African cities,” Transport Reviews,
Vol. 39/5, pp. 657-76, Routledge, https://doi.org/10.1080/01441647.2019.159851
3.
9 Ibid.; T. H. Tun et al. (2020), Informal and Semiformal Services in Latin America: An
Overview of Public Transportation Reforms, Inter-American Development Bank,
Washington, D.C., https://doi.org/10.18235/0002831.
10 Digital Matatus (2015), “The Digital Matatus Project,” http://digitalmatatus.com/
about.html (accessed April 9, 2021).
11 V. K. Phun and Y. Tetsuo (2016), “State of the art of paratransit literatures in Asian
developing countries,” Asian Transport Studies, Vol. 4/1, pp. 57-77, Eastern
Asia Society for Transportation Studies, https://doi.org/10.11175/eastsats.4.57;
J. R. F. Regidor, K. N. Vergel and S. G. Napalang (2009), “Environment friendly
paratransit: Re-engineering the jeepney,” Proceedings of the Eastern Asia Society
for Transportation Studies (Vol. 7), https://www.jstage.jst.go.jp/article/east-
pro/2009/0/2009_0_272/_pdf/-char/ja.
12 Ndibatya and Booysen, op. cit. note 2.
13 A. Ardila-Gomez and A. Ortegon-Sanchez (2016), Sustainable Urban Transport
Financing from the Sidewalk to the Subway: Capital, Operations, and Maintenance
Financing, World Bank, Washington, D.C., https://doi.org/10.1596/978-1-4648-
0756-5.
14 R. Á. Fernández (2019), “Method for assessing the environmental benefit of road
transport electrification and its influence on greenhouse gas inventories,” Journal
of Cleaner Production, Vol. 218, pp. 476-85, Elsevier Ltd, https://doi.org/10.1016/j.
jclepro.2019.01.269.
15 Ibid.
Annex: Methodological Note
1 M. Crippa et al. (2020), Fossil CO2 Emissions of All World Countries, JRC Science
for Policy Report, Publications Office of the European Union, Luxembourg, https://
ec.europa.eu/jrc/en/publication/eur-scientific-and-technical-research-reports/fos-
sil-co2-emissions-all-world-countries-2020-report.
2 US Energy Information Administration (2020), “Energy and the environment
explained: Greenhouse gases,” https://www.eia.gov/energyexplained/ener-
gy-and-the-environment/greenhouse-gases.php (accessed 14 April 2021).
3 International Organization of Motor Vehicle Manufacturers (OICA), “Definitions”,
https://www.oica.net/wp-content/uploads/DEFINITIONS-VEHICLE-IN-USE1.pdf
(accessed 20 May 2021).
4 United Nations Statistics Division, “Standard country or area codes for statistical
use (M49)”, https://unstats.un.org/unsd/methodology/m49 (accessed 20 May
2021).
5 World Bank (2021), “World Bank Country and Lending Groups”, https://datahelp-
desk.worldbank.org/knowledgebase/articles/906519 (accessed 20 May 2021).
6 United Nations (2019), “World Population Prospects 2019”, https://population.
un.org/wpp (accessed 20 May 2021); World Bank, “GDP (constant 2010 US$)”,
http://data.worldbank.org/indicator/NY.GDP.MKTP.KD (accessed 20 May 2021).
7 SLOCAT (2021), “Transport Knowledge Base”, https://slocat.net/our-work/knowl-
edge-and-research/trakb (accessed 20 May 2021).
242Tracking Trends in a Time of
Change: The Need for Radical
Action Towards Sustainable
Transport Decarbonisation
SLOCAT Transport and Climate
Change Global Status Report
2nd Edition
This report should be cited as:
SLOCAT (2021), Tracking Trends in a Time of Change: Explore more online
The Need for Radical Action Towards Sustainable Transport
Decarbonisation, Transport and Climate Change Global
Download the full report
Status Report – 2nd edition, www.tcc-gsr.com.
Data access and licensing:
Download the full endnotes
Attribution 4.0 International (CC BY 4.0) Share — copy and
redistribute the material in any medium or format. Adapt —
remix, transform and build upon the material for any purpose. Contact us
Attribution — you must give appropriate credit, provide a link
to the licence and indicate if changes were made.
The development of this report was led by Maruxa Cardama,
Angel Cortez, Nicolas Cruz, Angela Enriquez, Emily Hosek,
Karl Peet, Nikola Medimorec, Arturo Steinvorth and
Alice Yiu from the secretariat of the SLOCAT Partnership.
For a full list of acknowledgements, please visit the the
online page here.
#TransportClimateStatusYou can also read