Investor Presentation May 2020 - Mapletree Industrial ...
←
→
Page content transcription
If your browser does not render page correctly, please read the page content below
Investor Presentation May 2020
Important Notice
This presentation shall be read in conjunction with Mapletree Industrial Trust’s (“MIT”) financial results for Fourth Quarter
Financial Year 2019/2020 in the SGXNET announcement dated 27 April 2020.

This presentation is for information only and does not constitute an offer or solicitation of an offer to sell or invitation to
subscribe for or acquire any units in Mapletree Industrial Trust (“Units”).

The past performance of the Units and MIT is not indicative of the future performance of MIT or Mapletree Industrial Trust
Management Ltd. (the “Manager”).

The value of Units and the income from them may rise or fall. Units are not obligations of, deposits in or guaranteed by the
Manager or any of its affiliates. An investment in Units is subject to investment risks, including the possible loss of the
principal amount invested. Investors have no right to request the Manager to redeem their Units while the Units are listed. It is
intended that unitholders may only deal in their Units through trading on the Singapore Exchange Securities Trading Limited
(“SGX-ST”). Listing of the Units on the SGX-ST does not guarantee a liquid market for the Units.

This presentation may also contain forward-looking statements that involve risks and uncertainties. Actual future
performance, outcomes and results may differ materially from those expressed in forward-looking statements as a result of
risks, uncertainties and assumptions. Representative examples of these factors include general industry and economic
conditions, interest rate trends, cost of capital, occupancy rate, construction and development risks, changes in operating
expenses (including employees wages, benefits and training costs), governmental and public policy changes and the
continued availability of financing. You are cautioned not to place undue reliance on these forward-looking statements, which
are based on current view of management on future events.

Nothing in this presentation should be construed as financial, investment, business, legal or tax advice and you should
consult your own independent professional advisors.

2
Contents

    1      Overview of Mapletree Industrial Trust

    2      Portfolio Highlights

    3      4Q & FY19/20 Financial Performance

    4      Outlook and Strategy

3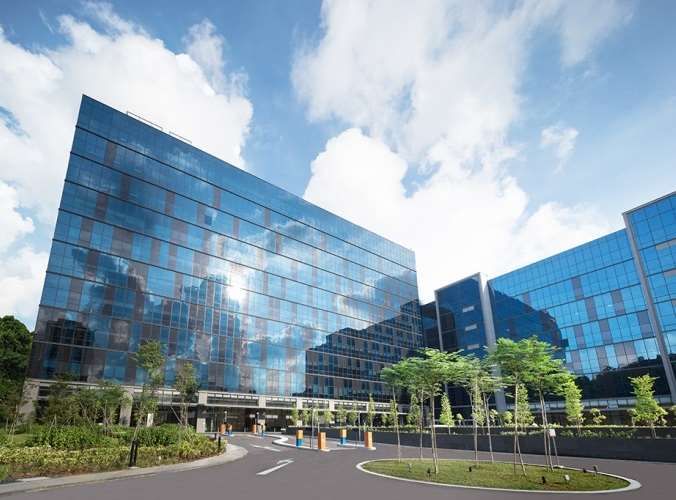
OVERVIEW OF
                        MAPLETREE INDUSTRIAL TRUST

Hi-Tech Buildings, 44490 Chilum Place (ACC2), Northern Virginia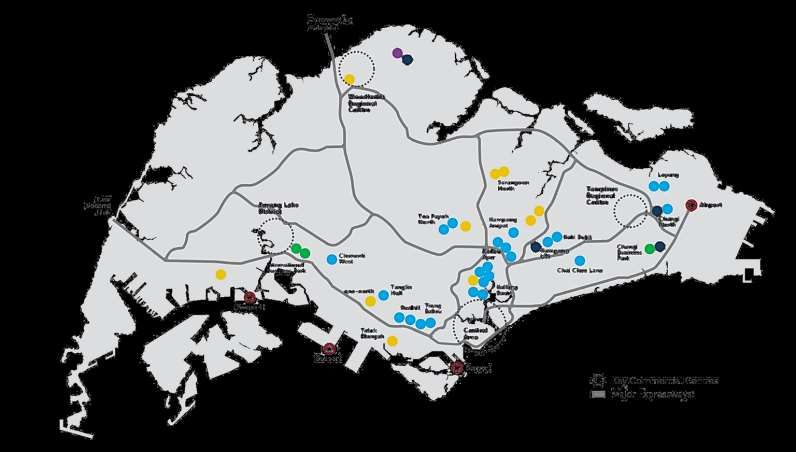
Overview of Mapletree Industrial Trust
                            Mapletree Investments Pte Ltd                                                  Public & Inst
                                                                                                                                            MIPL
Sponsor                     (“MIPL”)                                                                       Unitholders

                                                                                                         70.8%                                     29.2%
                            Owns 29.2% of MIT                                                                                                                   Trustee

                            Focused on (i) industrial real estate
                            assets in Singapore, excluding                                                                                                     Manager
Investment
                            properties primarily used for logistics
mandate
                            purposes and (ii) data centres
                                                                                                                           MIT Portfolio                       Property
                            worldwide beyond Singapore                                                                                                         Manager

                                                                                                                             Light Industrial
                            114 properties valued at S$5.9 billion1                                                             Buildings
Portfolio                                                                                                     Stack-up/Ramp-up    1.3%
                            20.9 million2 sq ft NLA                                                               Buildings
                                                                                                                    8.3%
                                                                                                        Business Park                                         Hi-Tech
                            Mapletree Industrial Trust                                                    Buildings                                          Buildings
                                                                                                            9.9%                                               55.0%
Manager                     Management Ltd.
                            100% owned by the Sponsor                                                                                  AUM1
                            Mapletree Facilities Services                                               Flatted                    S$5.9 billion      7.2%
                                                                                                                                                             Data Centres
Property                                                                                               Factories
                            Pte. Ltd.                                                                   25.5%
                                                                                                                                                             (Singapore)
Manager
                            100% owned by the Sponsor
                                                                                                                                            24.4%
                                                                                                                                                       Data Centres
Trustee                     DBS Trustee Limited                                                                                                        (North America)

1   Based on MIT’s book value of investment properties as well as MIT’s interests of the joint
                                                                                                        Portfolio value by geography
    ventures with MIPL in a portfolio of 14 data centres in the United States and three fully fitted
    hyperscale data centres and 10 powered shell data centres in North America and included
                                                                                                        Singapore                                                   75.6%
    MIT’s right of use assets of S$25.2 million as at 31 Mar 2020.
2   Excludes the parking decks (150 Carnegie Way and 171 Carnegie Way) at 180 Peachtree,
                                                                                                        North America                                               24.4%
5   Atlanta.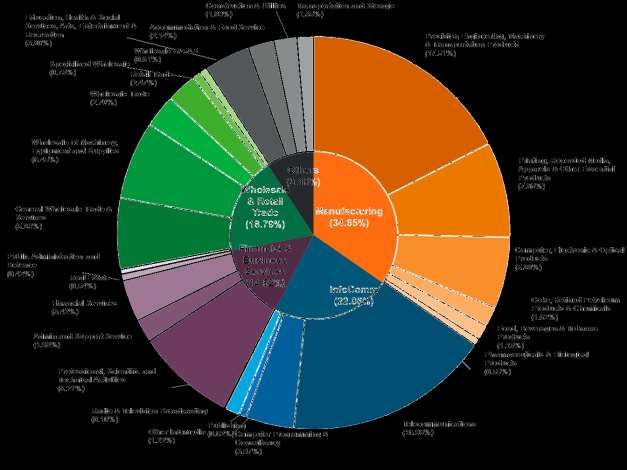
Sustainable and Growing Returns
Distributable Income DPU
(S$ million) (cents)
100 3.50
3.13 3.16
3.07 3.08 3.10
90 3.00
2.95
3.00 3.01
2.92 2.85
2.85 2.832.83 2.88 2.88 3.00
2.79 2.82 2.81
2.73
80 2.67 2.65
2.60
2.43 2.47 2.512.512.51
2.32
2.37 69.4 69.2 2.50
70 2.29
2.22 2.26
2.16 63.2 63.5
2.05 59.9
1.98 58.3
60 1.93 55.5
56.9 56.7
52.9 54.0 53.5 2.00
51.8
50.350.4 51.5 50.6 51.1
48.2 48.9
50 45.4 46.0 46.7
1.52
42.6 42.8
41.1 42.2
37.7 38.9
40.2 1.50
40 36.9 37.5
35.2 35.8
31.6
28.3 29.0
30 1.00
22.3
20
0.50
10
0 0.00
3Q¹ 4Q 1Q 2Q 3Q 4Q 1Q 2Q 3Q 4Q 1Q 2Q 3Q 4Q 1Q 2Q 3Q 4Q 1Q 2Q 3Q 4Q 1Q 2Q 3Q 4Q 1Q 2Q 3Q 4Q 1Q 2Q 3Q 4Q 1Q 2Q 3Q 4Q
FY10/11 FY11/12 FY12/13 FY13/14 FY14/15 FY15/16 FY16/17 FY17/18 FY18/19 FY19/20
Distributable Income (S$ million) DPU (cents)
1 MIT was listed on 21 Oct 2010.
6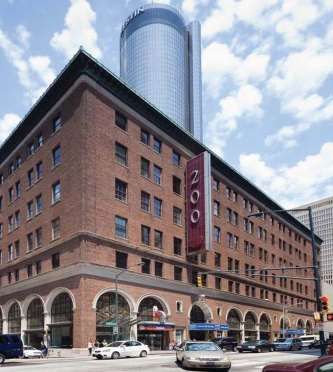
Healthy Returns since IPO

    COMPARATIVE TRADING PERFORMANCE SINCE IPO¹
                   350

                                                                                                                    MIT UNIT PRICE
                   300                                                                                                 +173.1%

                   250

                   200

                                                                                                                  FTSE ST REITS INDEX
                   150                                                                                                  +11.5%

                   100

                                                                                                               FTSE STRAITS TIMES INDEX
                    50                                                                                                  -18.5%

                     0
                     Oct 10     Oct 11      Oct 12     Oct 13     Oct 14     Oct 15     Oct 16        Oct 17       Oct 18     Oct 19

                          Rebased MIT Unit Price         Rebased FTSE ST REITS Index             Rebased FTSE Straits Times Index

    MIT’s Return on                                                      Capital                   Distribution                          Total
    Investment                                                      Appreciation                          Yield                         Return
    Listing on 21 Oct 2010 to 8 May 2020                                   173.1%²                       107.7%³                       280.8%4

    ¹   Rebased MIT’s issue price of S$0.930 and opening unit prices of FTSE ST REITs Index and FTSE Straits Times Index on
        21 Oct 2010 to 100. Source: Bloomberg.
    ²   Based on MIT’s closing unit price of S$2.540 on 8 May 2020.
    ³   MIT’s distribution yield is based on DPU of S$1.001 over the issue price of S$0.930.
7   ⁴   Sum of distributions and capital appreciation for the period over the issue price of S$0.930.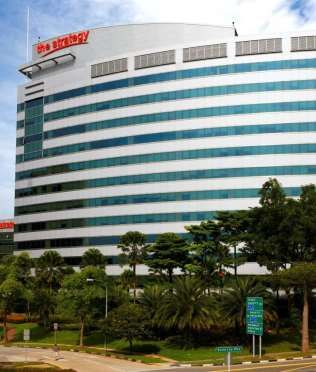
Diverse Portfolio of 114 Properties
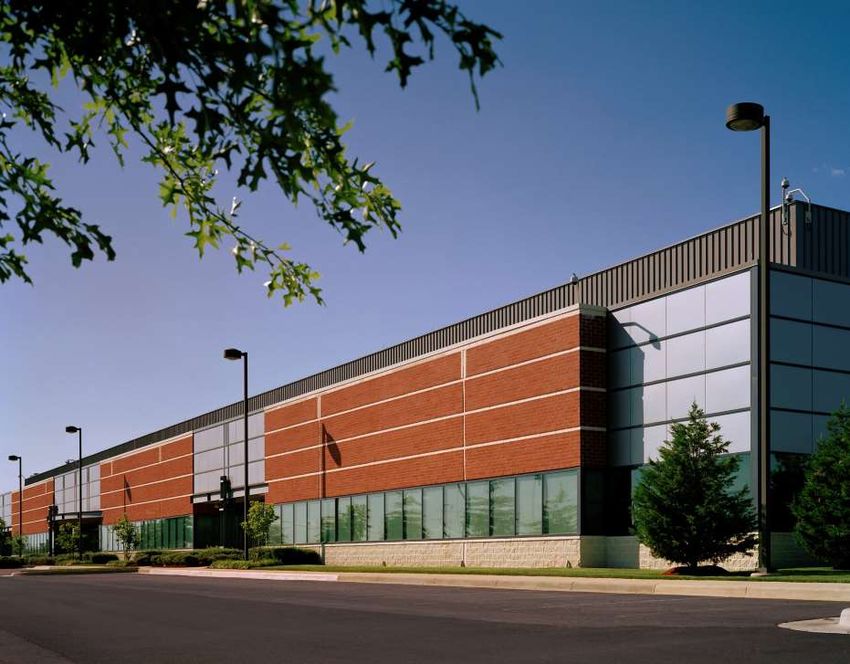
HI-TECH BUILDINGS BUSINESS PARK BUILDINGS
High specification industrial buildings with High-rise multi-tenanted buildings in specially
higher office content for tenants in technology designated “Business Park zones”. Serve as
and knowledge-intensive sectors. Usually regional headquarters for MNCs as well as
fitted with air-conditioned lift lobbies and spaces for R&D and knowledge-intensive
common areas. enterprises.
HI-TECH BUILDINGS – STACK-UP/RAMP-UP
DATA CENTRES BUILDINGS
Facilities used primarily for the storage and Stacked-up factory space with vehicular
processing of data. These include core-and-shell access to upper floors. Multi-tenanted space
to fully-fitted facilities, which include building suitable for manufacturing and assembly
fit-outs as well as mechanical and electrical activities.
systems.
FLATTED FACTORIES LIGHT INDUSTRIAL
BUILDINGS
High-rise multi-tenanted industrial buildings
with basic common facilities used for light Multi-storey developments usually
manufacturing activities. occupied by an anchor tenant for light
manufacturing activities.
8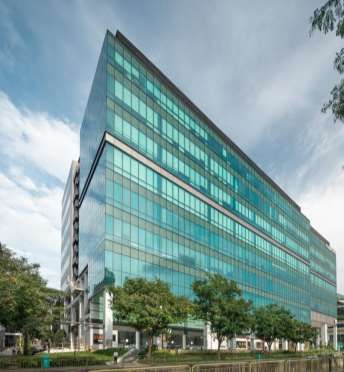
87 Properties in Singapore

Total                        WALE        Weighted Average Unexpired          Occupancy
NLA                          (By GRI)1   Lease Term of Underlying Land1      Rate2

16.6m sq ft 3.4 years                    36.1 years                          90.7%

                                                                          Hi-Tech Buildings
                                                                          Flatted Factories
                                                                          Business Park Buildings
                                                                          Stack-up/Ramp-up Buildings
                                                                          Light Industrial Buildings

    1   As at 31 Mar 2020.
    2   For 4QFY19/20.
9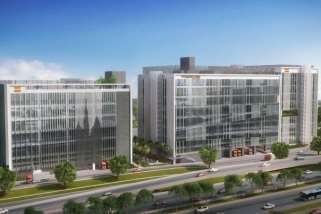
27 Data Centres Across North America

Total                                        WALE                                 Weighted Average Unexpired                                         Occupancy
NLA1                                         (By GRI)2                            Lease Term of Underlying Land3                                     Rate4

4.3m sq ft                                   7.4 years                            Freehold                                                           98.7%

                                                                                                                      Ontario
                                                                                                                           1
                                                                                         Wisconsin
                                                                                               1

                                                                                                              1
                                                                                                      Michigan                                   1   Massachusetts
                                                                                                                           Pennsylvania
                                                                                                                                             1
                                                                                                                                1
                                                                                                                                         New Jersey
                                                                2

                                                             Denver                                                                 6    Virginia
                                   1

                            California                                                                    1                     2       North Carolina
                                                                                                     Tennessee
                                                        1
                                                 Arizona                                                          1    3
                                                                          1   3
     MRODCT Portfolio (13 data centres)                                                                       Georgia
                                                                         Texas
     MRDCT Portfolio (14 data centres)
     *Number of data centres indicated in the circles

     1    Excluded the parking decks (150 Carnegie Way and 171 Carnegie Way) at 180 Peachtree, Atlanta.
     2    As at 31 Mar 2020.
     3    All properties are sited on freehold land, except for the parking deck (150 Carnegie Way) at 180 Peachtree, Atlanta and 2055 East Technology Circle, Phoenix.
10   4    For 4QFY19/20.
Portfolio Growth since IPO
S$5.9b
3 Asset Enhancement FY19/20
Initiatives (“AEI”)
5 Build-to-Suit (“BTS”) S$4.8b
FY18/19
Projects S$4.3b
6 Acquisitions FY17/18
S$3.7b
BTS
S$3.6b FY16/17 Jul 2019
S$3.4b FY15/16 Kolam Ayer 2
S$3.2b FY14/15 S$263m
S$2.9b FY13/14
S$2.7b Acquisition
FY12/13
Sep 2019
FY11/12 13 North
S$2.2b1
American Data
FY10/11 BTS Centres3
AEI Acquisition
Jun 2017 US$1,368m
Jul 2013 May 2014
2A Changi 1 & 1A
Woodlands
North Street 2 Depot Close Acquisition
Central
S$14m S$226m Jun 2018
S$30m
Acquisition Upgraded 7 Tai
Jul 2011 Seng Drive to a
BTS BTS Acquisition
11 Flatted Data Centre
Factories Oct 2013 Jan 2015 Dec 2017
S$95m
K&S Corporate 26A Ayer 14 US Data
S$400m
Headquarters Rajah Centres²
BTS
S$50m Crescent US$750m
Jul 2018
S$108m
Mapletree
AEI Sunview Drive 1
AEI
Feb 2018 S$76m
Jan 2014
FY10/11 FY11/12 FY12/13 FY13/14 FY14/15 FY15/16 30A Kallang
FY16/17 FY17/18 FY18/19 FY19/20
Toa Payoh
Place
North 1
S$77m Acquisition
S$40m
Feb 2019
1 Valuation of investment properties on 31 Mar at end of each financial year. 18 Tai Seng
2 Acquired through a 40:60 joint venture with MIPL.
11 3
S$268m
Acquired through a 50:50 joint venture with MIPL.Reputable Sponsor with Aligned Interest
About the Sponsor, Mapletree Investments
Leading real estate development, investment, capital and property management company
As at 31 Mar 2019, the Sponsor owns and manages S$55.7 billion of assets across Asia Pacific,
North America and Europe, of which S$9.8 billion is located in North America
Right of first refusal (“ROFR”) to MIT over future sale of (i) 60% interest in the MRDCT Portfolio and
(ii) 50% interest in the MRODCT Portfolio
Ontario 311 South Wacker
Drive, Suite 520,
1 Chicago, IL 60606
Wisconsin
1
1
Michigan 1 Massachusetts
M Pennsylvania M
1
1
New Jersey
2
Denver 6 Virginia
1 World Trade Center, 1
24th Floor, Long Beach, 5 Bryant Park, 28th
California 1 2
CA 90831 North Carolina Floor, New York,
M Tennessee
NY 10018
1 M
Arizona M
M MIPL's Offices in the US 1 3
1 3
MRODCT Portfolio (13 data centres) Georgia
Texas 180 Peachtree Street,
Suite 610, Atlanta, GA
MRDCT Portfolio (14 data centres)
30303
*Number of data centres indicated in the circles 14800 Quorum Drive,
Suite 287,
Dallas, TX 75254
12PORTFOLIO
HIGHLIGHTS
Hi-Tech Buildings, build-to-suit project for HPPortfolio Overview
North American
Singapore Portfolio Overall Portfolio
Portfolio
Number of properties 87 27 114
NLA (million sq ft) 16.6 4.31 20.91
97.8% 98.7%
90.5% 90.7% 90.9% 91.5%2
1 Excludes the parking decks
(150 Carnegie Way and 171 Carnegie
Way) at 180 Peachtree.
2 Based on MIT’s 40% interest of the
joint venture with MIPL in a portfolio
of 14 data centres in United States
through Mapletree Redwood Data
Centre Trust (“MRDCT”) and 50%
interest of the joint venture with MIPL in
three fully fitted hyperscale data centres
and 10 powered shell data centres in Singapore Portfolio North American Portfolio Overall Portfolio
North America through Mapletree
Rosewood Data Centre Trust Left Bar Right Bar
(“MRODCT”). (3QFY19/20) (4QFY19/20)
14Lease Expiry Profile
EXPIRING LEASES BY GROSS RENTAL INCOME1
As at 31 March 2020
WALE based on date of commencement of leases (years)2
Singapore Portfolio 3.4
North American Portfolio 7.4 30.3%
Overall Portfolio1 4.2
19.7%
17.7% 17.0%
15.3%
FY20/21 FY21/22 FY22/23 FY23/24 FY24/25 & Beyond
Flatted Factories Hi-Tech Buildings North American Data Centres
Business Park Buildings Stack-up / Ramp-up Buildings Light Industrial Buildings
1 Based on MIT’s 40% interest of the joint venture with MIPL in a portfolio of 14 data centres in United States through MRDCT and 50% interest
of the joint venture with MIPL in three fully fitted hyperscale data centres and 10 powered shell data centres in North America through MRODCT.
2 Refers to leases which commenced prior to and on 31 Mar 2020.
15Large and Diversified Tenant Base
TOP 10 TENANTS BY GROSS RENTAL INCOME1
As at 31 March 2020
8.0%
Over 2,200 tenants
Largest tenant contributes 8.0% of Portfolio’s Gross Rental Income
Top 10 tenants forms about 29.1% of Portfolio’s Gross Rental Income
4.0%
3.6%
2.9% 2.8%
2.4%
1.6% 1.6%
1.1% 1.1%
Global Social Global Fortune 25 IT Solutions
Media Colocation Investment Provider2
Company2 Provider2 Grade-Rated
Company2
1 Based on MIT’s 40% interest of the joint venture with MIPL in a portfolio of 14 data centres in United States through MRDCT and 50% interest
of the joint venture with MIPL in three fully fitted hyperscale data centres and 10 powered shell data centres in North America through MRODCT.
2 The identities of the tenants cannot be disclosed due to the strict confidentiality obligations under the lease agreements.
16Tenant Diversification Across Trade Sectors1
No single trade sector accounted >18% of Portfolio’s Gross Rental Income
By Gross Rental Income
As at 31 Mar 2020
1 Based on MIT’s 40% interest of the joint venture with MIPL in a portfolio of 14 data centres in United States through MRDCT and 50% interest
of the joint venture with MIPL in three fully fitted hyperscale data centres and 10 powered shell data centres in North America through MRODCT.
17Singapore Portfolio Performance
Gross Rental Rate
Occupancy S$ psf/mth
100% $2.50
95.2%95.4%95.5%
94.3%94.5%95.1%95.0%94.9%95.0% 93.9% 93.5%93.8%
94.7%94.6%
93.2% 92.5% 93.0%92.5% 93.1%92.6%
92.3% 92.1%
91.3%90.7%91.5%90.8% 90.7%
90.2% 90.4%90.1%89.6% 89.8%90.5%90.2%90.5%
90% 87.8% 87.7%
86.2%
$2.12 $2.11
$2.10 $2.10
80% $2.01
$1.97
$1.95 $1.94
$1.90
$2.05 $2.04
$2.07 $2.00
$1.88 $1.89 $2.02
$1.86
70% $1.94
$1.92 $1.92 $1.93
$1.75
$1.71 $1.70 $1.73
$1.84
$1.82 $1.83
60% $1.77
$1.54 $1.53 $1.55 $1.68
$1.52
$1.59 $1.61
50% $1.56 $1.50
$1.49
$1.45
40%
30%
$1.00
20%
10%
0% $0.50
3Q 4Q 1Q 2Q 3Q 4Q 1Q 2Q 3Q 4Q 1Q 2Q 3Q 4Q 1Q 2Q 3Q 4Q 1Q 2Q 3Q 4Q 1Q 2Q 3Q 4Q 1Q 2Q 3Q 4Q 1Q 2Q 3Q 4Q 1Q 2Q 3Q Q4
FY10/11 FY11/12 FY12/13 FY13/14 FY14/15 FY15/16 FY16/17 FY17/18 FY18/19 FY19/20
18 Occupancy (LHS) Rental Rate (RHS)Segmental Occupancy Levels (Singapore)
98.4% 98.8%
94.0%
90.4% 90.5% 90.7%
87.5% 86.2%
85.1% 86.1%
81.0% 80.0%
Flatted Factories Hi-Tech Buildings Business Park Stack-up/Ramp-up Light Industrial Singapore
Buildings Buildings Buildings Portfolio
Left Bar Right Bar
(3QFY19/20) (4QFY19/20)
19Rental Revisions (Singapore)
Gross Rental Rate (S$ psf/mth)1
For Period 4QFY19/20
Before Renewal
$4.44 $4.55 $4.46 After Renewal
New Leases
$3.66 $3.66 $3.68 Passing Rent
$1.88 $1.87 $1.73 2
$1.40 $1.32 $1.26
Flatted Factories Hi-Tech Buildings Business Park Buildings Stack-Up/Ramp-Up
Buildings
Renewal 72 Leases 31 Leases 9 Leases 8 Leases
Leases (223,379 sq ft) (66,511 sq ft) (74,072 sq ft) (103,442 sq ft)
47 Leases 5 Leases 5 Leases 10 Leases
New Leases
(111,386 sq ft) (9,256 sq ft) (22,360 sq ft) (136,089 sq ft)
1 Gross Rental Rate figures exclude short term leases; except Passing Rent figures which include all leases.
2 As a result of the redevelopment of the Kolam Ayer 2 Cluster, preferential rents were offered to existing tenants who relocated to alternative MIT
20 premises. Excluding these new leases, the average rental rate for new leases would have been S$1.87 psf/mth.Healthy Tenant Retention (Singapore)
LONG STAYING TENANTS RETENTION RATE FOR 4QFY19/20
Up to 1 yr
9.4%
>10 yrs
95.1%
28.6% 89.6%
>1 to 2 yrs
11.6% 75.6% 77.5%
72.7%
4 yrs or
less
More than 36.1%
> 2 to 3 yrs
4 yrs 8.0%
63.9%
>3 to 4 yrs
7.1% 0.0%
>4 to 5 yrs Flatted Hi-Tech Business Stack-up / Light Singapore
Factories Buildings Park Ramp-up Industrial Portfolio
4.6%
>5 to 10 yrs Buildings Buildings Buildings
30.7%
As at 31 Mar 2020 Based on NLA.
By number of tenants.
63.9% of the tenants have leased the properties for more than 4 years
Tenant retention rate of 77.5% in 4QFY19/20
21Completed Acquisition of 13 Data Centres in North America
Turnkey Data Centres Powered Shell Data Centres
44490 Chilum Place 11900 East Cornell Avenue
50% 50%
Transaction
50:50 joint venture (“MIT-MIPL JV”) with Mapletree Investments
(“MIPL”) to acquire 13 data centres in the US and Canada:
3 fully fitted hyperscale data centres (“Turnkey Portfolio”)
MIT-MIPL JV 10 powered shell data centres (“Powered Shell Portfolio”)
80:20 joint venture between MIT-MIPL JV and Digital Realty to
100% 80% 20% co-invest in the Turnkey Portfolio
US$557.3m3 US$810.6m3
Purchase MIT-MIPL JV share: US$1,367.9 million (S$1,860.3 million1)
Consideration MIT share: US$683.9 million (S$930.1 million)
MIT Total
US$694.5 million (S$944.5 million)
Acquisition Cost2
Vendor Digital Realty
Powered Shell Turnkey Turnkey Portfolio (1 Nov 2019)
Completed
Portfolio Portfolio Powered Shell Portfolio (14 Jan 2020)
1 Unless otherwise stated, an illustrative exchange rate of US$1.00 to S$1.360 is used in this presentation.
2 Comprises MIT's proportionate share of the Purchase Consideration, estimated transfer taxes, professional and other fees and expenses in connection with the Proposed
Acquisition respectively, as well as the acquisition fee payable to the Manager for the JV (1% of MIT's proportionate share of the Purchase Consideration) and other expenses
in connection with MIT's investment in the JV.
3 Refers to the purchase consideration of MIT-MIPL JV.
22Redevelopment – Kolam Ayer 2
Property GFA Plot Ratio
Kolam Ayer 2 Cluster Two Flatted Factories and an amenity centre 506,720 sq ft 1.5
New Hi-Tech Buildings, including a
After Redevelopment 865,600 sq ft 2.5
seven-storey BTS Facility for Anchor Tenant
Artist’s impression of MIT’s new high-tech industrial
Kolam Ayer 2 Cluster
precinct with BTS Facility on the left
Redevelopment of Kolam Ayer 2 Flatted Factory Cluster into a new high-tech industrial precinct at
total project cost of S$263 million1
Secured pre-commitment from a global medical device company headquartered in Germany
(the “Anchor Tenant”) for about 24.4% of enlarged GFA (~211,000 sq ft)
BTS Facility is 100% committed by Anchor Tenant for lease term of 15 + 5 + 5 years2 with annual
rental escalations
67 out of 108 existing tenants committed to new leases at alternative MIT clusters
Commencement in 2H2020 and completion in 2H2022
1 Includes the book value of the Kolam Ayer 2 Cluster at S$70.2 million as at 31 Mar 2019 prior to the commencement of the redevelopment.
2 Includes a rent-free period of 6 months distributed over the first six years. Anchor Tenant is responsible for all operating expense and property tax of the
23 BTS Facility.4Q & FY19/20
FINANCIAL PERFORMANCE
Hi-Tech Buildings, 18 Tai Seng4Q & FY19/20 Results Highlights
Stable FY19/20 DPU driven by new revenue contributions from acquisitions and development
projects
• FY19/20 Distributable Income: S$265.3 million ( 14.5% y-o-y)
• FY19/20 DPU: 12.24 cents ( 0.7% y-o-y)
• 4QFY19/20 Distributable Income and DPU were S$69.2 million ( 15.4% y-o-y)
and 2.85 cents ( 7.5% y-o-y)
In view of the uncertainty from the COVID-19 pandemic, tax-exempt income (distributions relating
to joint ventures) of S$6.6 million has been withheld in 4QFY19/20 for greater flexibility in cash
management
• Had the tax-exempt income distribution been included: FY19/20 DPU 12.54 cents ( 3.1% y-o-y)
and 4QFY19/20 DPU 3.15 cents ( 2.3% y-o-y)
Committed to support tenants with a COVID-19 Assistance and Relief Programme of up to
S$13.7 million
Portfolio update
• Overall Portfolio occupancy improved q-o-q from 90.9% to 91.5% in 4QFY19/20
• Overall Portfolio WALE increased q-o-q from 3.9 years to 4.2 years as at 31 Mar 2020
• Portfolio valuation of 114 properties increased 23.6% y-o-y to S$5,894.6 million as at 31 Mar 2020
Capital management update
• Loans due in FY20/21 were refinanced in 4QFY19/20
• Strong balance sheet with a healthy interest coverage ratio of 7.7 times in 4QFY19/20
25Statement of Profit or Loss (Year-on-Year)
4QFY19/20 4QFY18/19
/ ()
(S$’000) (S$’000)
Gross revenue 101,801 98,822 3.0%
Property operating expenses (23,545) (22,972) 2.5%
Net property income 78,256 75,850 3.2%
Borrowing costs (11,029) (10,379) 6.3%
Trust expenses (8,185) (8,623) (5.1%)
Net fair value gain on investment properties and investment
50,798 30,757 65.2%
property under development
Share of joint ventures’ results1 60,897 13,186 >100.0%
Comprising:
- Net profit after tax 13,619 3,739 >100.0%
- Net fair value gain on investment properties 47,278 9,447 >100.0%
Profit before income tax 170,737 100,791 69.4%
Income tax expense (7) * **
Profit for the period 170,730 100,791 69.4%
Net non-tax deductible items (111,419) (44,659) >100.0%
Distributions declared by joint ventures 9,842 3,804 >100.0%
Amount available for distribution 69,1532 59,936 15.4%
Distribution per Unit (cents) 2.852 3.08 (7.5%)
* Amount less than S$1,000
** Not meaningful
1 Share of joint ventures’ results relates to MIT’s equity interest in the joint ventures with MIPL. The results of the joint ventures were equity accounted for at the Group level.
2 Amount available for distribution includes tax-exempt income (distributions relating to joint ventures) amounting to S$6.6 million, equivalent to distribution per Unit of 0.30 cent,
26 has been withheld in 4QFY19/20. Had the tax-exempt income distribution been included, the distribution per Unit for 4QFY19/20 would be 3.15 cents.Statement of Profit or Loss (Year-on-Year)
FY19/20 FY18/19
/ ()
(S$’000) (S$’000)
Gross revenue 405,858 376,101 7.9%
Property operating expenses (87,789) (88,331) (0.6%)
Net property income 318,069 287,770 10.5%
Borrowing costs (45,019) (40,108) 12.2%
Trust expenses (33,155) (33,431) (0.8%)
Net fair value gain on investment properties and investment
50,798 30,757 65.2%
property under development
Share of joint ventures’ results1 76,506 26,138 >100.0%
Comprising:
- Net profit after tax 29,228 16,691 75.1%
- Net fair value gain on investment properties 47,278 9,447 >100.0%
Profit before income tax 367,199 271,126 35.4%
Income tax expense (56) * **
Profit for the year 367,143 271,126 35.4%
Net non-tax deductible items (125,950) (54,559) >100.0%
Distributions declared by joint ventures 24,144 15,192 58.9%
Amount available for distribution 265,3372 231,759 14.5%
Distribution per Unit (cents) 12.242 12.16 0.7%
* Amount less than S$1,000
** Not meaningful
1 Share of joint ventures’ results relates to MIT’s equity interest in the joint ventures with MIPL. The results of the joint ventures were equity accounted for at the Group level.
2 Amount available for distribution includes tax-exempt income (distributions relating to joint ventures) amounting to S$6.6 million, equivalent to distribution per Unit of 0.30 cent,
27 has been withheld in 4QFY19/20. Had the tax-exempt income distribution been included, the distribution per Unit for FY19/20 would be 12.54 cents.Statement of Profit or Loss (Qtr-on-Qtr)
4QFY19/20 3QFY19/20
/ ()
(S$’000) (S$’000)
Gross revenue 101,801 102,610 (0.8%)
Property operating expenses (23,545) (20,705) 13.7%
Net property income 78,256 81,905 (4.5%)
Borrowing costs (11,029) (12,072) (8.6%)
Trust expenses (8,185) (7,082) 15.6%
Net fair value gain on investment properties and investment
50,798 - **
property under development
Share of joint ventures’ results1 60,897 6,848 >100.0%
Comprising:
- Net profit after tax 13,619 6,848 98.9%
- Net fair value gain on investment properties 47,278 - **
Profit before income tax 170,737 69,599 >100.0%
Income tax expense (7) (49) (85.7%)
Profit for the period 170,730 69,550 >100.0%
Net non-tax deductible items (111,419) (6,812) >100.0%
Distributions declared by joint ventures 9,842 6,698 46.9%
Amount available for distribution 69,1532 69,436 (0.4%)
Distribution per Unit (cents) 2.852 3.16 (9.8%)
* Amount less than S$1,000
** Not meaningful
1 Share of joint ventures’ results relates to MIT’s equity interest in the joint ventures with MIPL. The results of the joint ventures were equity accounted for at the Group level.
2 Amount available for distribution includes tax-exempt income (distributions relating to joint ventures) amounting to S$6.6 million, equivalent to distribution per Unit of 0.30 cent,
28 has been withheld in 4QFY19/20. Had the tax-exempt income distribution been included, the distribution per Unit for 4QFY19/20 would be 3.15 cents.Balance Sheet
31 Mar 2020 31 Dec 2019 / () 31 Mar 2019 / ()
Total assets (S$’000) 5,187,883 5,298,020 (2.1%) 4,607,064 12.6%
Total liabilities (S$’000) 1,627,762 1,820,614 (10.6%) 1,559,538 4.4%
Net assets attributable to
3,560,121 3,477,406 2.4% 3,047,526 16.8%
Unitholders (S$’000)
Net asset value per Unit (S$)1 1.62 1.58 2.5% 1.51 7.3%
1 Net tangible asset per Unit was the same as net asset value per Unit as there were no intangible assets as at reporting dates.
29Higher Portfolio Value
Valuation as at 31 Mar 2020 Valuation as at
Property segment 31 Mar 2019 Capitalisation rate
Local currency (million) S$ million 1 (S$ million)2
Hi-Tech Buildings3 S$1,790.3 1,790.3 1,628.8 5.25% to 6.50%
Flatted Factories3 S$1,506.6 1,506.6 1,578.0 6.00% to 7.25%
Business Park Buildings S$588.3 588.3 581.0 5.75%
Stack-up/Ramp-up Buildings S$488.7 488.7 473.0 6.50%
Light Industrial Buildings S$74.0 74.0 75.5 6.00% to 6.25%
Singapore Portfolio S$4,447.9 4,447.9 4,336.3
North American Portfolio (100%) US$2,462.3 3,413.2 1,086.7 5.75% to 7.50%
MIT’s Interest in
US$1,043.6 1,446.7 434.7
North American Portfolio
Total Portfolio4 5,894.6 4,771.0
The increase in portfolio value for Singapore Portfolio comprised a portfolio revaluation gain of S$79.7 million as well as capitalised
cost of S$31.9 million from development and improvement works
Increase in North American Portfolio was due primarily to the 13 data centres acquired via Mapletree Rosewood Data Centre Trust
Net asset value per Unit increased from S$1.51 as at 31 Mar 2019 to S$1.62 as at 31 Mar 2020
1 Based on applicable Mar 2020 month end exchange rate of US$1 to S$1.38619.
2 Based on applicable Mar 2019 month end exchange rate of US$1 to S$1.35612.
3 The proposed redevelopment of the Kolam Ayer 2 Cluster into a high-tech industrial precinct is expected to commence in the second half of 2020. Provisional
Permission for the proposed redevelopment was granted by the Urban Redevelopment Authority on 6 Dec 2019. On 31 Mar 2020, the Kolam Ayer 2 Cluster
was reclassified from a Flatted Factory to a Hi-Tech Building Cluster.
4 To demonstrate greater alignment with Unitholders amid the COVID-19 pandemic, the Manager will charge the base fee for FY20/21 on the lower deposited
30 property value recorded for the portfolio prior to the current 31 Mar 2020 valuation.Strong Balance Sheet
Strong balance sheet to
31 Mar 2020 31 Dec 2019 pursue growth opportunities
Total debt
(MIT Group)
S$1,434.1 million S$1,644.8 million ‘BBB+’ rating with Stable
Outlook by Fitch Ratings
Weighted average
4.7 years 4.1 years
tenor of debt
Aggregate
100% of loans unsecured
37.6% 34.1% with minimal covenants
leverage ratio1
1 In accordance with Property Funds Guidelines, the aggregate leverage ratio includes proportionate share of borrowings and deferred payments
as well as deposited property values of joint ventures. As at 31 Mar 2020, total borrowings and deferred payments including MIT’s
proportionate share of joint ventures’ borrowings and deferred payments is S$2,259.0 million.
31Well Diversified Debt Maturity Profile
DEBT MATURITY PROFILE
As at 31 March 2020
Weighted Average Tenor of Debt = 4.7 years
Loans due in FY20/21 were refinanced in 4QFY19/20
~S$380 million of committed facilities available in FY20/21
28.9%
27.6%
15.6% 355.2
12.2% 395.4
178.5 8.7%
7.0%
175.0
125.0
100.0
45.0 60.0
FY20/21 FY21/22 FY22/23 FY23/24 FY24/25 FY25/26 FY26/27 FY27/28 FY28/29
MTN Bank Loans
Amounts in S$ million
32Risk Management
31 Mar 2020 31 Dec 2019 ~81% capital hedge:
US$ investments in
Fixed as a % of joint venture entities
73.4% 63.8%
total debt
matched with US$
Weighted average
3.8 years 4.1 years borrowings
hedge tenor
4QFY19/20 3QFY19/20 About 69% of
1QFY20/21 net US$
Weighted average income stream are
2.9% 3.0%
all-in funding cost
hedged into S$
Interest coverage
7.7 times 6.8 times
ratio
33OUTLOOK AND
STRATEGY
Hi-Tech Buildings, 7337 Trade Street, San DiegoSingapore Industrial Property Market
DEMAND AND SUPPLY FOR MULTI-USER FACTORIES DEMAND AND SUPPLY FOR BUSINESS PARKS
Total stock for factory space: 38.8 million sq m
Potential net new supply of 1.9 million sq m in 20201, of which
• Multi-user factory space accounts for 0.9 million sq m. About 50% of the space is intended for
replacement space for lessees affected by JTC’s Industrial Redevelopment Programme
• Business park space accounts for 0.2 million sq m
• Moderation in quantum of industrial land released through Industrial Government Land Sales
Programme since 2013
Median rents for industrial real estate for 1Q20201
• Multi-user Factory Space: S$1.77 psf/mth (0.0% q-o-q)
• Business Park Space: S$4.20 psf/mth (-1.2% q-o-q)
1 JTC J-Space, 26 Apr 2020
35Outlook
Singapore
Challenging operating environment due to COVID-19 pandemic
• GDP growth forecast for 2020 downgraded from -0.5% to 1.5% on 19 Feb 2020 to -4.0% to -1.0%1
on 26 Mar 2020
• Business confidence plunged to an all-time low for 2Q2020, after displaying positive sentiment in
1Q20202
• Most, if not all, businesses are impacted by the drastic and sudden fall in business volume, with the
attendant cash flow constraint. Different businesses suffer these in different degrees, perhaps more
so for the small and medium-sized enterprises (“SME”). About 55% of MIT’s Singapore Portfolio (or
45% of the Overall Portfolio) are SME tenants
Supporting tenants
• MIT’s properties in Singapore remain open during the circuit breaker period from 7 Apr 2020 to 1 Jun
2020 to support tenants who provide essential services. About half of the tenants (by gross rental
revenue) in the Singapore Portfolio provide essential services or are in key economic sectors
• Rolled out the COVID-19 Assistance and Relief Programme of up to S$13.7 million
COVID-19 (Temporary Measures) Act
• Provides temporary relief from legal action for a prescribed period of six months (e.g. court or
insolvency proceedings or termination of leases of non-residential properties) for businesses or
individuals who are unable to fulfill their contractual obligations due to the COVID-19 pandemic
• While arrears ratio remained stable at 0.2% of the previous 12 months’ gross revenue as at 31 Mar
2020, it is expected to increase if more of these SME tenants seek the temporary relief under the Act
1 Source: Ministry of Trade and Industry, 26 Mar 2020.
2 Source: Singapore Commercial Credit Bureau, 2Q2020.
36Outlook
North America
Healthy demand in the United States
• According to JLL3, data centre markets in the United States of America (the “United States”) finished
2019 with 349.6 megawatts (“MW”) in net absorption amidst increased cloud activities across data
centre markets in the United States. Net absorption in 2019 was lower than 2018 by 120.5 MW,
which was partly due to Northern Virginia’s record year in 2018 of 270 MW in net absorption versus
124.0 MW in 2019
• Robust pipelines and large megawatt deals executed at lower rates compressed rental rates in
markets across the United States in 2019. JLL expects this downward trend to continue in 2020
Given the lack of comprehensive data on the effect of COVID-19 pandemic on fundamentals, JLL has
identified data centres as one of the more defensive asset classes due to its operation criticality4
All MIT’s 27 data centres in North America continue operations during this period
3 Source: JLL Research, Data Center Outlook Year-end 2019.
4 Source: JLL Global Research, COVID-19 Global Real Estate Implications, 12 Mar 2020.
37Diversified and Resilient
Overall Portfolio’s WALE Loans due in FY20/21 Completed second
increased q-o-q from were refinanced in overseas acquisition of
3.9 years to 4.2 years 4QFY19/20 3 turnkey data centres
as at 31 Mar 2020 and 10 powered shell
Healthy interest data centres in North
Large diversified tenant coverage ratio of 7.7 America on 1 Nov 2019
base of more than 2,200 times in 4QFY19/20 and 14 Jan 2020
tenants with low respectively
dependence on any Tax-exempt income of
single tenant or trade S$6.6 million was Embarked on its largest
sector withheld in 4QFY19/20 redevelopment project
for greater flexibility in at Kolam Ayer with
cash management 24.4% of space
pre-committed
38End of Presentation
For enquiries, please contact Ms Melissa Tan, Director, Investor Relations,
DID: (65) 6377 6113, Email: melissa.tanhl@mapletree.com.sgYou can also read