Vulnerable: the quantum of local government infrastructure exposed to sea level rise - Tom Simonson and Grace Hall, LGNZ Survey and support by ...
←
→
Page content transcription
If your browser does not render page correctly, please read the page content below
Vulnerable: the quantum
of local government
infrastructure exposed
to sea level rise
Tom Simonson and Grace Hall, LGNZ

Survey and support by Tonkin & Taylor Ltd
Contents
1> Foreword    p3

2> Introduction      p5

3> Survey observations           p9

4 Summary analysis         p11

5> Three Waters      p15

6> Roading   p21

7> Buildings and facilities           p27

8> Other infrastructure          p33

9> Conclusion      p42

10> Appendix A – Data source type           p45

    Appendix B – Table data Disclosure            p46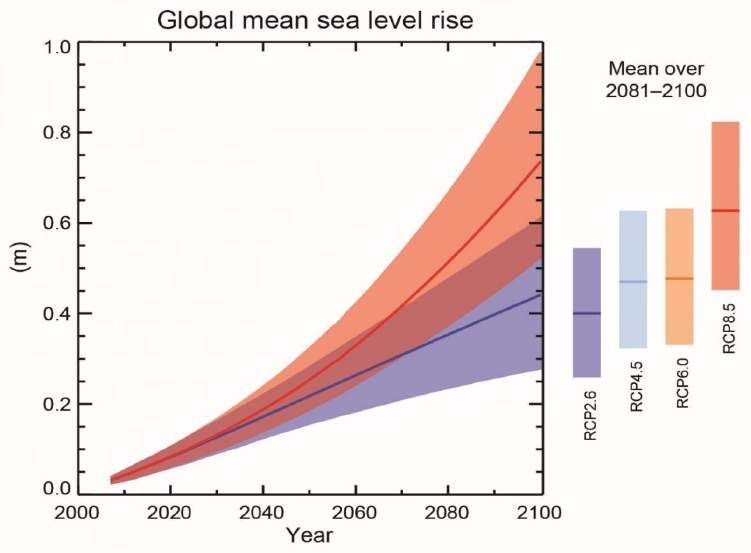
1
Foreword

      Vulnerable: the quantum of local government infrastructure exposed to sea level rise   3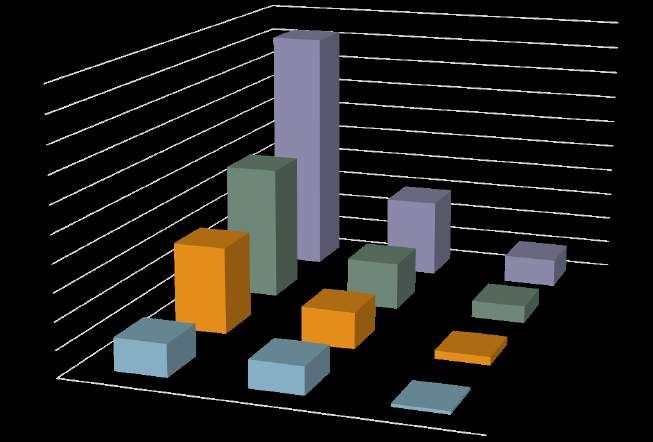
Foreword
                                This report and its recommendations are of deep
                                personal interest to me. As Mayor of Dunedin, I have
                                seen first-hand the risks that rising sea levels pose to
                                our low lying urban neighbourhoods. I also know how
                                difficult it can be to develop long-term plans to adapt
                                to this challenge in a fair and equitable way.
This report and its recommendations are of deep personal interest to       proposes recommendations to address those impending impacts
me. As Mayor of Dunedin, I have seen first-hand the risks that rising      and associated costs. In doing so, it intends to help our community
sea levels pose to our low lying urban neighbourhoods. I also know         leaders prime and test council staff, constituents and stakeholders
how difficult it can be to develop long-term plans to adapt to this        to engage in the most effective long-term planning, disaster risk
challenge in a fair and equitable way. Yet it is a challenge we must       reduction, and rebuilding of core infrastructure to effectively manage
take up if we are to limit the impact that climate change has on our       exposed investments. While climate change is a global phenomenon,
country – particularly sea level rise. As this study highlights, roughly   it is at the local level where its impacts are most acutely felt.
65 per cent of New Zealanders live within five kilometres of the ocean,
and an increasing number of councils will face significant policy and      Importantly, this report intends to assist in shaping our vision
financial challenges as the sea continues to encroach on them.             of how to address the challenge of sea level rise for the next 50
                                                                           to 150 years, using actual quantity and replacement value data.
The focus in this report is on council owned infrastructure,               Additionally, it is important to note that this is the first time a national
particularly roading, three waters networks and buildings/facilities.      survey measuring the value of owned infrastructure exposed to the
These are vital building assets which underpin the viability of our        effects of sea level rise has been completed by a local government
communities, and as they come under strain, so too will the fabric         organisation. It shows just how serious New Zealand’s local
that binds our communities together. Addressing sea level rise will        government is about addressing the effects of climate change.
require a data-driven understanding of the problem so that our
communities and stakeholders can put in place plans and other              LGNZ looks forward to your input and continued dialogue on this
measures to bolster resilience for this uncertain future. This report is   important issue.
a first step in that direction.

We acknowledge that the costs of responding to and preparing for
sea level rise (and other, compounding changes to the climate) will
be significant, but recognise that the costs of doing nothing are even
greater. Our communities must begin to build resilient infrastructure
and, most importantly, prepare for change. The analysis provides an
indication of the very minimum level of investment that is likely to be    Dave Cull
required.                                                                  President
                                                                           LGNZ
More specifically, this analysis fills a gap in understanding of the
type, amount and replacement value of core local government
owned infrastructure that is exposed to sea level rise. Further, it

4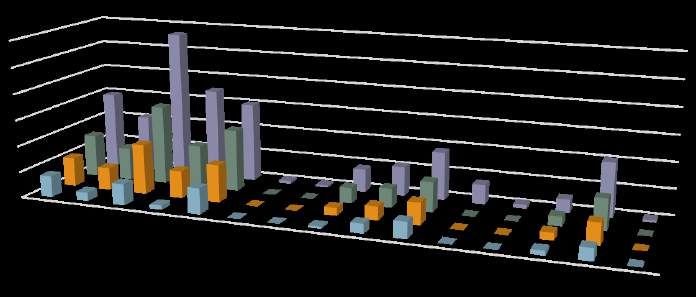
2
Introduction

       Vulnerable: the quantum of local government infrastructure exposed to sea level rise   5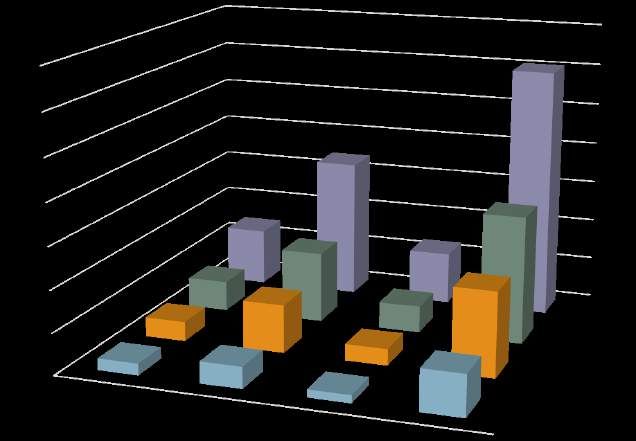
Introduction
Background – LGNZ’s Climate Change                                           The second and more important output of this research is to provide
                                                                             responses to rising sea levels. This study intentionally avoids specific
project                                                                      and local costs, and targets discussion at a regional and national level
Councils are already experiencing the impacts of climate change,             in order to highlight trends and general areas of high and low priority.
which have bearing on the prosperity, vibrancy and long-term viability       It raises questions about how to improve procurement, appropriately
of our communities. Climate change will affect all of us during our          share management of risk, and communicate with stakeholders
lifetimes, and councils are increasingly recognising that resilience to      about priorities.
climate change depends in large part on what is being done to adapt
to it.
                                                                             < Impacts resulting from sea
This report forms part of LGNZ’s wider flagship Climate Change
project. The project is focused on supporting councils with their
                                                                             level rise will be far reaching, and
adaptation and mitigation responsibilities, and involves ongoing             will demand that central and
advocacy to the Government on the tools and resources that councils
and their communities need to address climate change.                        local government, communities,
In 2017, LGNZ published a position statement on climate change. The
                                                                             iwi, businesses and property
document explicitly states:                                                  owners coordinate investments
“Responsive leadership and a holistic approach to climate change is          to adapt and build community
urgent. We must act now to avoid future risk and, at the same time,
agree how to manage safety, existing risks, limitations and liabilities to   resilience. >
underpin effective mitigation and adaptation.”
                                                                             Impacts resulting from sea level rise will be far reaching, and will
However, until now, we have not had a good understanding of the              demand that central and local government, communities, iwi,
type, amount and replacement value of local government owned                 businesses and property owners coordinate investments to adapt
infrastructure that is exposed to sea level rise. Although other             and build community resilience. For too long in the local government
agencies and organisations have performed similar research and               setting, dialogue has focused on response to an opaque impact;
data analysis, their outputs have not been readily transferable to local     unquantified replacement values and costs have led to indecision
government asset owners or stakeholders. This report is designed             in planning and investment, and vague objectives. Until this time,
to address that gap in knowledge, and build understanding of the             there has been no cohesive body of data to ground a discussion and
replacement value of exposed local government infrastructure.                develop reasonable outcomes with a national and regional focus.

As LGNZ’s advocacy and policy positioning is data driven, we intend          Action on climate change demands, and will continue to require,
to use the information from this research programme across multiple          proactive collaboration between stakeholders. Without continued
projects and to inform future policy positions. We encourage local           research and dialogue to establish positions for directing local
government, central government and other key stakeholders to do              government resources, our communities will be ill prepared for the
the same.                                                                    inevitable impacts.

Purpose of this study                                                        Planned outcomes
This project has two intended outputs. The first is to research the          The primary outcome of the research is to increase the priority of
current quantity and value of infrastructure exposed to sea level            importance of this issue amongst all stakeholders. The replacement
rise at four increments; 0.5, 1.0, 1.5 and 3.0 metres, and to quantify       value of exposed infrastructure is a best estimate based on
replacement value. The scope of this research project primarily              information received from surveyed councils. Our view is that this
includes roads, three waters infrastructure and buildings. Data was          will be a small fraction of what New Zealand stakeholders will have
also collected on other types of infrastructure, including greenspace,       to manage in the next 150 years, given that there will be impacts not
jetties and airports.                                                        only to local public infrastructure, but also on central government

6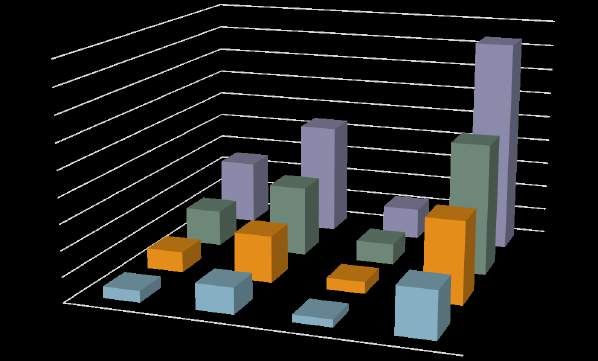
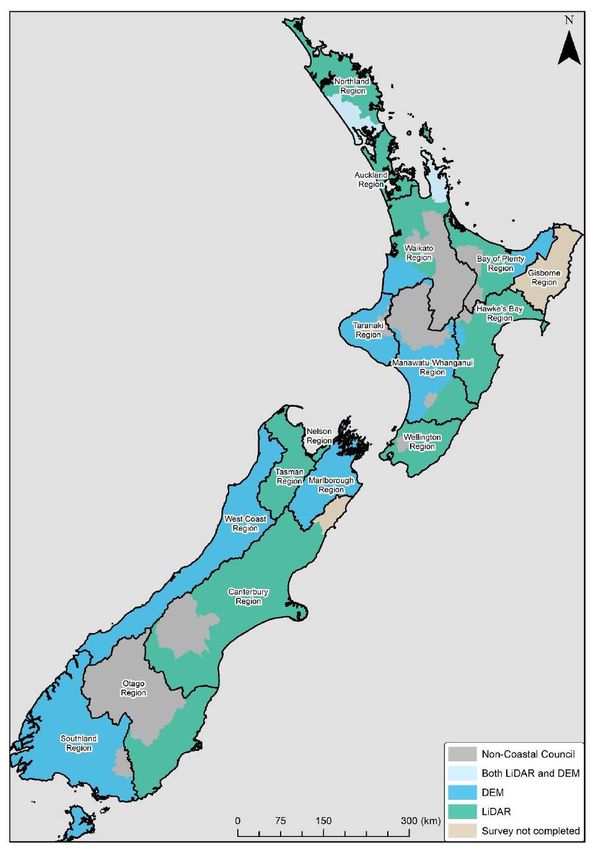
and private property and infrastructure. The research clearly                LGNZ coordinated with NIWA to source regional GIS polygons relating
demonstrates that this is an intergenerational issue requiring action        to a range of sea level rise elevations in coastal areas. The supplied
by decision-makers now if the impacts are to be efficiently and              polygon information was intended to be overlaid with council GIS
equitably managed, and communities are to adapt.                             information to quantify exposed infrastructure, and to understand
                                                                             its depreciated and replacement value. Councils were provided with
Further, the research intends to provide a context to begin                  Excel survey templates to complete.
discussions between stakeholders. The impacts of sea level rise on
local government owned infrastructure, and costs associated with             The NIWA GIS information shared with councils included data at
these impacts will directly and indirectly impact levels of service and      various levels based on Light Detection and Ranging (LiDAR) data for
costs for all stakeholders. Consequently, an issue to consider is who        some New Zealand regions, and a single New Zealand-wide GIS data
bears the costs of both replacing the infrastructure that is impacted,       set (based on a 3.0 metre national digital elevation model (DEM))
and of building the resilience of that infrastructure before seas rise       to be used for the remaining areas without LiDAR. In some cases,
further. Real success will be attained when stakeholders align efforts       councils had to use a mixture of LiDAR and the national DEM data. For
to ensure a future with prioritised affordable and effective responses       clarity on what council data was available and where, please refer to
to the demands of a changing climate.                                        Appendix A.

< Real success will be attained                                              Included in the correspondence to councils were two templates;
                                                                             for the LiDAR area and for the DEM area. For the LiDAR areas, four
when stakeholders align efforts                                              elevation scenarios were requested; 0.5m, 1.0m, 1.5m and 3.0m. For
                                                                             the DEM areas, only the single three metre scenario was required. The
to ensure a future with prioritised                                          elevation scenarios were chosen for clarity of impact at increments

affordable and effective                                                     measurable in both the short and long-term, with the understanding
                                                                             that scenarios identified in the short-term (0-100 years) would be
responses to the demands of a                                                of greater interest than those posed in the long term (100+ years).
                                                                             Further, those short term increments were set based on general,
changing climate. >                                                          sustained exposure with the understanding that variability of
                                                                             conditions, e.g. king tide with a storm event, could make the smaller
The regional approach to this data analysis is designed to encourage         available measurement increments irrelevant.
local government to explore solutions at a regional, and in some
cases national, level. Although solutions will be executed through           Finally, in addition to the scenarios requested, total council quantities
local engagement, local government must approach this challenge              and replacement values for the relevant assets were requested to
with a focus that is both broad and deep. Solutions must not be              enable an analysis of percentages impacted. All data received via
constrained by man-made lines on a map, but rather need to be                survey responses was compiled into a database, which was finalised
underpinned by a vision for national benefit.                                on 20 October 2018.

In addition to raising the priority of this issue and the outcomes           The survey response rate was 97 per cent. Two councils chose not
that need to be achieved, the report is intended is to reiterate the         to participate in the survey. Of those surveys returned, six councils
increasing pace at which change is occurring. Effective advanced             reported no assets exposed, and therefore no information was input
planning requires good communication, strong issue literacy, and             into the database for these councils. For a full list of disclosures, see
full consideration of the variables that affect outcomes. Given that         Appendix B.
sea level rise and its impacts will manifest relatively slowly, New
Zealand does have a small window of time to begin conversations              For clarity, the definition of exposed infrastructure is that physical
with communities about how to respond, and ensure a time-sensitive           assets that are located within the inundation area used for the
approach for sustainable and equitable management of expensive               analysis, and therefore potentially susceptible to the impacts of
resources. However, this time is limited and it must be used wisely.         sea level rise. We note that asset exposure does not necessarily
                                                                             mean there will be “damage” or impact, or that replacement will be
                                                                             required.
Research programme methodology
                                                                             This report has a primary focus on sea level rise, noting that it is
The survey, jointly developed by LGNZ and Tonkin & Taylor, was
                                                                             one of several “general” underpinning factors that impact or cause
issued to 62 councils on 2 February 2018. In producing the survey,
                                                                             coastal flooding. Other variables include storm events, high tides

                                                                          Vulnerable: the quantum of local government infrastructure exposed to sea level rise   7
and land subsidence. Reporting in this way attempts to avoid
conflating “weather” events with the constant variable of sea level
rise. Importantly, the frequency of impacts related to rising sea levels
will increase in coming decades. Sea level rise is a foundational issue
requiring a long-term, sustainable and permanent response.

< Sea level rise is a foundational
issue requiring a long-term,
sustainable and permanent
response. >
Further, this analysis identifies and measures only replacement value.
The analysis does not take into account costs for other activities, such
as temporary or permanent adaptation measures, planning activities
and purchasing additional resources to ensure an acceptable level
of service, e.g. right-of-way for a road realignment. For a list of full
disclosures, see Appendix B.

At Risk Infrastructure Working Group
To support this study, LGNZ formed an At Risk Infrastructure
Working Group. The group included representatives from 12 councils
and supporting participation from other organisations, including
NIWA. The group has advised on the approach of the research,
the formulation of the methodology for gathering information
from councils, and implications of the data gathered for the local
government sector. It has also provided input into this final report.
In doing all of this, the Working Group drew on multiple sources
of existing research and analysis, including the 2015 NIWA report
“National and regional risk exposure in low-lying coastal areas”.

8
3
Survey
observations

       Vulnerable: the quantum of local government infrastructure exposed to sea level rise   9
Survey observations
Council Challenges                                                       Central government needs to work with local government to
                                                                         overcome the challenges that councils have identified as precluding
LGNZ has identified key local government challenges as a result
                                                                         them from doing more to address climate change, including
of this study and from consultation with the At Risk Infrastructure
                                                                         challenges relating to funding, and capacity and capability to
Working Group. The considerable amount of local government owned
                                                                         undertake risk assessments.
infrastructure that this survey reveals is exposed demonstrates that
there is an urgent need to prepare for and address the challenges
that this exposure will ultimately create. So that councils and their    Integrated adaptation and mitigation
communities are equipped to address this challenge, there are a
number of fundamental areas for improvement, including:                  planning
                                                                         Councils should consider how their planning and decisions could
                                                                         address both adaptation and mitigation when making decisions
Intra-council coordination                                               about infrastructure. An integrated approach to both adapting to and
Councils need to improve internal coordination. From the survey,         mitigating the impacts of climate change provides an opportunity for
it was clear that for many councils department staff held fluency        local government to create synergies, deliver a range of co-benefits
in their area of expertise, but there was a need for coordination        and potentially increase cost effectiveness.
of council finance, geospatial information systems and asset
                                                                         The most recent Intergovernmental Panel on Climate Change
management. Completion of the survey identified gaps and
                                                                         (IPCC) reported that a systemic, transformative change is needed
inefficiencies in work across departments. Councils need to build
                                                                         to limit global warming to 1.5°C, and that efforts need to be linked
their capacity and better coordinate to manage projects and data,
                                                                         to complementary adaptation action. It identifies that a mix of
and need clearer reporting for planning and improved internal
                                                                         mitigation and adaptation options implemented in a participatory
coordination.
                                                                         and integrated manner can enable rapid and systemic transitions in
                                                                         urban and rural areas.
Inter-council coordination
Greater coordination across regionally aligned councils is needed
to execute long-term planning, resource planning, procurement
of capital infrastructure, operations, maintenance activities and
community engagement to prepare for and adapt to the impacts of
sea level rise. Clearer and more coordinated planning will help ensure
reduction of competition for resources and engagement with the
public.

A number of councils have begun taking a regionally coordinated
and collaborative approach to the way in which they address climate
change. More must be done to maximise opportunities for such
collaboration.

External coordination
Greater collaboration by central and local government is needed
to plan for sea level rise, and climate change more generally. Given
that adaptation to climate change happens at the local level, local
government needs to be closely engaged by central government on
all decisions that it makes about existing and future climate change
challenges and responses.

10
4
Summary
analysis
Vulnerable: the quantum of local government infrastructure exposed to sea level rise 11increase in value is between 50 and 90 per cent. Notably, between 1.5 and 3.0 metres
Summary analysis is an approximate doubling of value exposed creating a total estimated value greater th
Never before have local governments combined to create a Figure Figure
1: Total 1: Total replacement
replacement valueinfrastructure
value of exposed of exposed
national review of their infrastructure exposed to sea level rise with infrastructure
a quantified estimate of replacement value. New Zealand is now
leading the charge to create clarity around potential impact and
associated cost due to climate change, and intends to share evidence $736,000,000
Total LiDAR Total DEM
and lessons learned internationally.
In initial review, the quantity and value of infrastructure exposed is not
extraordinary, nor perhaps unanticipated. However, noted quantities
and values are a baseline for “exposed” infrastructure only. No other
variables, such as timing of sea level rise and the various ways in
which councils can respond, are considered due to research time and
cost constraints. $2,743,000,000
$5,130,000,000
$7,824,000,000
This report addresses only local government owned infrastructure $13,368,000,000
that is exposed to sea level rise. Central government, businesses, and
other stakeholders also have investments, both in infrastructure and
other resources, that may be indirectly impacted if local government
owned infrastructure is impacted by rising seas. The full quantum
of impact is not yet fully understood, but key to New Zealand’s Note:
success in addressing the resilience of its “system” of assets is to Note:
1 Data includes, three waters, buildings/facilities, transport, landfills
communicate where and how intended responses to sea level rise 1Data includes, three waters, buildings/facilities, transport, landfills and green spaces.
and green spaces.
need to take place and why. 2National DEM data was only available at the MHWS + 3.0m elevation. It is important to note that while
2 National
much coarser it onlyDEM data was
represents onlyproportion
a small availableofatcouncils,
the MHWS and +the
3.0mrelated quantity/value of asse
elevation.
completeness, It is important
it is included to overall
within the note that
datawhile the DEM
set within data is
the MHWS muchcategory. Consequently, t
+ 3.0m
Quantity of Impacts has a greater
coarsernumber
it onlyofrepresents
councils represented. There will of
a small proportion also be a small
councils,
elevation bands for those councils that are not included within the totals.
proportion
and the of ‘DEM’ assets expo
related quantity/value of assets exposed. For completeness, it
All local government owned infrastructure exposed to sea level rise3 Please refer to Appendix B for all assumptions and limitations, including those councils which are DEM an
is included within the overall data set within the MHWS + 3.0m
has been quantified nationally at noted increments. Exposure varies
category. Consequently, the 3.0m category has a greater number of
in quantity and value based on region and sea level rise increment. The greatest value of exposed local government owned infrastructure is differe
councils represented. There will also be a small proportion of ‘DEM’
increments. Generally, at the 1.5 metre increment, Canterbury’s exposure is the grea
Three waters infrastructure has the greatest exposure. For example,by theassets exposed at the lower elevation bands for those councils that
Hawke’s Bay and bythe
Auckland.
at the 1.5 metre increment more than 6,000 kilometres of pipe is are not included within totals. Additional noted areas include Greater Welli
Plenty, Otago, and Waikato.
exposed, roughly equivalent to the distance of a return trip from 3 Please refer to Appendix B for all assumptions and limitations,
Melbourne to Darwin. The quantum of exposed roading at 1.5 metres Figure including those councilsvalue
2: Total replacement whichfor
arethree
DEM waters,
and LiDAR.
roading and buildings/facilities, per
is more than 2,000 kilometres (roughly the distance from Stockholm
to Rome). Additionally, almost 2,000 buildings/facilities are exposed
nationally. The greatest value of exposed local government owned infrastructure
is different at varying increments. Generally, at the 1.5 metre
increment, Canterbury’s exposure is the greatest, followed by the
Replacement values Hawke’s Bay and by Auckland. Additional noted areas include Greater
The total replacement value of all exposed infrastructure (three Wellington, Bay of Plenty, Otago, and Waikato.
waters, roading, buildings/facilities, green space and landfills) at
the 1.5 metre increment is estimated at approximately $8 billion.
Importantly, at each noted increase of sea level rise between 0.5 and
3.0 metres, the incremental increase in value is between 50 and 90
per cent. Notably, between 1.5 and 3.0 metres, the increase is an
approximate doubling of value exposed creating a total estimated
value greater than $13 billion.
12Figure 2: Total replacement value for three waters, roading and buildings/facilities, per region
$3,000,000,000.00
$2,500,000,000.00
$2,000,000,000.00
$1,500,000,000.00
$1,000,000,000.00
$500,000,000.00
$-
MHWS + 0.5 MHWS + 1.0 MHWS + 1.5 MHWS + 3.0 *
Note:
1 DataNote:
includes, three waters, buildings/facilities, transport, landfills and green spaces.
Data
1
2 National DEMincludes, three
data was onlywaters, buildings/facilities,
available at the MHWS + 3.0m transport,
elevation.landfills and green
Those councils withspaces.
DEM only data are those shown with only a
2National DEM data was only available at the MHWS + 3.0m elevation. Those councils with DEM only data are those shown
single bar at MHWS + 3.0m. Note that Northland, Bay of Plenty and Waikato both have a small proportion of DEM data included within their
with only
MHWS+3.0m a single bar at MHWS + 3.0m. Note that Northland, Bay of Plenty and Waikato both have a small proportion of
totals.
DEM data included within their MHWS+3.0m totals.
3 Please refer to Appendix B for all assumptions and limitations, including those councils which are DEM and LiDAR.
3 Please refer to Appendix B for all assumptions and limitations, including those councils which are DEM and LiDAR.
Time
Time Central to the issue of timing is that once the impacts of sea level
rise are fully recognised and stakeholders are forced to respond,
Time may Timebe themaymostbecritical
the variable of this analysis.
most critical Fromof
variable research,
this analysis.
it will beFrom
too lateresearch, it is clear
to comprehensively planthat theimpacts.
for future rate of sea
it is clear that the rate of sea level rise will accelerate with time,
level rise will accelerate with time, due in great part to increasing melt in Antarctica and Greenland.
Optimally, providers of infrastructure should not be in the “chase”
due in great part to increasing melt in Antarctica and Greenland. with infrastructure planning and development. Realistic expectations
Predictions
Predictions vary considerably
vary considerably depending on source, depending on source, although NASA scientists predict between a 30
although NASA for levels of service for roads, water and other infrastructure must be
centimetre
scientists anda1.3
predict between metre increase
30 centimetre by 2100.
and 1.3 metre increaseNIWA
by is moremanaged
planned, conservative in its estimates,
and communicated with now
with the public between
in order
2100. NIWA is more conservative in its
40 centimetres and roughly one metre. estimates, with between 40 to effectively and sustainably meet expectations. This will require a
centimetres and roughly one metre. lead-time with strong communication and collaboration across all
TimingTiming impacts how councils respond to impacts on essential infrastructure. Council administration,
owners and stakeholders of critical infrastructure.
impacts how councils respond to impacts on essential
research, planning, new procurement
infrastructure. Council administration, research, planning, new and community engagement will be required to respond to
procurement
numerous and community
associated engagement
threats willand
be required to
outcomes. For example, salinity in coastal aquifers and prolonged
respond to numerous associated threats and outcomes. For example,
inundation of water pipes will compound the issue of sea level rise, along with pressures from
salinity in coastal aquifers and prolonged inundation of water pipes
population
will compound growth
the issue andrise,
of sea level decline.
along with pressures from
population growth and decline.
Central to the issue of timing is that once the impacts of sea level rise are fully recognised and
stakeholders are forced to respond, it will be too late to comprehensively plan for future impacts.
Optimally, providers of infrastructure should not be in the “chase” with infrastructure planning and
development. Realistic expectations for levels of service for roads, water and other infrastructure
Vulnerable: the quantum of local government infrastructure exposed to sea level rise 13
must be planned, managed and communicated with the public now in order to effectively and
sustainably meet expectations. This will require a lead-time with strong communication andFigure 3 Global mean sea level rise
https://www.niwa.co.nz/natural-hazards/hazards/sea-levels-and-sea-level-rise
https://www.niwa.co.nz/natural-hazards/hazards/sea-levels-and-sea-level-rise
RCPs are “representative concentration pathways”, which characterise atmospheric concentrations of greenhouse gases and
RCPs are “representative concentration pathways”, which characterise atmospheric concentrations of greenhouse gases and aerosols.
aerosols. Climate modelling and research modelling is based on different climate futures, all of which are considered possible,
Climate modelling and research
depending on howmodelling is based
much greenhouse onisdifferent
gas climate
emitted in futures,
the years all of
to come. Thewhich are considered
four RCPs are labelled possible, depending
after a possible range on how much
greenhouse gasofisradiative
emitted forcing
in the years
valuesto
income. The
the year four
2100 RCPs to
relative arepre-industrial
labelled after a possible range of radiative forcing values in the year 2100
values.
relative to pre-industrial values.
Proposed actions
Proposed
In lightactions
targeted, set of proposed actions. They are:
3. study,
of the issues and challenges identified in this Complete
Risk
wethe
Agency,
approval
have
to assist
processa to
developed
and guide
create
very a Local
broad,
consistent and
butGovernment
expedited
In light of the issues and challenges identified in this study, we have planning, decision-making and procurement, and build local
1. Local government leads a national
developed a very broad, but targeted, set of proposed actions. They conversation about capability
government levels of service currently
and capacity to identify, quantify and
are: provided and what can be anticipated in the short
understand(1 – 10
risk. years), medium (10 – 30
years) and long-term (30+ years). This should include comprehensive and targeted
1. Local government leads acommunication
national conversation
and about 4. government
levels by local
engagement Local government coordinatesand
with residents withbusinesses
stakeholders that have
of service currently provided and what can be anticipated
exposed to rising sea levels. in exposed infrastructure to create a National Master Plan,
the short (1 – 10 years), medium (10 – 30 years) and long-term prioritising options and opportunities in responding to sea level
2. Central and local government coordinate torise. establish a National Climate Change
(30+ years). This should include comprehensive and targeted
Adaptation Fund to improve stakeholder participation in responding to climate change
communication and engagement by local government with
to ensure
residents and businesses exposed to equitable outcomes.
rising sea levels.
3. Complete the approval process to create a Local Government Risk Agency, to assist and
2. Central and local government guidecoordinate
consistent to establish a National
and expedited planning, decision-making and procurement, and build
Climate Change Adaptation Fund to improve stakeholder
local government capability and capacity to identify, quantify and understand risk.
participation in responding to climate change to ensure equitable
4. Local government coordinates with stakeholders that have exposed infrastructure to
outcomes.
create a National Master Plan, prioritising options and opportunities in responding to
sea level rise.
10
145
Three waters
Vulnerable: the quantum of local government infrastructure exposed to sea level rise 15Three Waters
Summary It is noted that some councils did not provide replacement values for
all assets, as either they were not available or the council chose not to
The national total replacement value of exposed council owned
provide the information.
three waters infrastructure exceeds the combined national total
replacement value of exposed roading and buildings. At 0.5 metres, a At 1.0 metre, the estimated total replacement value of water
conservative estimate of replacement value is roughly $1.4 billion. The infrastructure is approximately $2.6 billion and at 1.5 metre elevation,
infrastructure surveyed for this analysis consists of drinking, storm the estimated replacement value is $4 billion. At the 3.0 metre
and wastewater assets including: elevation, the overall estimated replacement value is over $7 billion.
These impacts are broken down into drinking water, stormwater and
•• Pipes;
wastewater.
•• Pump stations;
The survey assessed the replacement value of exposed infrastructure,
and does not cover other variables which may have a bearing on
•• Manholes; and
the impact of sea level rise, such as salt water intrusion into aquifer
•• Treatment plants. systems and investment to move further up freshwater channels (e.g.
rivers and streams) to draw drinking water without salt intrusion.
Irrigation and flood control assets are excluded (refer to section As with the data collected for transport and buildings/facilities, the
“Other Infrastructure”). baseline data only applies to the infrastructure exposed to sea level
Figure 4: Total
Figurenational replacement
4: Total national valuevalue
replacement for three waters
for three infrastructure
waters infrastructure --national
national
$8,000,000,000
$7,000,000,000
$6,000,000,000
$5,000,000,000
$4,000,000,000
$3,000,000,000
$2,000,000,000
$1,000,000,000
$-
Stormwater
Wastewater
Drinking
Total
Water
MHWS + 0.5 MHWS + 1.0 MHWS + 1.5 MHWS + 3.0*
*Note MHWS + 3.0m includes data from councils with both LiDAR and DEM contour information. For MHWS + 0.5, 1.0 and 1.5m only councils
with LiDAR contour information are presented in the totals. DEM data was only available at the MHWS + 3.0m elevation. It is important to note
that while the DEMMHWS
*Note data is+much coarser,data
3.0m includes it only represents
from a small
councils with bothproportion
LiDAR and of councils,
DEM contourand the related
information. Forquantity/value
MHWS + 0.5, 1.0of and
assets exposed.
For completeness, it iscouncils
1.5m only included within
with thecontour
LiDAR overallinformation
data set within the MHWS
are presented + 3.0m
in the category.
totals. DEM dataConsequently, the 3.0m
was only available at thecategory
MHWS + has a greater
3.0m elevation.
number of councils It is important
represented. There willtoalso
notebethat whileproportion
a small the DEM data is much
of ‘DEM’ coarser,
assets it only
exposed atrepresents a small proportion
the lower elevation bands forofthose councils
councils, and the related quantity/value of assets exposed. For completeness, it is included within the overall data set within
that are not included
the MHWSwithin
+ 3.0mthe totals. Consequently, the 3.0m category has a greater number of councils represented. There will also
category.
beAppendix
Please refer to a small proportion of ‘DEM’ assets
B for all assumptions exposed
and at the lower elevation bands for those councils that are not included within
limitations.
the totals.
Please refer to Appendix B for all assumptions and limitations.
16
As reflected in Figure 4, it was found that the costs to replace exposed wastewater infrastructure are
significantly higher than those for drinking and stormwater and, in some cases, exceed the combined
drinking and storm water infrastructure replacement costs.rise, not ongoing adjustments to systems, adaptation planning and replacement value exceeding the replacement value of other water
measures or any other related activity. infrastructure.
As reflected in Figure 4, it was found that the costs to replace Further, based on current estimates the asset count doubles at each
exposed wastewater infrastructure are significantly higher than measured increment of sea level rise. For example, at the 1.0 metre
those for drinking and stormwater and, in some cases, exceed the elevation, the number of exposed pump stations is approximately
combined drinking and storm water infrastructure replacement 150. This increases to 370 at the 1.5 metre increment, then to more
costs. than 840 at 3.0 metres.
Exposed wastewater and stormwater pipes represent the greatest
North Island potential costs. The total amount of exposed three waters pipelines
The North Island has a total value of exposed water infrastructure at 1.0 metre includes more than 2,700 kilometres of stormwater,
of $1.5 billion at the 1.0 metre increment. This is comprised of $400 wastewater and potable water pipes, 20 treatment plants, more than
million for stormwater, $920 million for wastewater and $230 million 9,000 manholes and over 200 pump stations.
for drinking water. It is noted that the total is roughly 50 per cent
higher than the South Island. Again, there is a trend of wastewater
Figure 5: Total replacement
Figure value for
5: Total replacement three
value for waters infrastructure
three waters – –North
infrastructure NorthIsland
Island
$4,500,000,000
$4,000,000,000
$3,500,000,000
$3,000,000,000
$2,500,000,000
$2,000,000,000
$1,500,000,000
$1,000,000,000
$500,000,000
$-
Stormwater
Wastewater
Drinking
Total
Water
MHWS + 0.5 MHWS + 1.0 MHWS + 1.5 MHWS + 3.0 *
*Note MHWS + 3.0m includes data from councils with both LiDAR and DEM contour information. For MHWS + 0.5, 1.0 and 1.5m only councils
with LiDAR contour
*Noteinformation
MHWS + 3.0m areincludes
presenteddatainfrom
the councils
totals. DEM
with data was only
both LiDAR andavailable
DEM contour at the MHWS + For
information. 3.0m
MHWSelevation. It isand
+ 0.5, 1.0 important to note
1.5mdata
that while the DEM only councils
is muchwith LiDARitcontour
coarser, information
only represents are presented
a small in the
proportion oftotals. DEMand
councils, datathe
was only available
related quantityat/the MHWS
value +
of assets exposed.
3.0mitelevation.
For completeness, is includedIt within
is important to notedata
the overall thatset
while the the
within DEMMHWS
data is+much
3.0mcoarser,
category. it only represents athe
Consequently, small proportion
3.0m categoryofhas a greater
councils,
number of councils and the related
represented. Therequantity / value
will also be aofsmall
assets exposed. For
proportion completeness,
of ‘DEM’ it is included
assets exposed within
at the theelevation
lower overall data set within
bands for those councils
the MHWS + 3.0m category. Consequently, the 3.0m category has a greater number of councils represented. There will also
that are not included within the totals.
be a small proportion of ‘DEM’ assets exposed at the lower elevation bands for those councils that are not included within
Please refer to Appendix
the totals. B for all assumptions and limitations.
Please refer to Appendix B for all assumptions and limitations.
Further, based on current estimates the asset count doubles at each measured increment of sea level
rise. For example, at the 1.0 metre elevation, the number of exposed pump stations is approximately
150. This increases to 370 at the 1.5 metre increment, then to more than 840 at 3.0 metres.
Vulnerable: the quantum of local government infrastructure exposed to sea level rise 17
Exposed wastewater and stormwater pipes represent the greatest potential costs. The total amount
of exposed three waters pipelines at 1.0 metre includes more than 2,700 kilometres of stormwater,Wastewater infrastructure, again, is the most exposed of the three waters infrastructure, having
double the value of stormwater. Exposed stormwater infrastructure is often significantly higher than
the value of drinking water.
Figure 6: Total6:three
Figure Totalwaters
three replacement value – North
waters replacement value –Island
Northpriority areas areas
Island priority
$900,000,000
$800,000,000
$700,000,000
$600,000,000
$500,000,000
$400,000,000
$300,000,000
$200,000,000
$100,000,000
$-
Bay of
Plenty Hawke's Bay Waikato
Region Region Auckland
Region
Region
MHWS + 0.5 MHWS + 1.0
Notes:
Notes:
1. All of the above regions had LiDAR contour information available.
1. All of the above regions had LiDAR contour information available.
2. Please 2.refer to Appendix
Please refer toBAppendix
for all assumptions and limitations.
B for all assumptions and limitations.
3. Auckland3. Auckland
values do values do not
not include includeplants.
treatment treatment plants.
Priority regions
As shown – North
in Figure Island Bay region shows
6, the Hawke’s South Islandexposure of water infrastructure at
the greatest
North Island
all priority regions have
increments the largest
of sea level total
rise.exposed assets
For comparison, The South1.0
at the Island’s
metretotal increment,
replacement valuetheofHawke’s
exposed water
Bay region
combined with the highest replacement value. These regions include infrastructure is $1 billion at the 1.0 metre increment. This is made up
has approximately $430 million exposed, the Auckland Region indicates $350 million, the Waikato
Hawke’s Bay, Bay of Plenty, Waikato and Auckland. Specifically, three of $230 million for stormwater, $580 million for wastewater and $200
region has
waters infrastructure $300
at the million,
1.0 metre and the
increment Bayareas
for these of Plenty
has region $280
million for million.
drinking It is noted
water. Given that Island
that the South Auckland’s values
has roughly 25
do not include
a total replacement treatment
value of $1.4 plants.
billion, at the 1.5 metre increment it per cent of New Zealand’s population, this means local councils in
is valued at $2.1 billion, and at the 3.0 metre increment, it is $3 billion. the South Island will likely face higher replacement costs per capita.
The valuesSouth
increase by roughly 50 to 75 per cent at each increment.
Island
Wastewater infrastructure, again, is the most exposed of the three In total, the amount of exposed water infrastructure at 1.0 metre
waters infrastructure, includes approximately 1,400 kilometres of stormwater, wastewater
The Southhaving doubletotal
Island’s the value of stormwater.value of exposed
replacement water infrastructure is $1 billion at the 1.0
Exposed stormwater infrastructure is often significantly higher than and potable water pipes, one treatment plant, more than 4,700
the value metre increment.
of drinking water. This is made up of $230 million for stormwater,
manholes and over 180 pump $580 million
stations. for wastewater
Wastewater and
pipes and storm
$200 million for drinking water. Given that the South Island has roughly 25 per cent of New Zealand’s
water pipes represent the greatest proportion of potential value
As shownpopulation,
in Figure 6, the Hawke’s Bay region
this means localshows the greatest
councils exposed.
in the South Island will likely face higher replacement costs per
exposure of water infrastructure at all increments of sea level rise. For
capita.
comparison, at the 1.0 metre increment, the Hawke’s Bay region has
approximately $430 million exposed, the Auckland Region indicates
$350 million, the Waikato region has $300 million, and the Bay of
Plenty region $280 million. It is noted that Auckland’s values do not
include treatment plants.
18Figurereplacement
Figure 7: Total 7: Total replacement value
value for for three
three waterswaters infrastructure
infrastructure – South
– South Island
Island
$3,500,000,000
$3,000,000,000
$2,500,000,000
$2,000,000,000
$1,500,000,000
$1,000,000,000
$500,000,000
$-
Stormwater
Wastewater
Drinking
Water Total
MHWS + 0.5 MHWS + 1.0 MHWS + 1.5 MHWS + 3.0 *
*Note MHWS + 3.0m includes data from councils with both LiDAR and DEM contour information. For MHWS + 0.5, 1.0 and 1.5m only councils
*Note MHWS + 3.0m includes data from councils with both LiDAR and DEM contour information. For MHWS + 0.5, 1.0 and
with LiDAR contour information are presented in the totals. DEM data was only available at the MHWS + 3.0m elevation. It is important to note
1.5m only councils with LiDAR contour information are presented in the totals. DEM data was only available at the MHWS +
that while the DEM data is much coarser, it only represents a small proportion of councils, and the related quantity / value of assets exposed.
3.0m elevation. It is important to note that while the DEM data is much coarser, it only represents a small proportion of
For completeness, it is included within the overall data set within the MHWS + 3.0m category. Consequently, the 3.0m category has a greater
councils, and the related quantity / value of assets exposed. For completeness, it is included within the overall data set within
number of councils represented. There will also be a small proportion of ‘DEM’ assets exposed at the lower elevation bands for those councils
the MHWS + 3.0m category. Consequently, the 3.0m category has a greater number of councils represented. There will also
that are not be
included within the totals.
a small proportion of ‘DEM’ assets exposed at the lower elevation bands for those councils that are not included within
Please refer the
to Appendix
totals. B for all assumptions and limitations.
Please refer to Appendix B for all assumptions and limitations.
Priority regions – South Island The Otago region shows $270 million of exposed three waters
infrastructure at the 1.0includes
metre increment, which increases
In total,
The priority regions theSouth
for the amount
Island of exposed
represent water
the three infrastructure
regions at 1.0 metre approximately 1,400
significantly with inundation depth. For example, at 0.5 metres of
that have thekilometres
largest total of stormwater,
of exposed wastewater
assets combined withand potable water pipes, one treatment plant, more than 4,700
the highest sea level rise, five pump stations are exposed, at 1.5 metres, 30 are
replacementmanholes
value. Theseand over
regions 180Canterbury,
include pump stations.
Otago andWastewater pipes
exposed andand
at 3.0storm
metres,water
55 arepipes
exposed. represent the
Nelson, withgreatest
Canterburyproportion
having the most exposed assets.
of potential value exposed.Specifically,
three waters infrastructure at the 0.5 metre increment for these areas Further, at 0.5 metres, approximately 408 kilometres of storm water,
Priority regions
has a total replacement value of–$470
South Island
million, at 1.0 metre it is $970 wastewater and water supply pipes are exposed, and at 1.5 metres
million, at the 1.5 metre increment it is $1.5 billion, and at the 3.0 approximately 607 kilometres are exposed. Uniquely, no treatment plants
The itpriority
metre increment regions
is $2.6 billion. As infor the South
the North Island,Island represent are
wastewater theexposed
threeatregions
0.5 metres,that
buthave
six are the
at 3.0largest
metres oftotal of rise.
sea level
infrastructureexposed
is by far the most exposed
assets combined of thewith
threethe
waters.
highest replacement value. These regions include Canterbury,
Otago and Nelson, with Canterbury having the most exposed assets. Specifically, three waters
At the 1.0 metre increment, the Canterbury region has exposed water
infrastructure at the 0.5 metre increment for these areas has a total replacement value of $470
infrastructure valued at more than $630 million. This includes 650
kilometres ofmillion, at 1.0
water pipes andmetre
over 120it is $970
pump million,
stations. at the 1.5 metre increment it is $1.5 billion, and at the 3.0 metre
Regarding
increment it is $2.6 billion. As in the
pump stations in Canterbury, the number exposed at the 3.0 metre North Island, wastewater infrastructure is by far the most exposed
of the
elevation jumps three waters.
to approximately 230 at a current value of more than
$210 million.
Vulnerable: the quantum of local government infrastructure exposed to sea15
level rise 19At the 1.0 metre increment, the Canterbury region has exposed water infrastructure valued at more
than $630 million. This includes 650 kilometres of water pipes and over 120 pump stations. Regarding
pump stations in Canterbury, the number exposed at the 3.0 metre elevation jumps to approximately
230 at a current value of more than $210 million.
The Otago region shows $270 million of exposed three waters infrastructure at the 1.0 metre
increment, which increases significantly with inundation depth. For example, at 0.5 metres of sea level
rise, five pump stations are exposed, at 1.5 metres, 30 are exposed and at 3.0 metres, 55 are exposed.
Further, at 0.5 metres, approximately 408 kilometres of storm water, wastewater and water supply
pipes are exposed, and at 1.5 metres approximately 607 kilometres are exposed. Uniquely, no
treatment plants are exposed at 0.5 metres, but six are at 3.0 metres of sea level rise.
Figure 8: Figure 8: Total three waters replacement value – South Island priority areas
Total three waters replacement value – South Island priority areas
$2,000,000,000
$1,800,000,000
$1,600,000,000
$1,400,000,000
$1,200,000,000
$1,000,000,000
$800,000,000
$600,000,000
$400,000,000
$200,000,000
$-
Canterbury Region
Otago Region
Nelson Region
MHWS + 0.5 MHWS + 1.0 MHWS + 1.5 MHWS + 3.0
Notes:
Notes:
1. ll of the above regions had LiDAR contour information available.
1. All
2. Please refer to of the above
Appendix regions
B for had LiDAR contour
all assumptions information available.
and limitations.
2. Please refer to Appendix B for all assumptions and limitations.
Proposed actions
Proposed actions
•• Coordinate with stakeholders on a list of prioritised research
activities that evaluates compounding events and circumstances
As this analysis has clarified challenges associated withaccelerating
As this analysis has clarified challenges associated with forecasted forecasted therisks
impacts
andof replacement
sea level rise; value of
risks and replacement value of exposed infrastructure, we can
exposed infrastructure, we can begin to formulate •andbegin address practical recommendations to turn that ensure
• Agree to land use planning and consenting processes
to formulate and address practical recommendations to turn them
them into opportunities. sea level rise and associated impacts on existing and future water
into opportunities.
infrastructure resources are evaluated;
To adequately plan for and address the potential impacts on exposed water infrastructure, councils
To adequately plan for and address the potential impacts on
need to undertake analysis and reporting of the impacts •• Exploreofoptions
sea level rise on local
for a legislative three towaters
amendment address the LGA’s
exposed water infrastructure, councils need to undertake analysis
current limitations allowing councils to cease providing water
and reporting of the impacts of sea level rise on local three waters
services; and
networks. For example, we estimate that the minimum value of
exposed water infrastructure at 1.0 metre is more than $540 per
•• Commitment by councils to plan for resilience by avoiding
16 areas
person nationally (in today’s costs).
exposed to sea level rise.
•• Primary recommendations that include both council-led
initiatives and joint stakeholder/owner coordination include:
206
Roading
Vulnerable: the quantum of local government infrastructure exposed to sea level rise 21metre is more than $540 per person nationally (in today’s costs).
Primary recommendations that include both council-led initiatives and joint stakeholder/owner
coordination include:
● Coordinate with stakeholders on a list of prioritised research activities that evaluates
compounding events and circumstances accelerating the impacts of sea level rise;
● Agree to land use planning and consenting processes that ensure sea level rise and
associated impacts on existing and future water infrastructure resources are evaluated;
● Explore options for a legislative amendment to address the LGA’s current limitations
allowing councils to cease providing water services; and
Roading
● Commitment by councils to plan for resilience by avoiding areas exposed to sea level rise.
Roading
Summary North Island
The 2015 NIWA report, “National and regional risk exposure in The North Island has a total value of exposed roading infrastructure
Summary
low-lying coastal areas” noted that at up to 1.5 metres of sea level of approximately $400 million at the 1.0 metre increment, equating
rise 1,930 kilometres of local roads would be exposed, and 3,556 to approximately 800 kilometres of road. Generally, the North Island
The 2015
kilometres at theNIWA
3.0 metrereport, “National
level. LGNZ’s andanregional
analysis shows increase riskhas
exposure
higher levelsinoflow-lying
exposure for coastal areas” noted
roading infrastructure than thethat
Southat
over the quantities represented in the NIWA study. LGNZ’s study Island.
up to 1.5 metres of sea level rise 1,930 kilometres of local roads would be exposed, and 3,556
indicates approximately 2,100 kilometres of roads exposed up to
thekilometres at the
1.5 metre increment, 3.0
with metre level.
a replacement value ofLGNZ’s analysis
$1.0 billion. For shows
As shown,antheincrease overroad
length of exposed theincreases
quantities represented
significantly at each
in the
roads exposedNIWAto 3.0study.
metres ofLGNZ’s study
sea level rise, indicates
LGNZ’s approximately 2,100 kilometres of roads exposed upmetre
analysis reflects measured increment of sea level rise. For example, at the 0.5 to the
an additional 1,003 kilometres of exposure compared to the NIWA elevation there is approximately 380 kilometres of road exposed. This
1.5 metre increment, with a replacement value of $1.0 billion. For roads exposed to 3.0 metres of sea
increases to 800 kilometres at the 1.0 metre increment and 1,200
study, with 4,559 kilometres of road exposed, at a replacement value
level
of $2.3 rise,
billion. OurLGNZ’s analysis
analysis accounts forreflects
both sealedan andadditional
unsealed 1,003 kilometres
kilometres of exposure
at the 1.5 metre compared
elevation (roughly, to the
the distance from NIWA
study,
roads, with
but does not 4,559 Invercargill to Auckland). At the
kilometres of road exposed, at a replacement value of $2.3 billion. Our analysis
include bridges. 3.0 metre elevation, approximately
2,860 kilometres is exposed.
accounts for both sealed and unsealed roads, but does not include bridges.
Figure 9: Total replacement value for roading - National
Figure 9: Total replacement value for roading - National
$2,500,000,000
$2,000,000,000
$1,500,000,000
$1,000,000,000
$500,000,000
$-
North Island
South Island
Total
MHWS + 0.5 MHWS + 1.0
*Note MHWS + 3.0m includes data from councils with both LiDAR and DEM contour information. For MHWS + 0.5, 1.0 and
*Note MHWS + 3.0m includes data from councils with both LiDAR and DEM contour information. For MHWS + 0.5, 1.0 and 1.5m only councils
1.5m only councils with LiDAR contour information are presented in the totals. DEM data was only available at the MHWS +
with LiDAR contour information are presented in the totals. DEM data was only available at the MHWS + 3.0m elevation. It is important to note
3.0m elevation. It is important to note that while the DEM data is much coarser, it only represents a small proportion of
that while the DEM data is much coarser, it only represents a small proportion of councils, and the related quantity / value of assets exposed.
councils, and the related quantity / value of assets exposed. For completeness, it is included within the overall data set within
For completeness, it is included within the overall data set within the MHWS + 3.0m category. Consequently, the 3.0m category has a greater
the MHWS + 3.0m category. Consequently, the 3.0m category has a greater number of councils represented. There will also
number of councils represented. There will also be a small proportion of ‘DEM’ assets exposed at the lower elevation bands for those councils
which are not included within the totals.
Please refer to Appendix B for all assumptions and limitations.
17
22be a small proportion of ‘DEM’ assets exposed at the lower elevation bands for those councils which are not included within
the totals.
Please refer to Appendix B for all assumptions and limitations.
North Island
The North Island has a total value of exposed roading infrastructure of approximately $400 million at
the 1.0 metre increment, equating to approximately 800 kilometres of road. Generally, the North
Priority Regions – North Island Quantity Exposed
Island has higher levels of exposure for roading infrastructure than the South Island.
Roading infrastructure exposed to sea level rise varies around the Figure 11 highlights that the Bay of Plenty, Hawke’s Bay and Auckland
country. In the North Island, Auckland, the Hawke’s Bay, and Bay regions have the greatest length of roads exposed for all increments
As shown, the length of exposed road increases significantly at each measured increment of sea level
of Plenty show the greatest length and value of roads exposed to of sea level rise. For example at 0.5 metres, 170 kilometres is exposed
rise.
sea level rise in theFor
shortexample, at thefigure
term. The following 0.5 illustrates
metre elevation
the thereallisthree
across approximately
regions. 380 kilometres of road exposed.
Thisranging
value exposed, increases
from 0.5to 800metres
to 3.0 kilometres
for the fourat the 1.0 metre increment and 1,200 kilometres at the 1.5 metre
elevation
increments. In general, lengths of roads exposed increase relatively consistently
elevation (roughly, the distance from Invercargill toin Auckland).
with increases Atthree
sea level rise. These the 3.0regions
priority metre elevation,
account
approximately 2,860 kilometres is exposed. for around 60 per cent of the total estimated value of exposed
Value Exposed roading on the North Island at the 1.0 metre increment.
Hawke’s BayPriority Regions
has the greatest – North
potential exposedIsland
value up to 1.5
Hawke’s Bay has the highest quantity of roading exposed across all
metres above MHWS. Auckland exceeds Hawke’s Bay only for the 3.0
elevation increments. The Bay of Plenty follows, with Auckland closely
metre increment.
Roading More infrastructure
specifically, the estimated
exposedvalue ofto
exposed
sea levelbehind.
rise varies
At the 1.0around the Hawke’s
metre elevation, country. In 160
Bay has thekilometres
North Island,
infrastructure in the Hawke’s Bay at the 1.0 metre increment is $126
Auckland, the Hawke’s Bay, and Bay of Plenty exposed,
million, which is 60 per cent higher than Auckland’s. The total value
show the greatest
Bay of Plenty haslength and value
115 kilometres, of roads
and Auckland has 95exposed to
kilometres, for a combined total of 370 kilometres. These priority
for exposedsea level
roading rise in the
infrastructure for short term.
the priority The
regions following
at the 1.0 figure illustrates the value exposed, ranging from 0.5 to
regions account for roughly 45 per cent of total length of exposed
metre increment is approximately $250 million.
3.0 metres for the four elevation increments. roading within the North Island.
Figure 10: Replacement value of exposed roading – North Island priority regions
Figure 10: Replacement value of exposed roading – North Island priority regions
$450,000,000
$400,000,000
$350,000,000
$300,000,000
$250,000,000
$200,000,000
$150,000,000
$100,000,000
$50,000,000
$-
Bay of Plenty
Region Hawkes Bay
Region Auckland
Region
MHWS + 0.5 MHWS + 1.0
Notes:
1. All of theNotes:
above regions had LiDAR contour information available.
1. All
2. Please refer to of the above
Appendix B forregions had LiDAR
all assumptions andcontour information available.
limitations.
2. Please refer to Appendix B for all assumptions and limitations.
Vulnerable: the quantum of local government infrastructure exposed to sea level rise 23
18You can also read