DA-ITSI-TELEGRAF-KAFKA - Documentation Release 1 Guilhem Marchand - the ITSI module ...
←
→
Page content transcription
If your browser does not render page correctly, please read the page content below
DA-ITSI-TELEGRAF-KAFKA
           Documentation
                   Release 1

            Guilhem Marchand

                    Mar 02, 2020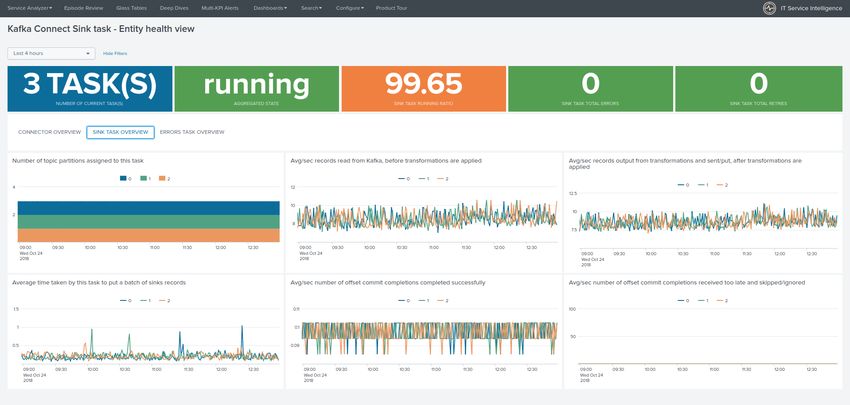
Contents
1 Overview: 3
1.1 About . . . . . . . . . . . . . . . . . . . . . . . . . . . . . . . . . . . . . . . . . . . . . . . . . . . 3
1.2 Compatibility . . . . . . . . . . . . . . . . . . . . . . . . . . . . . . . . . . . . . . . . . . . . . . . 4
1.3 Known Issues . . . . . . . . . . . . . . . . . . . . . . . . . . . . . . . . . . . . . . . . . . . . . . . 5
1.4 Support . . . . . . . . . . . . . . . . . . . . . . . . . . . . . . . . . . . . . . . . . . . . . . . . . . 5
1.5 Download . . . . . . . . . . . . . . . . . . . . . . . . . . . . . . . . . . . . . . . . . . . . . . . . . 6
2 Deployment and configuration: 7
2.1 Deployment & Upgrades . . . . . . . . . . . . . . . . . . . . . . . . . . . . . . . . . . . . . . . . . 7
2.2 Implementation & data collection . . . . . . . . . . . . . . . . . . . . . . . . . . . . . . . . . . . . 8
2.3 Docker testing templates . . . . . . . . . . . . . . . . . . . . . . . . . . . . . . . . . . . . . . . . . 35
2.4 Entities discovery . . . . . . . . . . . . . . . . . . . . . . . . . . . . . . . . . . . . . . . . . . . . 37
2.5 Services creation . . . . . . . . . . . . . . . . . . . . . . . . . . . . . . . . . . . . . . . . . . . . . 41
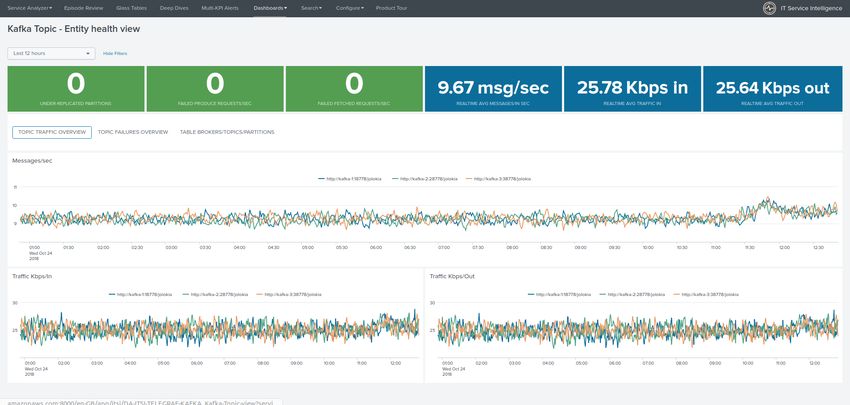
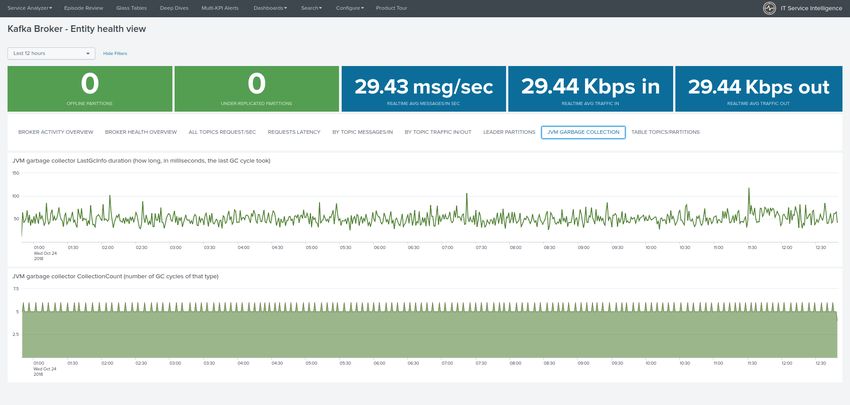
2.6 ITSI Entities dashboard (health views) . . . . . . . . . . . . . . . . . . . . . . . . . . . . . . . . . 64
3 Troubleshoot: 85
3.1 Troubleshoot & FAQ . . . . . . . . . . . . . . . . . . . . . . . . . . . . . . . . . . . . . . . . . . . 85
4 Versioniong and build history: 87
4.1 Release notes . . . . . . . . . . . . . . . . . . . . . . . . . . . . . . . . . . . . . . . . . . . . . . . 87
i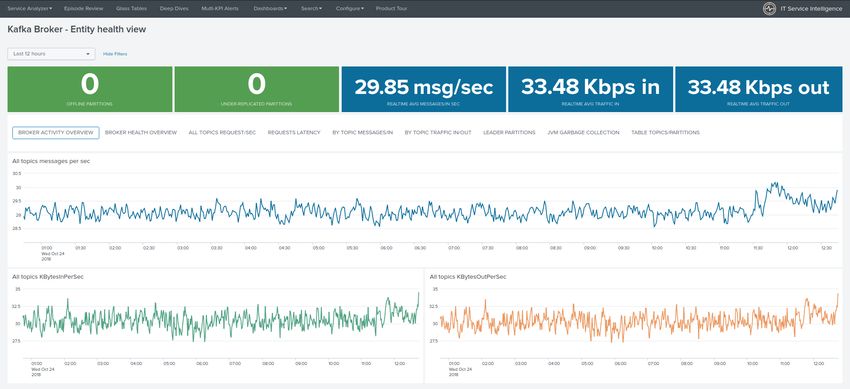
ii
DA-ITSI-TELEGRAF-KAFKA Documentation, Release 1

The ITSI module for Telegraf Kafka monitoring provides smart insight monitoring for Apache Kafka monitoring, on
top of Splunk and ITSI.

Contents                                                                                                     1
DA-ITSI-TELEGRAF-KAFKA Documentation, Release 1

The ITSI provides builtin and native monitoring for all Apache Kafka components, as well as the Confluent
stack components:
    • Zookeeper
    • Apache Kafka Brokers
    • Apache Kafka Connect
    • Confluent schema-registry
    • Confluent ksql-server
    • Confluent kafka-rest
    • Kafka SLA and end to end monitoring with the LinkedIn Kafka monitor
    • Kafka Consumers lag monitoring with Burrow (Kafka Connect connectors, Kafka Streams. . . )
Fully multi-tenant compatible, the ITSI module can manage different environments or data-centers using tags
at metrics low level.
It is recommended to read the unified guide for Kafka and Confluent monitoring first:
https://splunk-guide-for-kafka-monitoring.readthedocs.io

2                                                                                                  Contents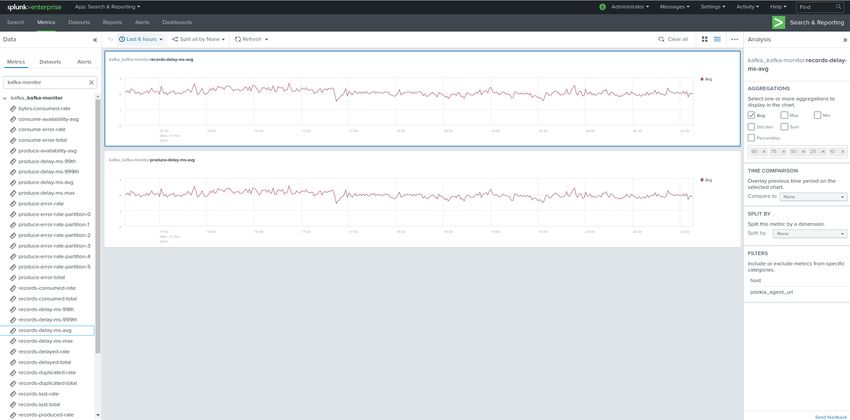
CHAPTER            1

                                                                                                     Overview:

1.1 About

   • Author: Guilhem Marchand
   • First release published in October 2018
   • Purposes:
The ITSI module for Apache Kafka end to end monitoring leverages the best components to provide a key layer
monitoring for your Kafka infrastructure :
   • Telegraf from Influxdata (https://github.com/influxdata/telegraf)
   • Jolokia for the remote JMX collection over http (https://jolokia.org)
   • Telegraf Jolokia2 input plugin (https://github.com/influxdata/telegraf/tree/master/plugins/inputs/jolokia2)
   • Telegraf Zookeeper input plugin (https://github.com/influxdata/telegraf/tree/master/plugins/inputs/zookeeper)
   • LinkedIn Kafka monitor to provide end to end monitoring (https://github.com/linkedin/kafka-monitor)
   • Kafka Consumers lag monitoring with Burrow (https://github.com/linkedin/Burrow)
The ITSI module provides a native and builtin integration with Splunk and ITSI:
   • Builtin entities discovery for Zookeeper servers, Kafka brokers, Kafka connect nodes, Kafka connect source and
     sink tasks, Kafka-monitor, Kafka topics, Kafka Consumers, Confluent schema-registry/ksql-servers/kafka-rest
   • Services templates and KPI base searches for Zookeeper, Kafka brokers, Kafka connect and source/sink tasks,
     Kafka LinkedIn monitor, Kafka topics, Kafka Consumers Lag monitoring, Confluent schema-registry
   • Rich entity health views to manage Operating System metrics ingested in the Splunk metric store

                                                                                                                     3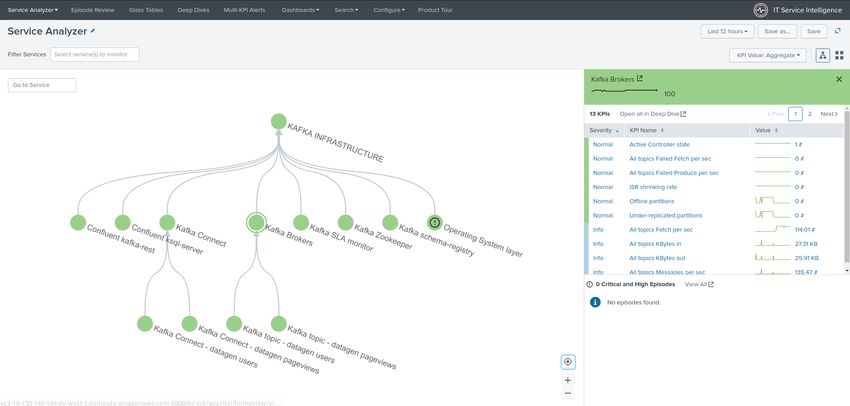
DA-ITSI-TELEGRAF-KAFKA Documentation, Release 1

1.2 Compatibility

1.2.1 Splunk compatibility

All the metrics are ingested into the high performance Splunk metric store, Splunk 7.0.x or higher is required.

4                                                                                           Chapter 1. Overview:
DA-ITSI-TELEGRAF-KAFKA Documentation, Release 1

1.2.2 ITSI compatibility

The ITSI module has been tested and qualified against reasonably fresh versions of ITSI, recommended version is
3.1.0 and higher, previous versions may work as well although it has not and will not be tested.

1.2.3 Telegraf compatibility

Telegraf supports various operating systems and process architectures including any version of Linux and Windows.
For more information:
    • https://portal.influxdata.com/downloads

1.2.4 Containers compatibility

If you are running Kafka in containers, you are at the right place, all of the components can natively run in docker.

1.2.5 Kafka and Confluent compatibility

Qualification and certification is made against Kafka V2.x and Confluent V5.x, earlier versions might however work
with no issues but are not being tested.

1.3 Known Issues

There are no known issues at the moment.

1.4 Support

The ITSI module for Telegraf Apache Kafka smart monitoring is community supported.
To get support, use of one the following options:

1.4.1 Splunk Answers

Open a question in Splunk answers for the application:
    • https://answers.splunk.com/app/questions/4261.html

1.4.2 Splunk community slack

Contact me on Splunk community slack, or even better, ask the community !
    • https://splunk-usergroups.slack.com

1.4.3 Open a issue in Git

To report an issue, request a feature change or improvement, please open an issue in Github:
    • https://github.com/guilhemmarchand/DA-ITSI-TELEGRAF-KAFKA/issues

1.3. Known Issues                                                                                                       5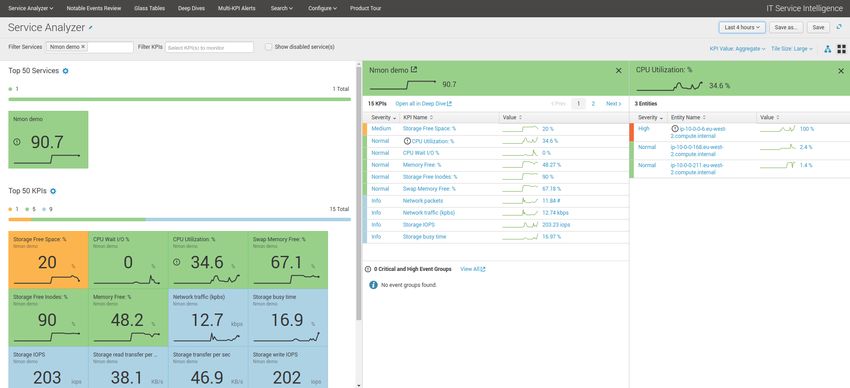
DA-ITSI-TELEGRAF-KAFKA Documentation, Release 1

1.4.4 Email support

    • guilhem.marchand@gmail.com
However, previous options are far betters, and will give you all the chances to get a quick support from the community
of fellow Splunkers.

1.5 Download

1.5.1 ITSI Module for Telegraf Apache Kafka smart monitoring

The ITSI Module for Telegraf Apache Kafka can be downloaded from:

Splunk base

    • https://splunkbase.splunk.com/app/4261

GitHub

    • https://github.com/guilhemmarchand/DA-ITSI-TELEGRAF-KAFKA

6                                                                                           Chapter 1. Overview:
CHAPTER 2
Deployment and configuration:
2.1 Deployment & Upgrades
2.1.1 Deployment matrix
Splunk roles required
ITSI Search head yes
Indexer tiers no
If ITSI is running in Search Head Cluster (SHC), the ITSI module must be deployed by the SHC deployer.
The deployment and configuration of the ITSI module requires the creation of a dedicated metric index (by default
called telegraf_kafka), see the implementation section.
2.1.2 Initial deployment
The deployment of the ITSI module for Telegraf Kafka is straight forward.
Deploy the ITSI module using one of the following options:
• Using the application manager in Splunk Web (Settings / Manages apps)
• Extracting the content of the tgz archive in the “apps” directory of Splunk
• For SHC configurations (Search Head Cluster), extract the tgz content in the SHC deployer and publish the SHC
bundle
2.1.3 Upgrades
Upgrading the ITSI module is pretty much the same operation than the initial deployment.
7DA-ITSI-TELEGRAF-KAFKA Documentation, Release 1 2.1.4 Upgrades of the components Upgrading the different components (Telegraf, Jolokia, etc.) rely on each of the technologies, please consult the deployment main pages. 2.2 Implementation & data collection Data collection diagram overview: 8 Chapter 2. Deployment and configuration:
DA-ITSI-TELEGRAF-KAFKA Documentation, Release 1

2.2.1 Splunk configuration

Index definition

The application relies by default on the creation of a metrics index called “telegraf_kafka”:
indexes.conf example with no Splunk volume::

2.2. Implementation & data collection                                                           9
DA-ITSI-TELEGRAF-KAFKA Documentation, Release 1

[telegraf_kafka]
coldPath = $SPLUNK_DB/telegraf_kafka/colddb
datatype = metric
homePath = $SPLUNK_DB/telegraf_kafka/db
thawedPath = $SPLUNK_DB/telegraf_kafka/thaweddb

indexes.conf example with Splunk volumes::

[telegraf_kafka]
coldPath = volume:cold/telegraf_kafka/colddb
datatype = metric
homePath = volume:primary/telegraf_kafka/db
thawedPath = $SPLUNK_DB/telegraf_kafka/thaweddb

In a Splunk distributed configuration (cluster of indexers), this configuration stands on the cluster master node.
All Splunk searches included in the added refer to the utilisation of a macro called “telegraf_kafka_index” configured
in:
     • telegraf-kafka/default/macros.conf
If you wish to use a different index model, this macro shall be customized to override the default model.

HEC input ingestion and definition

The default recommended way of ingesting the Kafka metrics is using the HTTP Events Collector method
which requires the creation of an HEC input.
inputs.conf example:

[http://telegraf_kafka_monitoring]
disabled = 0
index = telegraf_kafka
token = 205d43f1-2a31-4e60-a8b3-327eda49944a

If you create the HEC input via Splunk Web interface, it is not required to select an explicit value for source and
sourcetype.
The HEC input will be ideally relying on a load balancer to provides resiliency and load balancing across your HEC
input nodes.

Other ingesting methods

There are other methods possible to ingest the Kafka metrics in Splunk:
     • TCP input (graphite format with tags support)
     • KAFKA ingestion (Kafka destination from Telegraf in graphite format with tags support, and Splunk connect
       for Kafka)
     • File monitoring with standard Splunk input monitors (file output plugin from Telegraf)
Notes: In the very specific context of monitoring Kafka, it is not a good design to use Kafka as the ingestion method
since you will most likely never be able to know when an issue happens on Kafka.
These methods require the deployment of an additional Technology addon: https://splunkbase.splunk.com/app/
4193
These methods are heavily described here: https://da-itsi-telegraf-os.readthedocs.io/en/latest/telegraf.html

10                                                                  Chapter 2. Deployment and configuration:
DA-ITSI-TELEGRAF-KAFKA Documentation, Release 1
2.2.2 Telegraf installation and configuration
Telegraf installation, configuration and start
If you are running Telegraf as a regular process in machine, the standard installation of Telegraf is really
straightforward, consult:
• https://github.com/influxdata/telegraf
If you have a Splunk Universal Forwarder deployment, you can deploy, run and maintain Telegraf and its
configuration through a Splunk application (TA), consult:
• https://da-itsi-telegraf-os.readthedocs.io/en/latest/telegraf.html#telegraf-deployment-as-splunk-application-deployed-by-splunk-t
An example of a ready to use TA application can be found here:
• https://github.com/guilhemmarchand/TA-telegraf-amd64
For Splunk customers, this solution has various advantages as you can deploy and maintain using your existing Splunk
infrastructure.
Telegraf is extremely container friendly, a container approach is very convenient as you can easily run multiple
Telegraf containers to monitor each of the Kafka infrastructure components:
• https://hub.docker.com/r/_/telegraf/
Data collection environment design:
The most scalalable and highly available design in term of where placing the Telegraf instances is to deploy Telegraf
locally on each server to be monitored (and collect locally the component) or running as a side car container for
Kubernetes based environments.
It is to possible to collect multiple instances of multiple components via a unique Telegraf instance, however there will
be a limit where issues can start, and this design will not provide high availability as the failure of this instance will
impact the whole metric collection.
2.2.3 Telegraf output configuration
Whether you will be running Telegraf in various containers, or installed as a regular software within the different
servers composing your Kafka infrastructure, a minimal configuration is required to teach Telegraf how to forward the
metrics to your Splunk deployment.
Telegraf is able to send to data to Splunk in different ways:
• Splunk HTTP Events Collector (HEC) - Since Telegraf v1.8
• Splunk TCP inputs in Graphite format with tags support and the TA for Telegraf
• Apache Kafka topic in Graphite format with tags support and the TA for Telegraf and Splunk connect for Kafka
Who watches for the watcher?
As you are running a Kafka deployment, it would seem very logical to produce metrics in a Kafka topic. However, it
presents a specific concern for Kafka itself.
If you use this same system for monitoring Kafka itself, it is very likely that you will never know when Kafka is broken
because the data flow for your monitoring system will be broken as well.
The recommendation is to rely either on Splunk HEC or TCP inputs to forward Telegraf metrics data for the Kafka
monitoring.
A minimal configuration for telegraf.conf, running in container or as a regular process in machine and for-
warding to HEC:
2.2. Implementation & data collection 11DA-ITSI-TELEGRAF-KAFKA Documentation, Release 1
[global_tags]
# the env tag is used by the application for multi-environments management
env = "my_env"
# the label tag is an optional tag used by the application that you can use as
˓→additional label for the services or infrastructure
label = "my_env_label"
[agent]
interval = "10s"
flush_interval = "10s"
hostname = "$HOSTNAME"
# outputs
[[outputs.http]]
url = "https://splunk:8088/services/collector"
insecure_skip_verify = true
data_format = "splunkmetric"
## Provides time, index, source overrides for the HEC
splunkmetric_hec_routing = true
## Additional HTTP headers
[outputs.http.headers]
# Should be set manually to "application/json" for json data_format
Content-Type = "application/json"
Authorization = "Splunk 205d43f1-2a31-4e60-a8b3-327eda49944a"
X-Splunk-Request-Channel = "205d43f1-2a31-4e60-a8b3-327eda49944a"
If for some reasons, you have to use either of the 2 other solutions, please consult:
• https://da-itsi-telegraf-os.readthedocs.io/en/latest/telegraf.html
2.2.4 Jolokia JVM monitoring
The following Kafka components require Jolokia to be deployed and started, as the modern and efficient inter-
face to JMX that is collected by Telegraf:
• Apache Kafka Brokers
• Apache Kafka Connect
• Confluent schema-registry
• Confluent ksql-server
• Confluent kafka-rest
For the complete documentation of Jolokia, see:
• https://jolokia.org
Jolokia JVM agent can be started in 2 ways, either as using the -javaagent argument during the start of the
JVM, or on the fly by attaching Jolokia to the PID ot the JVM:
• https://jolokia.org/reference/html/agents.html#agents-jvm
12 Chapter 2. Deployment and configuration:DA-ITSI-TELEGRAF-KAFKA Documentation, Release 1
2.2.5 Starting Jolokia with the JVM
To start Jolokia agent using the -javaagent argument, use such option at the start of the JVM:
-javaagent:/opt/jolokia/jolokia.jar=port=8778,host=0.0.0.0
Note: This method is the method used in the docker example within this documentation by using the environment
variables of the container.
When running on dedicated servers or virtual machines, update the relevant systemd configuration file to start
Jolokia automatically:
For Kafka brokers
For bare-metals and dedicated VMs:
• Edit: /lib/systemd/system/confluent-kafka.service
• Add -javaagent argument:
[Unit]
Description=Apache Kafka - broker
Documentation=http://docs.confluent.io/
After=network.target confluent-zookeeper.target
[Service]
Type=simple
User=cp-kafka
Group=confluent
ExecStart=/usr/bin/kafka-server-start /etc/kafka/server.properties
Environment="KAFKA_OPTS=-javaagent:/opt/jolokia/jolokia.jar=port=8778,host=0.0.0.0"
TimeoutStopSec=180
Restart=no
[Install]
WantedBy=multi-user.target
• Reload systemd and restart:
sudo systemctl daemon-restart
sudo systemctl restart confluent-kafka
For container based environments:
Define the following environment variable when starting the containers:
KAFKA_OPTS: "-javaagent:/opt/jolokia/jolokia.jar=port=8778,host=0.0.0.0"
For Kafka Connect
For bare-metals and dedicated VMs:
• Edit: /lib/systemd/system/confluent-kafka-connect.service
• Add -javaagent argument:
2.2. Implementation & data collection 13DA-ITSI-TELEGRAF-KAFKA Documentation, Release 1
[Unit]
Description=Apache Kafka Connect - distributed
Documentation=http://docs.confluent.io/
After=network.target confluent-kafka.target
[Service]
Type=simple
User=cp-kafka-connect
Group=confluent
ExecStart=/usr/bin/connect-distributed /etc/kafka/connect-distributed.properties
Environment="KAFKA_OPTS=-javaagent:/opt/jolokia/jolokia.jar=port=8778,host=0.0.0.0"
Environment="LOG_DIR=/var/log/connect"
TimeoutStopSec=180
Restart=no
[Install]
WantedBy=multi-user.target
• Reload systemd and restart:
sudo systemctl daemon-restart
sudo systemctl restart confluent-kafka-connect
For container based environments:
Define the following environment variable when starting the containers:
KAFKA_OPTS: "-javaagent:/opt/jolokia/jolokia.jar=port=8778,host=0.0.0.0"
For Confluent schema-registry
For bare-metals and dedicated VMs:
• Edit: /lib/systemd/system/confluent-schema-registry.service
• Add -javaagent argument:
[Unit]
Description=RESTful Avro schema registry for Apache Kafka
Documentation=http://docs.confluent.io/
After=network.target confluent-kafka.target
[Service]
Type=simple
User=cp-schema-registry
Group=confluent
Environment="LOG_DIR=/var/log/confluent/schema-registry"
Environment="SCHEMA_REGISTRY_OPTS=-javaagent:/opt/jolokia/jolokia.jar=port=8778,
˓→host=0.0.0.0"
ExecStart=/usr/bin/schema-registry-start /etc/schema-registry/schema-registry.
˓→properties
TimeoutStopSec=180
Restart=no
[Install]
WantedBy=multi-user.target
• Reload systemd and restart:
14 Chapter 2. Deployment and configuration:DA-ITSI-TELEGRAF-KAFKA Documentation, Release 1
sudo systemctl daemon-restart
sudo systemctl restart confluent-schema-registry
For container based environments:
Define the following environment variable when starting the containers:
SCHEMA_REGISTRY_OPTS: "-javaagent:/opt/jolokia/jolokia.jar=port=8778,host=0.0.0.0"
For Confluent ksql-server
For bare-metals and dedicated VMs:
• Edit: /lib/systemd/system/confluent-ksql.service
• Add -javaagent argument:
[Unit]
Description=Streaming SQL engine for Apache Kafka
Documentation=http://docs.confluent.io/
After=network.target confluent-kafka.target confluent-schema-registry.target
[Service]
Type=simple
User=cp-ksql
Group=confluent
Environment="LOG_DIR=/var/log/confluent/ksql"
Environment="KSQL_OPTS=-javaagent:/opt/jolokia/jolokia.jar=port=8778,host=0.0.0.0"
ExecStart=/usr/bin/ksql-server-start /etc/ksql/ksql-server.properties
TimeoutStopSec=180
Restart=no
[Install]
WantedBy=multi-user.target
• Reload systemd and restart:
sudo systemctl daemon-restart
sudo systemctl restart confluent-ksql
For container based environments:
Define the following environment variable when starting the containers:
KSQL_OPTS: "-javaagent:/opt/jolokia/jolokia.jar=port=8778,host=0.0.0.0"
For Confluent kafka-rest
For bare-metals and dedicated VMs:
• Edit: /lib/systemd/system/confluent-kafka-rest.service
• Add -javaagent argument:
2.2. Implementation & data collection 15DA-ITSI-TELEGRAF-KAFKA Documentation, Release 1
[Unit]
Description=A REST proxy for Apache Kafka
Documentation=http://docs.confluent.io/
After=network.target confluent-kafka.target
[Service]
Type=simple
User=cp-kafka-rest
Group=confluent
Environment="LOG_DIR=/var/log/confluent/kafka-rest"
Environment="KAFKAREST_OPTS=-javaagent:/opt/jolokia/jolokia.jar=port=8778,host=0.0.0.0
˓→"
ExecStart=/usr/bin/kafka-rest-start /etc/kafka-rest/kafka-rest.properties
TimeoutStopSec=180
Restart=no
[Install]
WantedBy=multi-user.target
• Reload systemd and restart:
sudo systemctl daemon-restart
sudo systemctl restart confluent-kafka-rest
For container based environments:
Define the following environment variable when starting the containers:
KAFKAREST_OPTS: "-javaagent:/opt/jolokia/jolokia.jar=port=8778,host=0.0.0.0"
Notes: “KAFKAREST_OPTS” is not a typo, this is the real name of the environment variable for some reason.
2.2.6 Starting Jolokia on the fly
To attach Jolokia agent to an existing JVM, identify its process ID (PID), simplistic example:
ps -ef | grep 'kafka.properties' | grep -v grep | awk '{print $1}'
Then:
java -jar /opt/jolokia/jolokia.jar --host 0.0.0.0 --port 8778 start
Add this operation to any custom init scripts you use to start the Kafka components.
2.2.7 Zookeeper monitoring
Collecting with Telegraf
The Zookeeper monitoring is very simple and achieved by Telegraf and the Zookeeper input plugin.
The following configuration stands in telegraf.conf and configures the input plugin to monitor multiple
Zookeeper servers from one source:
16 Chapter 2. Deployment and configuration:DA-ITSI-TELEGRAF-KAFKA Documentation, Release 1
# zookeeper metrics
[[inputs.zookeeper]]
servers = ["zookeeper-1:12181","zookeeper-2:22181","zookeeper-3:32181"]
If each server runs an instance of Zookeeper and you deploy Telegraf, you can simply collect from the localhost:
# zookeeper metrics
[[inputs.zookeeper]]
servers = ["$HOSTNAME:2181"]
Full telegraf.conf example
The following telegraf.conf collects a cluster of 3 Zookeeper servers:
[global_tags]
# the env tag is used by the application for multi-environments management
env = "my_env"
# the label tag is an optional tag used by the application that you can use as
˓→additional label for the services or infrastructure
label = "my_env_label"
[agent]
interval = "10s"
flush_interval = "10s"
hostname = "$HOSTNAME"
# outputs
[[outputs.http]]
url = "https://splunk:8088/services/collector"
insecure_skip_verify = true
data_format = "splunkmetric"
## Provides time, index, source overrides for the HEC
splunkmetric_hec_routing = true
## Additional HTTP headers
[outputs.http.headers]
# Should be set manually to "application/json" for json data_format
Content-Type = "application/json"
Authorization = "Splunk 205d43f1-2a31-4e60-a8b3-327eda49944a"
X-Splunk-Request-Channel = "205d43f1-2a31-4e60-a8b3-327eda49944a"
# zookeeper metrics
[[inputs.zookeeper]]
servers = ["zookeeper-1:12181","zookeeper-2:22181","zookeeper-3:32181"]
Visualization of metrics within the Splunk metrics workspace application:
2.2. Implementation & data collection 17DA-ITSI-TELEGRAF-KAFKA Documentation, Release 1
Using mcatalog search command to verify data availability:
| mcatalog values(metric_name) values(_dims) where index=* metric_name=zookeeper.*
2.2.8 Kafka brokers monitoring with Jolokia
Collecting with Telegraf
Depending on how you run Kafka and your architecture preferences, you may prefer to collect all the brokers metrics
from one Telegraf collector, or installed locally on the Kafka brocker machine.
Connecting to multiple remote Jolokia instances:
# Kafka JVM monitoring
[[inputs.jolokia2_agent]]
name_prefix = "kafka_"
urls = ["http://kafka-1:18778/jolokia","http://kafka-2:28778/jolokia","http://kafka-
˓→3:38778/jolokia"]
Connecting to the local Jolokia instance:
# Kafka JVM monitoring
[[inputs.jolokia2_agent]]
name_prefix = "kafka_"
urls = ["http://$HOSTNAME:8778/jolokia"]
Full telegraf.conf example
The following telegraf.conf collects a cluster of 3 Kafka brokers:
[global_tags]
# the env tag is used by the application for multi-environments management
env = "my_env"
# the label tag is an optional tag used by the application that you can use as
˓→additional label for the services or infrastructure
label = "my_env_label"
[agent]
(continues on next page)
18 Chapter 2. Deployment and configuration:DA-ITSI-TELEGRAF-KAFKA Documentation, Release 1
(continued from previous page)
interval = "10s"
flush_interval = "10s"
hostname = "$HOSTNAME"
# outputs
[[outputs.http]]
url = "https://splunk:8088/services/collector"
insecure_skip_verify = true
data_format = "splunkmetric"
## Provides time, index, source overrides for the HEC
splunkmetric_hec_routing = true
## Additional HTTP headers
[outputs.http.headers]
# Should be set manually to "application/json" for json data_format
Content-Type = "application/json"
Authorization = "Splunk 205d43f1-2a31-4e60-a8b3-327eda49944a"
X-Splunk-Request-Channel = "205d43f1-2a31-4e60-a8b3-327eda49944a"
# Kafka JVM monitoring
[[inputs.jolokia2_agent]]
name_prefix = "kafka_"
urls = ["http://kafka-1:18778/jolokia","http://kafka-2:28778/jolokia","http://kafka-
˓→3:38778/jolokia"]
[[inputs.jolokia2_agent.metric]]
name = "controller"
mbean = "kafka.controller:name=*,type=*"
field_prefix = "$1."
[[inputs.jolokia2_agent.metric]]
name = "replica_manager"
mbean = "kafka.server:name=*,type=ReplicaManager"
field_prefix = "$1."
[[inputs.jolokia2_agent.metric]]
name = "purgatory"
mbean = "kafka.server:delayedOperation=*,name=*,
˓→type=DelayedOperationPurgatory"
field_prefix = "$1."
field_name = "$2"
[[inputs.jolokia2_agent.metric]]
name = "client"
mbean = "kafka.server:client-id=*,type=*"
tag_keys = ["client-id", "type"]
[[inputs.jolokia2_agent.metric]]
name = "network"
mbean = "kafka.network:name=*,request=*,type=RequestMetrics"
field_prefix = "$1."
tag_keys = ["request"]
[[inputs.jolokia2_agent.metric]]
name = "network"
mbean = "kafka.network:name=ResponseQueueSize,type=RequestChannel"
field_prefix = "ResponseQueueSize"
(continues on next page)
2.2. Implementation & data collection 19DA-ITSI-TELEGRAF-KAFKA Documentation, Release 1
(continued from previous page)
tag_keys = ["name"]
[[inputs.jolokia2_agent.metric]]
name = "network"
mbean = "kafka.network:name=NetworkProcessorAvgIdlePercent,type=SocketServer"
field_prefix = "NetworkProcessorAvgIdlePercent"
tag_keys = ["name"]
[[inputs.jolokia2_agent.metric]]
name = "topics"
mbean = "kafka.server:name=*,type=BrokerTopicMetrics"
field_prefix = "$1."
[[inputs.jolokia2_agent.metric]]
name = "topic"
mbean = "kafka.server:name=*,topic=*,type=BrokerTopicMetrics"
field_prefix = "$1."
tag_keys = ["topic"]
[[inputs.jolokia2_agent.metric]]
name = "partition"
mbean = "kafka.log:name=*,partition=*,topic=*,type=Log"
field_name = "$1"
tag_keys = ["topic", "partition"]
[[inputs.jolokia2_agent.metric]]
name = "log"
mbean = "kafka.log:name=LogFlushRateAndTimeMs,type=LogFlushStats"
field_name = "LogFlushRateAndTimeMs"
tag_keys = ["name"]
[[inputs.jolokia2_agent.metric]]
name = "partition"
mbean = "kafka.cluster:name=UnderReplicated,partition=*,topic=*,type=Partition"
field_name = "UnderReplicatedPartitions"
tag_keys = ["topic", "partition"]
[[inputs.jolokia2_agent.metric]]
name = "request_handlers"
mbean = "kafka.server:name=RequestHandlerAvgIdlePercent,
˓→type=KafkaRequestHandlerPool"
tag_keys = ["name"]
# JVM garbage collector monitoring
[[inputs.jolokia2_agent.metric]]
name = "jvm_garbage_collector"
mbean = "java.lang:name=*,type=GarbageCollector"
paths = ["CollectionTime", "CollectionCount", "LastGcInfo"]
tag_keys = ["name"]
Visualization of metrics within the Splunk metrics workspace application:
20 Chapter 2. Deployment and configuration:DA-ITSI-TELEGRAF-KAFKA Documentation, Release 1
Using mcatalog search command to verify data availability:
| mcatalog values(metric_name) values(_dims) where index=* metric_name=kafka_*.*
2.2.9 Kafka connect monitoring
Collecting with Telegraf
Connecting to multiple remote Jolokia instances:
# Kafka-connect JVM monitoring
[[inputs.jolokia2_agent]]
name_prefix = "kafka_connect."
urls = ["http://kafka-connect-1:18779/jolokia","http://kafka-connect-2:28779/jolokia
˓→","http://kafka-connect-3:38779/jolokia"]
Connecting to local Jolokia instance:
# Kafka-connect JVM monitoring
[[inputs.jolokia2_agent]]
name_prefix = "kafka_connect."
urls = ["http://$HOSTNAME:8778/jolokia"]
Full telegraf.conf example
bellow a full telegraf.conf example:
[global_tags]
# the env tag is used by the application for multi-environments management
env = "my_env"
# the label tag is an optional tag used by the application that you can use as
˓→additional label for the services or infrastructure
label = "my_env_label"
(continues on next page)
2.2. Implementation & data collection 21DA-ITSI-TELEGRAF-KAFKA Documentation, Release 1
(continued from previous page)
[agent]
interval = "10s"
flush_interval = "10s"
hostname = "$HOSTNAME"
# outputs
[[outputs.http]]
url = "https://splunk:8088/services/collector"
insecure_skip_verify = true
data_format = "splunkmetric"
## Provides time, index, source overrides for the HEC
splunkmetric_hec_routing = true
## Additional HTTP headers
[outputs.http.headers]
# Should be set manually to "application/json" for json data_format
Content-Type = "application/json"
Authorization = "Splunk 205d43f1-2a31-4e60-a8b3-327eda49944a"
X-Splunk-Request-Channel = "205d43f1-2a31-4e60-a8b3-327eda49944a"
# Kafka-connect JVM monitoring
[[inputs.jolokia2_agent]]
name_prefix = "kafka_connect."
urls = ["http://kafka-connect-1:18779/jolokia","http://kafka-connect-2:28779/jolokia
˓→","http://kafka-connect-3:38779/jolokia"]
[[inputs.jolokia2_agent.metric]]
name = "worker"
mbean = "kafka.connect:type=connect-worker-metrics"
[[inputs.jolokia2_agent.metric]]
name = "worker"
mbean = "kafka.connect:type=connect-worker-rebalance-metrics"
[[inputs.jolokia2_agent.metric]]
name = "connector-task"
mbean = "kafka.connect:type=connector-task-metrics,connector=*,task=*"
tag_keys = ["connector", "task"]
[[inputs.jolokia2_agent.metric]]
name = "sink-task"
mbean = "kafka.connect:type=sink-task-metrics,connector=*,task=*"
tag_keys = ["connector", "task"]
[[inputs.jolokia2_agent.metric]]
name = "source-task"
mbean = "kafka.connect:type=source-task-metrics,connector=*,task=*"
tag_keys = ["connector", "task"]
[[inputs.jolokia2_agent.metric]]
name = "error-task"
mbean = "kafka.connect:type=task-error-metrics,connector=*,task=*"
tag_keys = ["connector", "task"]
# Kafka connect return a status value which is non numerical
# Using the enum processor with the following configuration replaces the string value
˓→by our mapping (continues on next page)
22 Chapter 2. Deployment and configuration:DA-ITSI-TELEGRAF-KAFKA Documentation, Release 1
(continued from previous page)
[[processors.enum]]
[[processors.enum.mapping]]
## Name of the field to map
field = "status"
## Table of mappings
[processors.enum.mapping.value_mappings]
paused = 0
running = 1
unassigned = 2
failed = 3
destroyed = 4
Visualization of metrics within the Splunk metrics workspace application:
Using mcatalog search command to verify data availability:
| mcatalog values(metric_name) values(_dims) where index=* metric_name=kafka_connect.*
2.2.10 Kafka LinkedIn monitor - end to end monitoring
Installing and starting the Kafka monitor
LinkedIn provides an extremely powerful open source end to end monitoring solution for Kafka, please consult:
• https://github.com/linkedin/kafka-monitor
As a builtin configuration, the kafka-monitor implements a jolokia agent, so collecting the metrics with Telegraf cannot
be more easy !
It is very straightforward to run the kafka-monitor in a docker container, first you need to create your own
image:
• https://github.com/linkedin/kafka-monitor/tree/master/docker
In a nutshell, you would:
2.2. Implementation & data collection 23DA-ITSI-TELEGRAF-KAFKA Documentation, Release 1
git clone https://github.com/linkedin/kafka-monitor.git
cd kafka-monitor
./gradlew jar
cd docker
Edit the Makefile to match your needs
make container
make push
Then start your container, example with docker-compose:
kafka-monitor:
image: guilhemmarchand/kafka-monitor:2.0.3
hostname: kafka-monitor
volumes:
- ../kafka-monitor:/usr/local/share/kafka-monitor
command: "/opt/kafka-monitor/bin/kafka-monitor-start.sh /usr/local/share/kafka-
˓→monitor/kafka-monitor.properties"
Once your Kafka monitor is running, you need a Telegraf instance that will be collecting the JMX beans,
example:
[global_tags]
# the env tag is used by the application for multi-environments management
env = "my_env"
# the label tag is an optional tag used by the application that you can use as
˓→additional label for the services or infrastructure
label = "my_env_label"
[agent]
interval = "10s"
flush_interval = "10s"
hostname = "$HOSTNAME"
# outputs
[[outputs.http]]
url = "https://splunk:8088/services/collector"
insecure_skip_verify = true
data_format = "splunkmetric"
## Provides time, index, source overrides for the HEC
splunkmetric_hec_routing = true
## Additional HTTP headers
[outputs.http.headers]
# Should be set manually to "application/json" for json data_format
Content-Type = "application/json"
Authorization = "Splunk 205d43f1-2a31-4e60-a8b3-327eda49944a"
X-Splunk-Request-Channel = "205d43f1-2a31-4e60-a8b3-327eda49944a"
# Kafka JVM monitoring
[[inputs.jolokia2_agent]]
name_prefix = "kafka_"
urls = ["http://kafka-monitor:8778/jolokia"]
[[inputs.jolokia2_agent.metric]]
name = "kafka-monitor"
mbean = "kmf.services:name=*,type=*"
24 Chapter 2. Deployment and configuration:DA-ITSI-TELEGRAF-KAFKA Documentation, Release 1
Visualization of metrics within the Splunk metrics workspace application:
Using mcatalog search command to verify data availability:
| mcatalog values(metric_name) values(_dims) where index=* metric_name=kafka_kafka-
˓→monitor.*
2.2.11 Confluent schema-registry
Collecting with Telegraf
Connecting to multiple remote Jolokia instances:
[[inputs.jolokia2_agent]]
name_prefix = "kafka_schema-registry."
urls = ["http://schema-registry:18783/jolokia"]
Connecting to local Jolokia instance:
# Kafka-connect JVM monitoring
[[inputs.jolokia2_agent]]
name_prefix = "kafka_schema-registry."
urls = ["http://$HOSTNAME:8778/jolokia"]
Full telegraf.conf example
bellow a full telegraf.conf example:
[global_tags]
# the env tag is used by the application for multi-environments management
env = "my_env"
# the label tag is an optional tag used by the application that you can use as
˓→additional label for the services or infrastructure
(continues on next page)
2.2. Implementation & data collection 25DA-ITSI-TELEGRAF-KAFKA Documentation, Release 1
(continued from previous page)
label = "my_env_label"
[agent]
interval = "10s"
flush_interval = "10s"
hostname = "$HOSTNAME"
# outputs
[[outputs.http]]
url = "https://splunk:8088/services/collector"
insecure_skip_verify = true
data_format = "splunkmetric"
## Provides time, index, source overrides for the HEC
splunkmetric_hec_routing = true
## Additional HTTP headers
[outputs.http.headers]
# Should be set manually to "application/json" for json data_format
Content-Type = "application/json"
Authorization = "Splunk 205d43f1-2a31-4e60-a8b3-327eda49944a"
X-Splunk-Request-Channel = "205d43f1-2a31-4e60-a8b3-327eda49944a"
# schema-registry JVM monitoring
[[inputs.jolokia2_agent]]
name_prefix = "kafka_schema-registry."
urls = ["http://schema-registry:18783/jolokia"]
[[inputs.jolokia2_agent.metric]]
name = "jetty-metrics"
mbean = "kafka.schema.registry:type=jetty-metrics"
paths = ["connections-active", "connections-opened-rate", "connections-closed-rate"]
[[inputs.jolokia2_agent.metric]]
name = "master-slave-role"
mbean = "kafka.schema.registry:type=master-slave-role"
[[inputs.jolokia2_agent.metric]]
name = "jersey-metrics"
mbean = "kafka.schema.registry:type=jersey-metrics"
Visualization of metrics within the Splunk metrics workspace application:
26 Chapter 2. Deployment and configuration:DA-ITSI-TELEGRAF-KAFKA Documentation, Release 1
Using mcatalog search command to verify data availability:
| mcatalog values(metric_name) values(_dims) where index=* metric_name=kafka_schema-
˓→registry.*
2.2.12 Confluent ksql-server
Collecting with Telegraf
Connecting to multiple remote Jolokia instances:
[[inputs.jolokia2_agent]]
name_prefix = "kafka_"
urls = ["http://ksql-server-1:18784/jolokia"]
Connecting to local Jolokia instance:
[[inputs.jolokia2_agent]]
name_prefix = "kafka_"
urls = ["http://$HOSTNAME:18784/jolokia"]
Full telegraf.conf example
bellow a full telegraf.conf example:
[global_tags]
# the env tag is used by the application for multi-environments management
env = "my_env"
# the label tag is an optional tag used by the application that you can use as
˓→additional label for the services or infrastructure
label = "my_env_label"
[agent]
interval = "10s"
(continues on next page)
2.2. Implementation & data collection 27DA-ITSI-TELEGRAF-KAFKA Documentation, Release 1
(continued from previous page)
flush_interval = "10s"
hostname = "$HOSTNAME"
# outputs
[[outputs.http]]
url = "https://splunk:8088/services/collector"
insecure_skip_verify = true
data_format = "splunkmetric"
## Provides time, index, source overrides for the HEC
splunkmetric_hec_routing = true
## Additional HTTP headers
[outputs.http.headers]
# Should be set manually to "application/json" for json data_format
Content-Type = "application/json"
Authorization = "Splunk 205d43f1-2a31-4e60-a8b3-327eda49944a"
X-Splunk-Request-Channel = "205d43f1-2a31-4e60-a8b3-327eda49944a"
# ksql-server JVM monitoring
[[inputs.jolokia2_agent]]
name_prefix = "kafka_"
urls = ["http://ksql-server:18784/jolokia"]
[[inputs.jolokia2_agent.metric]]
name = "ksql-server"
mbean = "io.confluent.ksql.metrics:type=*"
Visualization of metrics within the Splunk metrics workspace application:
Using mcatalog search command to verify data availability:
| mcatalog values(metric_name) values(_dims) where index=* metric_name=kafka_ksql-
˓→server.*
28 Chapter 2. Deployment and configuration:DA-ITSI-TELEGRAF-KAFKA Documentation, Release 1
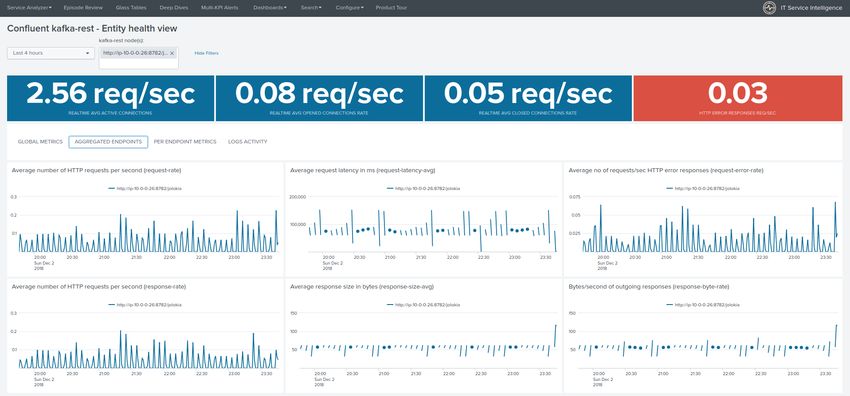
2.2.13 Confluent kafka-rest
Collecting with Telegraf
Connecting to multiple remote Jolokia instances:
[[inputs.jolokia2_agent]]
name_prefix = "kafka_kafka-rest."
urls = ["http://kafka-rest:8778/jolokia"]
Connecting to local Jolokia instance:
[[inputs.jolokia2_agent]]
name_prefix = "kafka_kafka-rest."
urls = ["http://$HOSTNAME:18785/jolokia"]
Full telegraf.conf example
bellow a full telegraf.conf example:
[global_tags]
# the env tag is used by the application for multi-environments management
env = "my_env"
# the label tag is an optional tag used by the application that you can use as
˓→additional label for the services or infrastructure
label = "my_env_label"
[agent]
interval = "10s"
flush_interval = "10s"
hostname = "$HOSTNAME"
# outputs
[[outputs.http]]
url = "https://splunk:8088/services/collector"
insecure_skip_verify = true
data_format = "splunkmetric"
## Provides time, index, source overrides for the HEC
splunkmetric_hec_routing = true
## Additional HTTP headers
[outputs.http.headers]
# Should be set manually to "application/json" for json data_format
Content-Type = "application/json"
Authorization = "Splunk 205d43f1-2a31-4e60-a8b3-327eda49944a"
X-Splunk-Request-Channel = "205d43f1-2a31-4e60-a8b3-327eda49944a"
# kafka-rest JVM monitoring
[[inputs.jolokia2_agent]]
name_prefix = "kafka_kafka-rest."
urls = ["http://kafka-rest:18785/jolokia"]
[[inputs.jolokia2_agent.metric]]
name = "jetty-metrics"
mbean = "kafka.rest:type=jetty-metrics"
paths = ["connections-active", "connections-opened-rate", "connections-closed-rate
˓→"]
(continues on next page)
2.2. Implementation & data collection 29DA-ITSI-TELEGRAF-KAFKA Documentation, Release 1
(continued from previous page)
[[inputs.jolokia2_agent.metric]]
name = "jersey-metrics"
mbean = "kafka.rest:type=jersey-metrics"
Visualization of metrics within the Splunk metrics workspace application:
Using mcatalog search command to verify data availability:
| mcatalog values(metric_name) values(_dims) where index=* metric_name=kafka_kafka_
˓→kafka-rest.*
2.2.14 Burrow Lag Consumers
As from their authors, Burrow is a monitoring companion for Apache Kafka that provides consumer lag check-
ing as a service without the need for specifying thresholds.
See: https://github.com/linkedin/Burrow
Burrow workflow diagram:
30 Chapter 2. Deployment and configuration:DA-ITSI-TELEGRAF-KAFKA Documentation, Release 1
Burrow is a very powerful application that monitors all consumers (Kafka Connect connectors, Kafka
Streams. . . ) to report an advanced state of the service automatically, and various useful lagging metrics.
Telegraf has a native input for Burrow which polls consumers, topics and partitions lag metrics and statuses
over http, use the following telegraf minimal configuration:
See: https://github.com/influxdata/telegraf/tree/master/plugins/inputs/burrow
[global_tags]
# the env tag is used by the application for multi-environments management
env = "my_env"
# the label tag is an optional tag used by the application that you can use as
˓→additional label for the services or infrastructure
label = "my_env_label"
[agent]
interval = "10s"
flush_interval = "10s"
hostname = "$HOSTNAME"
# outputs
[[outputs.http]]
url = "https://splunk:8088/services/collector"
insecure_skip_verify = true
data_format = "splunkmetric"
## Provides time, index, source overrides for the HEC
splunkmetric_hec_routing = true
## Additional HTTP headers
(continues on next page)
2.2. Implementation & data collection 31DA-ITSI-TELEGRAF-KAFKA Documentation, Release 1
(continued from previous page)
[outputs.http.headers]
# Should be set manually to "application/json" for json data_format
Content-Type = "application/json"
Authorization = "Splunk 205d43f1-2a31-4e60-a8b3-327eda49944a"
X-Splunk-Request-Channel = "205d43f1-2a31-4e60-a8b3-327eda49944a"
# Burrow
[[inputs.burrow]]
## Burrow API endpoints in format "schema://host:port".
## Default is "http://localhost:8000".
servers = ["http://dockerhost:9001"]
## Override Burrow API prefix.
## Useful when Burrow is behind reverse-proxy.
# api_prefix = "/v3/kafka"
## Maximum time to receive response.
# response_timeout = "5s"
## Limit per-server concurrent connections.
## Useful in case of large number of topics or consumer groups.
# concurrent_connections = 20
## Filter clusters, default is no filtering.
## Values can be specified as glob patterns.
# clusters_include = []
# clusters_exclude = []
## Filter consumer groups, default is no filtering.
## Values can be specified as glob patterns.
# groups_include = []
# groups_exclude = []
## Filter topics, default is no filtering.
## Values can be specified as glob patterns.
# topics_include = []
# topics_exclude = []
## Credentials for basic HTTP authentication.
# username = ""
# password = ""
## Optional SSL config
# ssl_ca = "/etc/telegraf/ca.pem"
# ssl_cert = "/etc/telegraf/cert.pem"
# ssl_key = "/etc/telegraf/key.pem"
# insecure_skip_verify = false
Visualization of metrics within the Splunk metrics workspace application:
32 Chapter 2. Deployment and configuration:DA-ITSI-TELEGRAF-KAFKA Documentation, Release 1 Using mcatalog search command to verify data availability: | mcatalog values(metric_name) values(_dims) where index=* metric_name=burrow_* 2.2.15 Operating System level metrics Monitoring the Operating System level metrics is fully part of the monitoring requirements of a Kafka infras- tructure. Bare metal servers and virtual machines ITSI module for Telegraf Operating System Telegraf has very powerful Operating System level metrics capabilities, checkout the ITSI module for Telegraf Operating System monitoring ! https://da-itsi-telegraf-os.readthedocs.io 2.2. Implementation & data collection 33
DA-ITSI-TELEGRAF-KAFKA Documentation, Release 1

ITSI module for metricator Nmon

Another very powerful way of monitoring Operating System level metrics with a builtin ITSI module and the
excellent nmon monitoring:
https://www.octamis.com/metricator-docs/itsi_module.html

ITSI module for OS

Last option is using the builtin ITSI module for OS which relies on the TA-nix or TA-Windows:
http://docs.splunk.com/Documentation/ITSI/latest/IModules/AbouttheOperatingSystemModule

Containers with Docker and container orchestrators

34                                                           Chapter 2. Deployment and configuration:
DA-ITSI-TELEGRAF-KAFKA Documentation, Release 1

Telegraf docker monitoring

Telegraf has very powerful inputs for Docker and is natively compatible with a container orchestrator such as Kuber-
netes.
Specially with Kubernetes, it is very easy to run a Telegraf container as a daemonset in Kubernetes and retrieve all the
performance metrics of the containers.

2.3 Docker testing templates

Docker compose templates are provided in the following repository:
https://github.com/guilhemmarchand/kafka-docker-splunk
Using the docker templates allows you to create a full pre-configured Kafka environment with docker, just in
30 seconds.
Integration with Kubernetes is documented here:
https://splunk-guide-for-kafka-monitoring.readthedocs.io
Example:
    • 3 x nodes Zookeeper cluster
    • 3 x nodes Apache Kafka brokers cluster
    • 3 x nodes Apache Kafka connect cluster
    • 1 x node Confluent schema-registry
    • 1 x Splunk standalone server running in docker
    • 1 x LinkedIn Kafka monitor node
    • 1 x Telegraf collector container to collect metrics from Zookeeper, Kafka brokers
    • 1 x Telegraf collector container to collect metrics from Kafka Connect (including source and sink tasks)
    • 1 x Telegraf collector container to collect metrics from LinkedIn Kafka monitor

2.3. Docker testing templates                                                                                        35
DA-ITSI-TELEGRAF-KAFKA Documentation, Release 1 Start the template, have a very short coffee (approx. 30 sec), open Splunk, install the Metrics workspace app and observe the magic happening ! 36 Chapter 2. Deployment and configuration:
DA-ITSI-TELEGRAF-KAFKA Documentation, Release 1

2.4 Entities discovery

The ITSI entities discovery is a fully automated process that will discover and properly configure your entities
in ITSI depending on the data availability in Splunk.
All report rely on extremely fast and optimized queries with mcatalog, which has a negligible processing cost
for the Splunk infrastructure.

2.4.1 Entities automatic import

In a nutshell, the following reports are automatically scheduled:

 Purpose                        Report
 Zookeeper servers detection    DA-ITSI-TELEGRAF-KAFKA-Inventory_Search_zookeeper
 Kafka brokers detection        DA-ITSI-TELEGRAF-KAFKA-Inventory_Search_kafka_brokers
 Kafka topics detection         DA-ITSI-TELEGRAF-KAFKA-Inventory_Search_kafka_topics
 Kafka connect detection        DA-ITSI-TELEGRAF-KAFKA-Inventory_Search_kafka_connect
 Kafka connect tasks detec-     DA-ITSI-TELEGRAF-KAFKA-Inventory_Search_kafka_connect_tasks
 tion
 Kafka monitors detection       DA-ITSI-TELEGRAF-KAFKA-Inventory_Search_linkedin_kafka_monitors
 Kafka Consumers detection      DA-ITSI-TELEGRAF-KAFKA-Inventory_Search_kafka_burrow_group_consumers
 Confluent schema-registry      DA-ITSI-TELEGRAF-KAFKA-Inventory_Search_kafka_schema-registry
 Confluent ksql-server          DA-ITSI-TELEGRAF-KAFKA-Inventory_Search_kafka-ksql-server
 Confluent kafka-rest           DA-ITSI-TELEGRAF-KAFKA-Inventory_Search_kafka-kafka-rest

When entities are discovered, entities will be added automatically using the itsi_role information field, in addi-
tion with several other info fields depending on the components.

2.4.2 Manual entities import

It is possible to manually import the entities in ITSI, and use the searches above:

2.4. Entities discovery                                                                                        37
DA-ITSI-TELEGRAF-KAFKA Documentation, Release 1

Configure / Entities / New Entity / Import from Search
Then select the module name, and depending on your needs select the relevant search.

Zookeeper server detection

Kafka brokers detection

Kafka topics detection

38                                                               Chapter 2. Deployment and configuration:
DA-ITSI-TELEGRAF-KAFKA Documentation, Release 1

Kafka connect detection

Kafka connect tasks detection

Kafka consumers detection (Burrow)

2.4. Entities discovery                                                          39
DA-ITSI-TELEGRAF-KAFKA Documentation, Release 1

Confluent schema-registry nodes detection

Confluent ksql-server nodes detection

Confluent kafka-rest nodes detection

40                                                Chapter 2. Deployment and configuration:
DA-ITSI-TELEGRAF-KAFKA Documentation, Release 1
LinkedIn Kafka monitor nodes detection
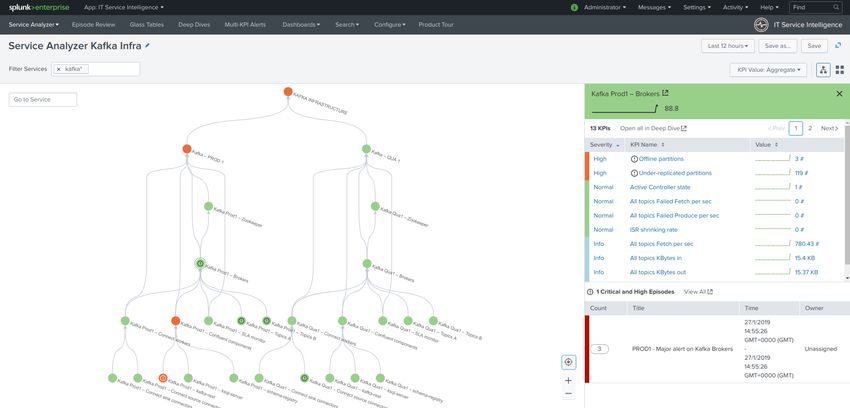
2.5 Services creation
The ITSI module for Telegraf Kafka smart monitoring provides builtin services templates, relying on several
base KPIs retrieving data from the metric store.
• Zookeeper monitoring
• Kafka brokers monitoring
• Kafka LinkedIn monitor
• Kafka topic monitoring
• Kafka connect monitoring
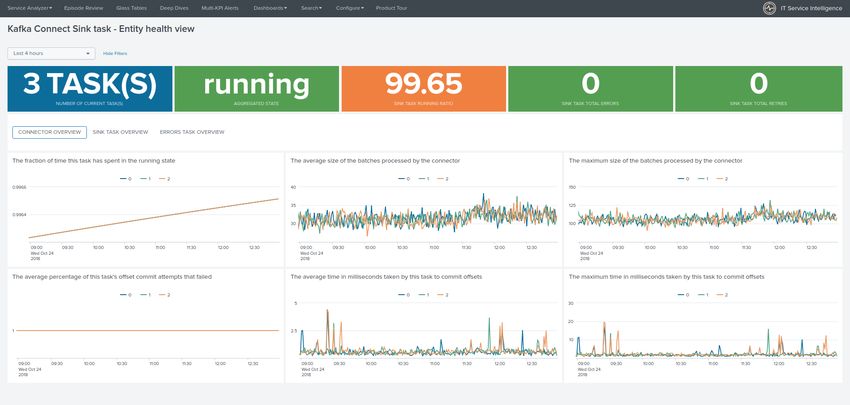
• Kafka sink task monitoring
• Kafka source task monitoring
• Kafka Consumers lag monitoring
• Confluent schema-registry monitoring
• Confluent Confluent ksql-server monitoring
• Confluent kafka-rest monitoring
As a general practice, if you first goal is designing the IT infrastructure in ITSI, a good generic recommendation is to
create a main service container for your Kafka infrastructure.
As such, every service that will be designed will be linked to the main service. (the main service depends on them)
2.5. Services creation 41DA-ITSI-TELEGRAF-KAFKA Documentation, Release 1
2.5.1 Monitoring Zookeeper servers
To monitor your Zookeeper servers, create a new service using the “Zookeeper monitoring” template service
and select the proper filters for your entities:
• Configure / Service / Create new service / Zookeeper monitoring
42 Chapter 2. Deployment and configuration:DA-ITSI-TELEGRAF-KAFKA Documentation, Release 1 2.5. Services creation 43
DA-ITSI-TELEGRAF-KAFKA Documentation, Release 1

2.5.2 Monitoring Kafka Brokers

To monitor your Zookeeper servers, create a new service using the “Kafka brokers monitoring” template service
and select the proper filters for your entities:
     • Configure / Service / Create new service / Kafka brokers monitoring

44                                                                Chapter 2. Deployment and configuration:
DA-ITSI-TELEGRAF-KAFKA Documentation, Release 1 2.5. Services creation 45
DA-ITSI-TELEGRAF-KAFKA Documentation, Release 1

2.5.3 Monitoring Kafka Topics

To monitor one or more Kafka topics, create a new service using the “Kafka topic monitoring” template service
and select the proper filters for your entities corresponding to your topics:
     • Configure / Service / Create new service / Kafka topic monitoring

46                                                                Chapter 2. Deployment and configuration:
DA-ITSI-TELEGRAF-KAFKA Documentation, Release 1 2.5. Services creation 47
DA-ITSI-TELEGRAF-KAFKA Documentation, Release 1

2.5.4 Monitoring Kafka Connect

To monitor Kafka Connect, create a new service using the “Kafka connect monitoring” template service and
select the proper filters for your entities:
     • Configure / Service / Create new service / Kafka connect monitoring

48                                                                Chapter 2. Deployment and configuration:
DA-ITSI-TELEGRAF-KAFKA Documentation, Release 1 2.5. Services creation 49
DA-ITSI-TELEGRAF-KAFKA Documentation, Release 1

2.5.5 Monitoring Kafka Connect Sink taks

To monitor one of more Kafka Connect Sink connectors, create a new service using the “Kafka sink task
monitoring” template service and select the proper filters for your entities:

50                                                       Chapter 2. Deployment and configuration:
DA-ITSI-TELEGRAF-KAFKA Documentation, Release 1

2.5. Services creation                                               51
DA-ITSI-TELEGRAF-KAFKA Documentation, Release 1

2.5.6 Monitoring Kafka Connect Source taks

To monitor one of more Kafka Connect Source connectors, create a new service using the “Kafka source task
monitoring” template service and select the proper filters for your entities:

52                                                         Chapter 2. Deployment and configuration:
You can also read