Utilization of K-nearest neighbor algorithm for classification of white blood cells in AML M4, M5, and M7
←
→
Page content transcription
If your browser does not render page correctly, please read the page content below
Open Engineering 2021; 11: 662–668
Research Article
Nurcahya Pradana Taufik Prakisya*, Febri Liantoni, Puspanda Hatta,
Yusfia Hafid Aristyagama, and Andika Setiawan
Utilization of K-nearest neighbor algorithm
for classification of white blood cells in AML M4,
M5, and M7
https://doi.org/10.1515/eng-2021-0065 Keywords: acute myeloid leukemia, classification, K-nearest
received October 30, 2020; accepted March 29, 2021 neighbor, white blood cells
Abstract: Acute myeloid leukemia (AML) M4, M5, and M7
are subtypes of leukemia derived from myeloid cell deri-
vatives that influences the results of the identification of
AMLs, which includes myeloblast, monoblast, and mega- 1 Introduction
karyoblast. Furthermore, they are divided into more
specific types, including myeloblasts, promyelocytes, Blood cancer or leukemia is a type of cancer discovered
monoblasts, promonocytes, monocytes, and megakaryoblasts, in the blood and bone marrow, which is caused by the
which must be clearly identified in order to further calcu- rapid production of abnormal white blood cells, and it is
late the ratio value in the blood. Therefore, this research one of the deadliest diseases in the world. Furthermore,
aims to classify these cell types using the K-nearest its symptoms, which are sometimes difficult to detect,
neighbor (KNN) algorithm. Three distance metrics are make it quite dangerous. Furthermore, it is caused by
tested, namely, Euclidean, Chebychev, and Minkowski, an excessive number of immature white blood cells in
and both the weighted and unweighted were tested. the human body, and the large number of immature
The features used as parameters are area, nucleus ratio, blood cells actually inhibit the functioning of organs,
circularity, perimeter, mean, and standard deviation, and which can lead to other diseases [1].
about 1,450 objects are used as training and testing data. Leukemia is of two types, depending on the rate of
In addition, to ensure that the classification is not over- growth of immature cells in the blood, acute and chronic
fitting, K-fold cross validation was conducted. The results leukemia. Both produce excess white blood cells that
show that the unweighted Minkowski distance acquired cannot properly function as antibodies. Acute leukemia
about 240 of 290 objects at K = 19, which is the best. can be recognized by the very fast multiplication of blast
Therefore, the unweighted Minkowski distance is selected cells. It can lead to death in a matter of weeks or even
for further analysis. The accuracy, recall, and precision values days unless immediately and properly treated, while
of KNN with unweighted Minkowski distance obtained from blast cells in chronic leukemia multiply slower than acute
fivefold cross validation are 80.552, 44.145, and 42.592%, leukemia [2].
respectively. Acute myeloid leukemia (AML) is one of the main
types, which is derived from the calculation of white
blood cells from the offspring of myeloid cell. Its growth
is so quick that the people with AML must get the proper
* Corresponding author: Nurcahya Pradana Taufik Prakisya,
and immediate treatment. Furthermore, AML is divided
Universitas Sebelas Maret, Faculty of Teacher Training and
Education, Jl Ir Sutami 36A, Surakarta, Jawa Tengah, Indonesia, into eight groups of diseases based on the number of
e-mail: nurcahya.ptp@staff.uns.ac.id components of the white blood cells, namely, M0, M1,
Febri Liantoni, Puspanda Hatta, Yusfia Hafid Aristyagama: M2, M3, M4, M5, M6, and M7 [3]. AML subtypes are
Informatics Education Department, Faculty of Teacher Training and described in Table 1.
Education, Universitas Sebelas Maret, Jl Ir Sutami 36A, Surakarta,
Some subtypes of AML such as M4, M5, and M7 are
Jawa Tengah, Indonesia
Andika Setiawan: Informatics Engineering, Department of Production
affected by the same type of precursor cells, and their
and Industrial Technology, Institut Teknologi Sumatera, Jl Terusan precursor cells are myeloblast, monoblast, and megakar-
Ryacudu, Way Huwi, Jati Agung, Lampung Selatan, Indonesia yoblast. They need to be precisely distinguished so that
Open Access. © 2021 Nurcahya Pradana Taufik Prakisya et al., published by De Gruyter. This work is licensed under the Creative Commons
Attribution 4.0 International License.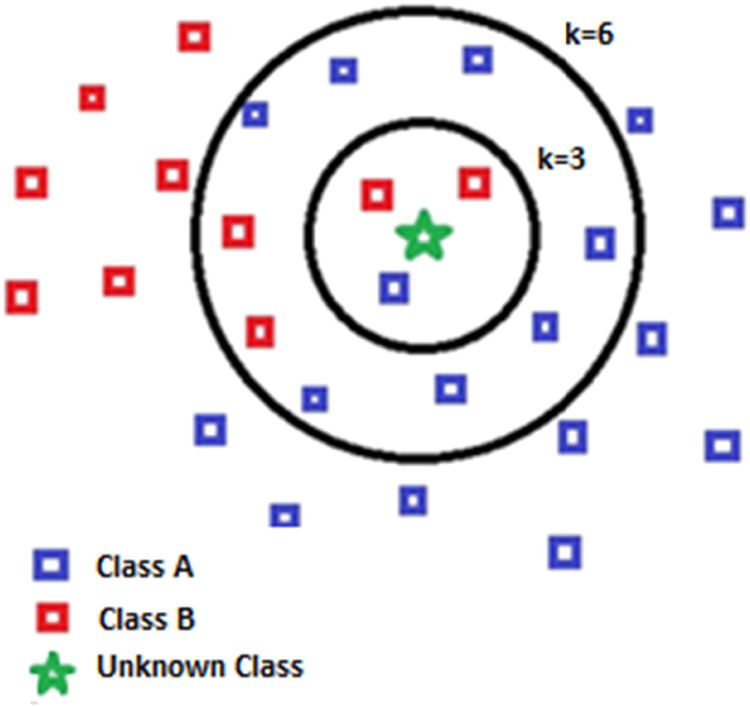
KNN utilization for classification of white blood cells in AML M4, M5 and M7 663
Table 1: Subtypes of acute myeloid leukemia • Perimeter: the outermost part of the cell object located
right next to the background image.
AML subtype Name • Roundness: a degree of curvature measurement of an
M0 Undifferentiated acute myeloblastic leukemia object that forms a circle.
M1 Acute myeloblastic leukemia with minimal • Nucleus ratio: the value obtained from the ratio of
maturation nucleus area divided by the area of the cell body.
M2 Acute myeloblastic leukemia with maturation • Mean: In this case, it is the average distribution of gray
M3 Acute promyelocytic leukemia
intensity values of each pixel in a gray scale image.
M4 Acute myelomonocytic leukemia
M5 Acute myelomonocytic leukemia with
• Standard deviation: measurement of the variation or
eosinophilia dispersion of a set of value relative to its mean. It is
M6 Acute erythroid leukemia also known as the square root of the variance.
M7 Acute megakaryoblastic leukemia
In all, 1,450 cell objects were used as training and
every cell can be counted [4]. These types of cells can testing data. Each of the data rows was then labeled
be grouped into more specific types, which are used with white blood cell for validation purpose. In addition,
as the main factor ratio for AML M4, M5, and M7. They six labels were given to the object, namely, myeloblast,
are myeloblast, promyelocyte, monoblast, promonocyte, promyelocyte, monoblast, promonocyte, monocyte, and
monocyte, and megakaryoblast. Sample images for each megakaryoblast. The detailed number of objects in each
white blood cell types are shown in Table 2. AML preparation are shown in Table 3.
Ethical approval: The use of blood smear digital image
dataset has been complied with all the relevant national
2 Research method regulations, institutional policies and in accordance the
tenets of the Helsinki Declaration, and has been approved
The research consists of several steps. It started with data by the Medical and Health Research Ethic Comitee
acquisition and ended with analyzing the results. The (MHREC) Faculty of Medicine Gadjah Mada University –
training and testing processes are carried out as the Dr. Sardjito General Hostpital.
number of folds used in cross validation. These steps
are inspired from Harjoko et al. previous research [1].
All the steps are illustrated in Figure 1.
2.2 Data training
2.1 Data acquisition 2.2.1 K-nearest neighbor
The AML M4, M5, and M7 extract features data were pro- The K-nearest neighbor or KNN is used as the proposed
vided by Setiawan et al. [4]. These were basically blood classifier. KNN is a classification algorithm based on the
smear images obtained from RSUP Sardjito Yogyakarta. distance between the object and its neighbors. Its pur-
The images were captured by using a 21-megapixel reso- pose is to classify the new object based on attributes.
lution digital camera attached to Olympus ocular lens with Furthermore, the K samples of the training data in KNN
1,000 times magnification. Furthermore, the features were is a number of nearest neighbors that are included in the
extracted to obtain the numerical data. Six features are contribution of the voting process [5]. The number K
used as inputs for this research [1,4]. depends on the case where it is applied. When the
• Cell area: the number of pixels that form an area of number K is large, the time and storage costs are higher.
white blood cell, including nucleus and cytoplasm. However, if it is small, the nearby meter will be extremely
Figure 1: Research steps.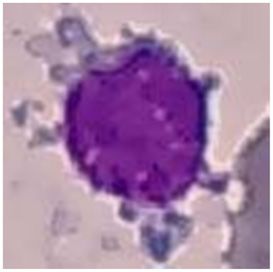
664 Nurcahya Pradana Taufik Prakisya et al.
Table 2: Sample images of AML cells
Myeloblast Promyelocyte Monoblast Promonocyte Monocyte Megakaryoblast
Source: Setiawan et al. (2018).
Table 3: Number of objects
AML subtype Myeloblast Promyelocyte Monoblast Promonocyte Megakaryoblast Monocyte
M4 195 11 83 0 0 0
M5 0 0 274 163 0 2
M7 0 0 0 0 722 0
Total 195 11 357 163 722 2
small due to the poor information [6]. It is important to
find the best value of K, and, therefore, a trial-and-con-
cept error needs to conducted [7].
The accuracy of the KNN algorithm is greatly influ-
enced by the absence or presence of irrelevant features. It
is also influenced by the weight of the feature, which is
not equivalent to its relevance for classification [8]. In the
training phase, this algorithm stores features and class
vectors of the training data. In the testing phase, the
same features are calculated for the testing data. When
new data are entered, its classification is unclear. The
distance from the new one to all the learning data vectors
is calculated, and the closest number of K is taken. The
new points are predicted to be included in the most clas-
sifications of these points [9].
Figure 2: K-nearest neighbor model sample.
The training data are projected into a multidimen-
sional space in which each dimension contains a set of
feature data. This space is divided into several sections can be calculated using certain distance metrics such as
consisting of a collection of learning data. A point in this Euclidean, Chebychev, Minkowski, etc. [10,11].
space is marked as a certain class if the class is the most
common classification in the closest K of that point. KNN
2.2.2 Euclidean distance
is modeled in Figure 2.
Figure 2 displays two classes, A and B. Therefore, two
The Euclidean distance is the most common distance
Ks, K = 3 and K = 6. In addition, a test data is located right
metric used for KNN. It is a straight line distance between
in the center of the circle. If the K used is 3, it is easy to
two data points (x , y ), where xi , yi ∈ R in N-dimensional
see that the proximity of the data is more inclined toward
vector plane [12]. The equation for Euclidean distance is
class A. However, if the K used is 6, then the test data is
represented as mentioned in equation (1).
simply recognized as class B because it has a greater
n
closeness to class B. Neighbors are usually calculated
deuclidean(xi , yi) = ∑(xi − yi)2 (1)
based on distances, and the distance between two points i=1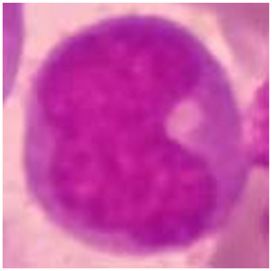
KNN utilization for classification of white blood cells in AML M4, M5 and M7 665
The distance between two points is simply calculated Where d(xi , yi) is the distance metric function. Therefore,
by finding the root of squared difference in x and y. This the formula of weighted KNN is shown as in equation (5).
formula is similar to the Pythagorean theorem formula,
∑ni = 1 w(xi , yi) ⁎ d(xi , yi)
and, therefore, it is also known as the Pythagorean. dˆ(xi , yi) = (5)
∑ni = 1 w(xi , yi)
In this research, either unweighted or weighted models
2.2.3 Chebychev distance
were applied to the three distance metrics proposed
above so that a total of six algorithms will be compared.
The Chebychev distance or chessboard distance or P ∞
metric is a distance metric defined on a vector space
where the distance between points (x , y ) where xi , yi ∈ R 2.2.6 K-fold cross validation
is the maximum absolute distance in one-dimension of
two N-dimensional points[11]. The Chebychev distance is The validation is vital in classification to ensure the model
shown in equation (2). is clean, correct, and reliable. K-fold cross validation is
dchebychev(xi , yi) ≔ max(|xi − yi |) (2) used as a validation method. Furthermore, K-fold is one
i
of the most common cross-validation methods by folding
data to a number of K and repeating (iterating) the training
2.2.4 Minkowski distance and testing process as much as K [16]. Similarly, for every
single iteration, onefold is used as the test set and the rest
The Minkowski distance is a metric in a normed vector is used as the train set. The role as the test data takes turns
space, which can be considered as a generalization of in accordance with the order of the K index [1]. Figure 3 is
both the Euclidean distance and the Manhattan distance. the example for fivefold cross validation.
It is used as the dissimilarity measurement between two Figure 3 shows a set of data, which is divided into five
vectors where x = (x1, x2,…, xn) and y = ( y1, y2,…, yn) segments or folds. In the first iteration, the first segment
where xi , yi ∈ R in the N-dimensional vector space [13]. is used as the test data, and the number of test data set is
The Minkowski distance is represented in equation (3). 1/5 * n, where n is the total number of data set. Similarly,
1/p
the other four segments are used as train set and then the
n second fold of data set is used as the test set, and the rest
dminkowski(xi , yi) = ∑ |xi − yi |p (3)
i=1 is used as the train set including the very first fold. This
iteration is conducted five times as K = 5.
The Minkowski distance is a generalized distance
metric. The formula above can be manipulated by sub-
stituting “p” to calculate the distance between two data 2.3 Data testing and validation
points in different ways. For the case of p = 2, the
Minkowski distance gives the Euclidean distance. For The data testing and validation are carried out in three
the case of p = ∞, the Minkowski distance gives the stages. The first one is dividing the data into two parts,
Chebychev distance [14].
2.2.5 Weighted KNN
Weighted KNN is a modified version of nearest neighbor
algorithm. One of the many issues that affect the perfor-
mance of the KNN algorithm is the choice of the hyper-
parameter K, which is sometimes less representative. In
order to overcome this issue, a weight variable is added to
the distance calculation formula [15]. The weight is cal-
culated by the reciprocal of the distance, as shown in
equation (4).
1
w(xi , yi) = (4)
d(xi , yi) Figure 3: K-fold cross validation.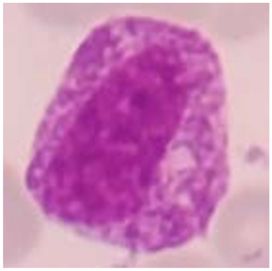
666 Nurcahya Pradana Taufik Prakisya et al.
The final stage is conducting a cross validation with
the number of fold 5, which was performed on the
unweighted Minkowski distance. Each fold contains 290
data that alternate in each iteration. This method is con-
ducted to prevent the results from overfitting.
3 Results and discussion
The experimental results show that some data can be
identified properly. Every data that has been tested,
either correctly or incorrectly predicted, was counted
and labeled as true positive (TP), true negative (TN),
false positive (FP), or false negative (FN). Furthermore,
a TP is a result where the objects correctly predict the
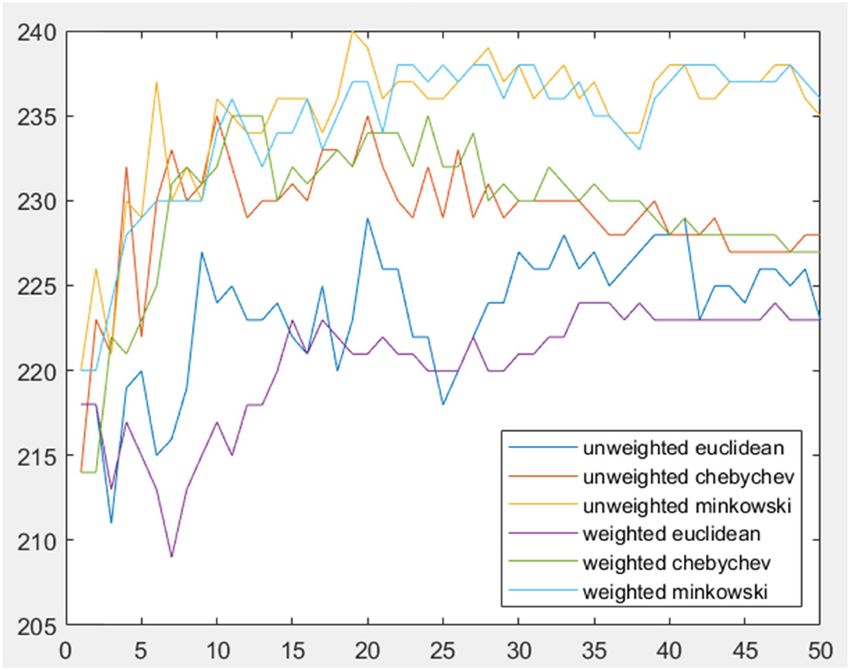
Figure 4: Line graphs of 50 K-nearest neighbor with Euclidean,
Chebychev, and Minkowski distance.
positive class. Similarly, a true negative is a result
where the model correctly predicts the negative class.
A false positive is a result where the model incorrectly
one is for training data and the rest is for testing data.
predicts the positive class, and a false negative is a
Similarly, to be proportional, out of 1,450 feature data set,
result where the model incorrectly predicts the negative
1,160 objects are considered to be the training data and
class [17].
290 objects as the testing data, and the selection of the
A confusion matrix is created to calculate the detailed
training and testing classes was randomly chosen.
accuracy, recall, and precision value from the best metric
The next stage is testing three distance metrics to find
distance, the unweighted Minkowski distance. Accuracy
out the best based on the most number of correctly
is the ability of a classification model to match the actual
predicted objects and the minimum K. Furthermore,
value of the quantity measured [18]. The equation for
each metric was tested weighted and unweighted in an
calculating the accuracy is represented in equation (6).
increasing value of K neighborhood. This increased gra-
dually starting from 0 and ending at 50. The metric with (TP + TN)
Accuracy = . (6)
the highest predicted value and the lowest K value will be (TP + TN + FP + FN)
considered as the best. Line graphs of changes in the Recall is the ability of a model to find all the relevant
number of correctly predicted objects from these metrics cases within a dataset [17]. The equation for calculating
are shown in Figure 4. recall is represented in equation (7).
Figure 4 shows six lines representing the sum of cor-
TP
rectly predicted object for every distance metric. Y-axis Recall = . (7)
represents the number of cells and X-axis represents the (TP + FN)
number of K neighborhood. Each metric has at least one Precision is the ability of a classification model to
K neighborhood value that is able to obtain the highest identify only the relevant class label [17]. The equation
number of cells. for calculating precision is shown in equation (8).
The results show that the unweighted Euclidean
TP
distance successfully identified 229 objects at K = 20 Precision = . (8)
(TP + FP)
while the weighted Euclidean distance only obtained
220 objects at K = 11. Both unweighted Chebychev dis- The prediction results from 5-fold cross validation
tance at K = 10 and weighted Chebychev distance at KNN with the unweighted Minkowski distance are shown
K = 27 correctly identified 235 objects. The unweighted in Table 4, and some mispredicted data are shown in
Minkowski distance obtained 240 objects at K = 19 while Table 4. Misclassifications occurred because the features
the weighted Minkowski distance obtained the same possessed by several cells were very similar to each other
result at K = 27. Therefore, unweighted Minkowski dis- in such a way that they have very close degrees of neigh-
tance continued to be analyzed in the third stage. borhood. Furthermore, these data were aggregated by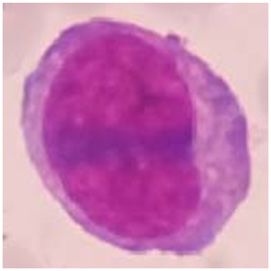
KNN utilization for classification of white blood cells in AML M4, M5 and M7 667
Table 4: Confusion matrix of KNN with unweighted Minkowski distance
Actual values
Myeloblast Promyelocyte Monoblast Promonocyte Megakaryoblast Monocyte
Predicted values Myeloblast 160 1 54 22 3 0
Promyelocyte 0 0 0 0 0 0
Monoblast 30 10 285 134 2 2
Promonocyte 2 0 13 6 0 0
Megakaryoblast 3 0 5 1 717 0
Monocyte 0 0 0 0 0 0
Table 5: Recall and precision values of KNN with unweighted have similar characteristics, which make the classification
Minkowski distance process more difficult. The unweighted Minkowski dis-
tance’s accuracy is the highest among others, with a value
Blood cells Recall (%) Precision (%) of 80.552%. However, the moderate recall and precision
Myeloblast 82.0513 66.667 values make it less suitable for practical purpose. The
Promyelocyte 0 0 given suggestion for the future research is to consider
Monoblast 79.8319 61.5551 increasing the amount of data acquired from other sources.
Promonocyte 3.681 28.5714
It will increase the variety of objects which will consequently
Megakaryoblast 99.3075 98.7603
Monocyte 0 0
allow a better generalization to the implementations of the
Average 44.145 42.592 unweighted Minkowski distance.
Acknowledgment: Authors applied the FLAE approach
category, i.e., TPs, TNs, FPs, and FNs. These results were for the sequence of authors.
written in a confusion matrix table.
The confusion matrix is subsequently used as a basis Funding information: Authors state no funding involved.
to calculate the value of the real accuracy, recall, and
precision. Similarly, each class has the same accuracy Authors contribution: Nurcahya Pradana Taufik Prakisya
in such a way that the total accuracy for KNN with conducted the software coding and prepared the manu-
unweighted Minkowski distance is 80.552%. The average script with contributions from all co-authors. Febri Liantoni
recall and precision values obtained are 44.145% and made the conclusions. Puspanda Hatta created the model
42.592%, respectively. Table 5 shows the detailed recall code. Yusfia Hafid Aristyagama carried out the data testing
and precision values for each blood cells. and validation. Andika Setiawan was responsible for data
By inspecting the results in Table 5, it was concluded gathering and labeling.
that the KNN with unweighted Minkowski distance metric
provides optimal results for accuracy only. The value of Conflict of interest: Authors state no conflict of interest.
recall and precision are pretty average. This is because
some object classes were not identified. Data availability statement: The data that support the
findings of this study are available from Medical and
Health Research Ethic Comitee (MHREC), Faculty of Medi-
cine Gadjah Mada University – Dr. Sardjito General
4 Conclusion Hostpital but restrictions apply to the availability of
these data, which were used under license for the cur-
Comparing the classification of white blood cells gives rent study, and so are not publicly available. Data are
interesting results. Most of the 1,450 blood cell objects however available from the authors upon reasonable
were correctly identified, and the error occurred because request and with permission of Medical and Health
of the wide variety of variations in white blood cells. Even Research Ethic Comitee (MHREC), Faculty of Medicine
some cell types have not been identified, because they Gadjah Mada University – Dr. Sardjito General Hostpital.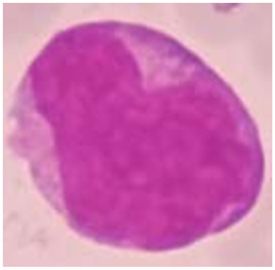
668 Nurcahya Pradana Taufik Prakisya et al.
References 9 Harijanto B, Amalia EL, Mentari M. Recognition of the character
on the map captured by the camera using K-nearest neighbor.
1 Harjoko A, Ratnaningsih T, Suryani E, Wiharto W, Palgunadi S, IOP Conference Series: Materials Science and Engineering.
Prakisya NPT. Classification of acute myeloid leukemia subtypes Vol. 732; 2020. p. 012043.
M1, M2 and M3 using active contour without edge segmentation 10 Williams J, Li Y. Comparative study of distance functions for nearest
neighbors. Advanced techniques in computing sciences and soft-
and momentum backpropagation artificial neural network.
ware engineering. Dordrecht: Springer; 2010 Jan. p. 79–84.
MATEC Web of Conferences; 2018.
11 Zaman FHK, Yassin IM, Shafie AA. Ensembles of large margin
2 Suryani E, Wiharto W, Palgunadi S, Prakisya NPT. Classification
nearest neighbour with grouped lateral patch arrangement
of acute myelogenous leukemia (AML M2 and AML M3) using
for face classification. 2016 IEEE 4th International Symposium
momentum back propagation from watershed distance trans-
on Robotics and Intelligent Sensors (IRIS); 2017 Dec. p. 6–12.
form segmented images. J Phys Conf Ser. Institute of Physics
12 Singh A, Pandey B. An Euclidean distance based KNN computa-
Publishing. 2017;801:012044.
tional method for assessing degree of liver damage. 2016
3 Suryani E, Wiharto W, Palgunadi S, Putra YR. Cells identification of
International Conference on Inventive Computation
acute myeloid leukemia AML M0 and AML M1 using K-nearest
Technologies (ICICT); 2016.
neighbour based on morphological images. 2017 International
13 Klimo M, Škvarek O, Tarabek P, Šuch O, Hrabovsky J. Nearest
Conference on Data and Software Engineering (ICoDSE); 2018 Jan.
neighbor classification in Minkowski quasi-metric space. 2018
p. 1–6.
World Symposium on Digital Intelligence for Systems and
4 Setiawan A, Harjoko A, Ratnaningsih T, Suryani E, Wiharto W,
Machines (DISA); 2018. p. 227–32.
Palgunadi S. Classification of cell types in acute myeloid leu-
14 Khaldi B, Harrou F, Cherif F, Sun Y. Improving robots swarm
kemia (AML) of M4, M5 and M7 subtypes with support vector
aggregation performance through the Minkowski distance
machine classifier. 2018 International Conference on
function. 2020 6th International Conference on Mechatronics
Information and Communications Technology (ICOIACT); 2018.
and Robotics Engineering (ICMRE); 2020. p. 87–91.
p. 45–9.
15 Fan GF, Guo YH, Zheng JM, Hong WC. Application of the weighted
5 Li G, Zhang J. Music personalized recommendation system
based on improved KNN algorithm. 2018 IEEE 3rd Advanced k-nearest neighbor algorithm for short-term load forecasting.
Information Technology, Electronic and Automation Control Energies. 2019;12(5):916.
Conference (IAEAC); 2018. p. 777–81. 16 Yadav S, Shukla S. Analysis of k-fold cross-validation over hold-
6 Vaishnnave MP, Suganya Devi K, Srinivasan P, Arutperumjothi G. out validation on colossal datasets for quality classification.
Detection and classification of groundnut leaf diseases using KNN 2016 IEEE 6th International conference on advanced computing
classifier. 2019 IEEE International Conference on System, (IACC); 2016. p. 78–83.
Computation, Automation and Networking (ICSCAN); 2019. p. 1–5. 17 Rajpurohit S, Patil S, Choudhary N, Gavasane S, Kosamkar P.
7 Zhang N, Karimoune W, Thompson L, Dang H. A between-class Identification of acute lymphoblastic leukemia in microscopic
overlapping coherence-based algorithm in KNN classification. blood image using image processing and machine learning
2017 IEEE International Conference on Systems, Man, and algorithms. 2018 International Conference on Advances in
Cybernetics (SMC); 2017 Jan. p. 572–7. Computing, Communications and Informatics (ICACCI); 2018.
8 Wisnu H, Afif M, Ruldevyani Y. Sentiment analysis on customer p. 2359–63.
satisfaction of digital payment in Indonesia: a comparative study 18 Uddhavraokatkar B, Barkade V. Prediction of isolated
using KNN and Naïve Bayes sentiment analysis on customer erythrocytes formation from compound erythrocytes in
satisfaction of digital payment in Indonesia: a comparative study blood cells images. 2017 International Conference on
using KNN and Naïve Bayes. J Phys Conf Ser. Institute of Physics Computing, Communication, Control and Automation
Publishing. 2020:1444:012034. (ICCUBEA); 2018. p. 5.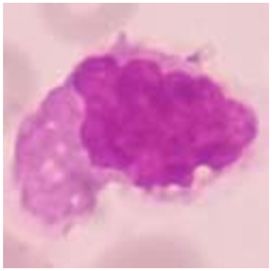
You can also read