An LSTM-Based Approach to Predict Stock Price Movement for IT Sector Companies
←
→
Page content transcription
If your browser does not render page correctly, please read the page content below
International Journal of Cognitive Informatics and Natural Intelligence
                                                                                      Volume 15 • Issue 4 • January-March 2021

An LSTM-Based Approach to Predict Stock
Price Movement for IT Sector Companies
Shruthi Komarla Rammurthy, Global Academy of Technology, Bengaluru, India
Sagar B. Patil, School of Management Studies and Research, KLE Technological University, Hubli, India
    https://orcid.org/0000-0002-3797-9449

ABSTRACT

A stock market is an aggregation of buyers and sellers where issuance, buying, and selling of stocks
happen. Predicting stock price is a significant concern due to volatility. Historic stock price and
historic price data reveal the effect of such factors. Since stock data is time series and prediction can
be made accurately with time series forecasting model. LSTM (long short-term memory) model, a
particular kind of RNN (recurrent neural network), based on time series forecasting, is used to predict
stock price. LSTM doesn’t have long-term dependencies because of its distinctive structure. The study
focuses on major IT firms considering the company’s low and high prices. But, mid-price, which
is a mean of the low and close price, is considered for the prediction. LSTM-based methodology
employing mid-price is effective in predicting values compared to other attributes and accuracy of
prediction using the LSTM model. The authors conclude with the present model is more efficient in
stock price prediction with a decrease in mean square error.

Keywords
IT Companies, LSTM, Prediction, RNN, Stock Market Returns, Time Series

1. INTRODUCTION

The stock market provides the platform for the investors to buy and sell investments avenues, especially
equities. A majority of people are looking forward to find a model that guides in stock market. The
stock market works through a series of interactions. In India, it is NSE (National Stock Exchange)
and BSE (Bombay Stock Exchange). Prediction of stock prices has gain major attention in academia
and industry as well. This attention towards prediction is majorly due to market volatility and less
awareness of the companies among investors. Most of the Machine Learning algorithms help in
analyzing stock market and predicting the prices by considering various factors. Predicting stock
prices is a complex task as it involves various factors including rational and irrational, physical and
psychological, political, market rumors, interest rates, investor mood and so on (Ghosh et al., 2019).
These factors can be handled by Artificial Intelligence which considers the past data, social sentiment
analysis and company’s net growth to predict stock prices. Deep Neural Networks and RNN can handle
multivariate time series data very well. The training is done on these networks by giving company’s
past data and predicts stock prices as output of the model.
     There are so many other models available in order to predict stock prices like regression, ARIMA,
weighted moving average, CARIMA etc. Here, authors employed LSTM along with linear regression
to predict stock prices. LSTM’s provide a promising solution for time series data. LSTM can retain

DOI: 10.4018/IJCINI.20211001.oa3                                                                               *Corresponding Author
        This article published as an Open Access article distributed under the terms of the Creative Commons Attribution License
        (http://creativecommons.org/licenses/by/4.0/) which permits unrestricted use, distribution, and production in any medium,
                       provided the author of the original work and original publication source are properly credited.

                                                                                                                                    1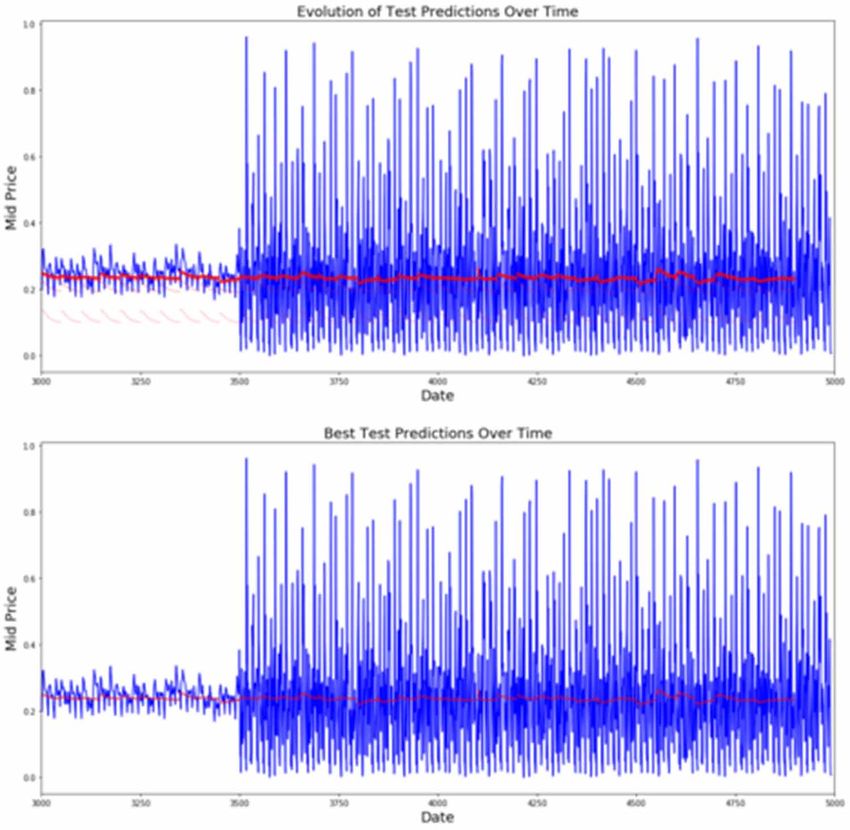
International Journal of Cognitive Informatics and Natural Intelligence
Volume 15 • Issue 4 • January-March 2021

the information for a long period of time which provides us more accurate results. Since, stock price
of a company changes time to time and even depends on other intrinsic and extrinsic factors, it is
very difficult to predict stock price. In Indian context companies enter secondary markets through
primary markets i.e., thorough IPO’s they issue their shares that are later traded on to registered stock
exchanges. Bombay Stock Exchange is one of the oldest stock exchanges of India with over 5000
companies listed. Once shares are listed in secondary market then their price is determined by market
forces like demand and supply. The price of company share moves up, if more people want to buy
the shares than selling it and vice versa. This variation in the supply and demand of company’s stock
prices depends on various factors like intrinsic and extrinsic factors. Some of the intrinsic factors are
earnings of the company, liabilities, demand stability, competition in market, technically advanced
assembly line, surplus cash for adverse situations, stakes in raw material supplier and finished product
distributors etc. Those factors that are beyond the control of the company such as crude oil price,
dollar exchange rate, political stability, government policy decision etc. refers to extrinsic attribute
(Ghosh et al., 2019).
     Stock market is a nonlinear time series data which is highly fluctuating (Ma et al., 2018). A time
series can be used to obtain status of some activity for a set of data measured for a certain time period
(Hamzaebi et al., 2009). Linear models like AR, ARMA, ARIMA (Menon et al., 2016; Zhang, 2003)
forecast the stock market using moving average and auto regression. These models when trained
work differently for different companies which is a serious concern. This makes prediction of stock
price very difficult. Many researchers have tried using the historical stock prices as the basis for time
series analysis to forecast future stock prices (Ghosh et al., 2019). In this paper, various attributes of
a company are compared to predicting stock price. A special RNN, LSTM, a deep neural network
which can learn from past experience and can provide accurate results is been used. Results shows
how various attributes contribute towards predicting stock price.

2. BACKGROUND

2.1. Indian Stock Market Overview
The trading in Indian stock market happens in two stock exchanges- BSE (Bombay Stock Exchange)
and NSE (National Stock Exchange). For any company to sell its shares or to be a part of trading,
their credentials have to be registered in stock exchange. Authorities of stock exchange verify the
identity of the company, their financial stability and even other facets of the company. The trading
procedure, trading hours and settlement process is almost similar in both the Stock Exchanges. The
trading procedure for any company would start with the selection of broker, where registered brokers
would help in buying and selling of shares. Then any investor, who wishes to be a part of trading,
has to open a Demat (Dematerialized) account which can preserve balances of investor and convey
investor periodically about their holdings. Once the account is opened the investor can place buy and
sell orders through registered brokers. Upon the instructions of investor, broker executes the order
and facilitates the trade.
      The two main predominant market indices for BSE and NSE are Nifty and Sensex. These indicators
give an idea whether stock prices of various companies have increased or decreased. These can also
be used to compare various companies and can be used as a reflector of investor’s sentiments. Since
last few years, internet based technologies have played a very important role in Indian Stock market.
Facebook, Twitter and other social media has impact on stocks prices of a company (Bhardwaja et
al., 2015).

2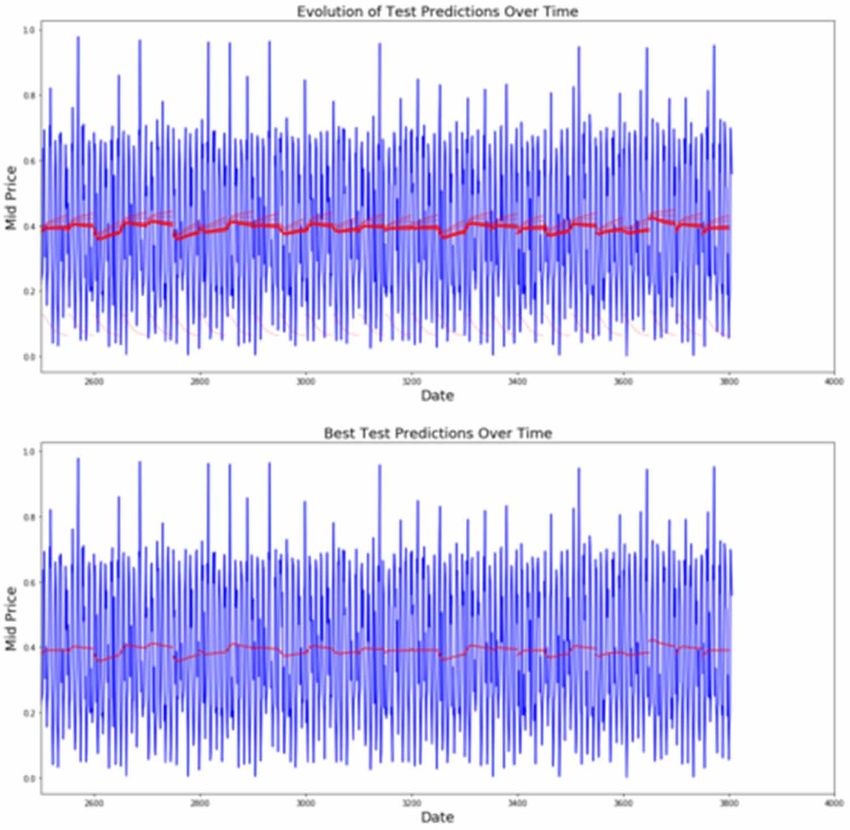
International Journal of Cognitive Informatics and Natural Intelligence
                                                                                 Volume 15 • Issue 4 • January-March 2021

Figure 1. Recurrent Neural Networks (RNN) are the type of Neural Networks that allow previous output to be taken as input for
the next state by having hidden layers

2.2. Recurrent Neural Network
Recurrent Neural Networks (RNN) are the type of Neural Networks that allow previous output to be
taken as input for the next state by having hidden layers as shown in Figure 1. This can be treated as
chain of repeated neural networks. This would reflect real world scenario. Let us take an example:
     In RNN, initially it takes the input x1and gives the output y1 by using activation function. In
later stages, it takes two inputs- x2and previous output i.e. y1 to generate the output y2 and the same
continues. This information is passed from one stage of the network to other stage through this loop.
Advantage of RNN is it can consider historical information. So, it is good to use RNN for predicting
stock market as prediction requires historical information of various companies. But, the major
drawback in RNN is: If the information is too old, it cannot predict the correct instance accurately
(Ghosh et al., 2019). This is resolved by the special kind of RNN, LSTM network.

2.3. LSTM Networks
LSTM- Long Short Term Memory Networks are the typical kind of RNN which was developed by
Hochreiter and Schmidhuber in 1997 (1997). Long term dependency problem is resolved in LSTM
network by remembering the long term information. Figure 2 represent architecture of LSTM cell
(Ma et al., 2018). The architecture of LSTM is bit different than compared to other networks that
include memory block or cells to store previous data.
     In the Figure 2:

Ct-1 – old cells state
Ct – present cell state
ht-1– output of previous cell
ht– output of previous cell
it– input gate layer
ft– forget gate layer
Ot– output sigmoid gate layer

2.4. Working of LSTM
The main part of LSTM is cell state which is represented by horizontal line at the top of the diagram.
Any information can be added or removed in LSTM through these gates. These gates are structured
using sigmoid function and point-wise multiplication operation. In the next step which is a combination
of tanh and sigmoid layer helps to add old information to new information. Then it updates the new
cell state. Finally, output is based on cell state, but will be a filtered version. First, when the sigmoid

                                                                                                                           3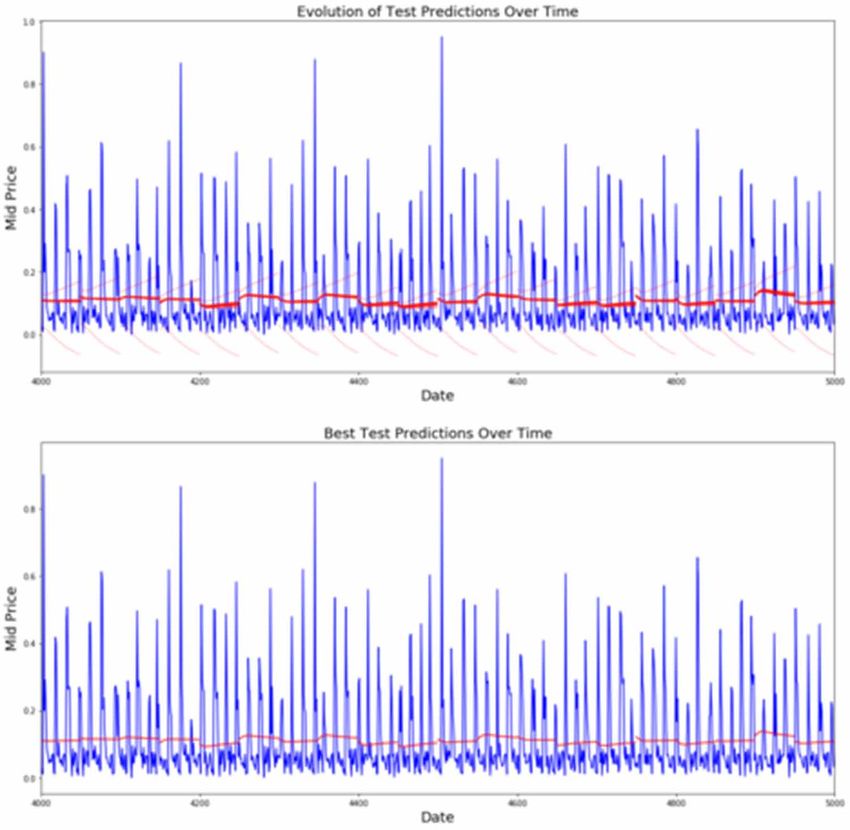
International Journal of Cognitive Informatics and Natural Intelligence
Volume 15 • Issue 4 • January-March 2021

Figure 2. Architecture of LSTM cell

layer is run it decides the parts of cell state to be given as output. Then, these parts of the cell state
are given to tanh and is then multiplied by output of the sigmoid gate, so that needed information is
given as output.

3. RELATED SURVEYS

Prediction of stock prices is being major attraction, there is a lot of research being done using
various machine learning algorithms. Macro and Micro factors have been considered for prediction.
Stock market analysis can be grouped into three categories: a) Fundamental analysis b) Technical
Analysis c) Sentimental Analysis. Fundamental Analysis tries to estimate value of stock based on
factors like current financial stability of the company, prevalent economic environment and so on.
Technical Analysis helps to figure out stock price based on recent trading movements of the company.
Sentiment Analysis attempt to measure market in terms of attitude of investors. Many of Machine
learning algorithms uses time series data of companies to do prediction like linear regression, multiple
regression, classifiers like SVM, random forest or Neural Networks like CNN, RNN or so on.
     Authors in (Ghosh et al., 2019) have analyzed stock prediction using company’s net growth and
historical data employing LSTM algorithm. In this paper, they predicted stock price and company’s
future growth in various time slots and came to conclusion that their framework gives the best
prediction for 3 months.
     Authors in (Ding & Qin, 2019) used LSTM to predict stock returns for china market. China’s
historical data was categorized as 30 days long sequences with 10 learning features and 3 day earn
rate labeling. The training of the model was done using 900000 sequences and testing was done on
other 311361 sequences. The dataset that authors used described performance of stock with sequence
learning features like closing price and trading volume on each day basis. They could get more
accuracy than compared to other algorithms.
     Predicting stock prices using sentiment analysis was done by authors in (Bhardwaja et al.,
2015) using data from Sensex and Nifty. In this paper, authors collected the data online from Nifty
and Sensex using Beautiful Soup. Later they use Text mining and Natural Language Processing to
do Sentiment Analysis. This helped to maintain economical balance of share market. This helped
investors to possess knowledge on making better investment on desired shares.

4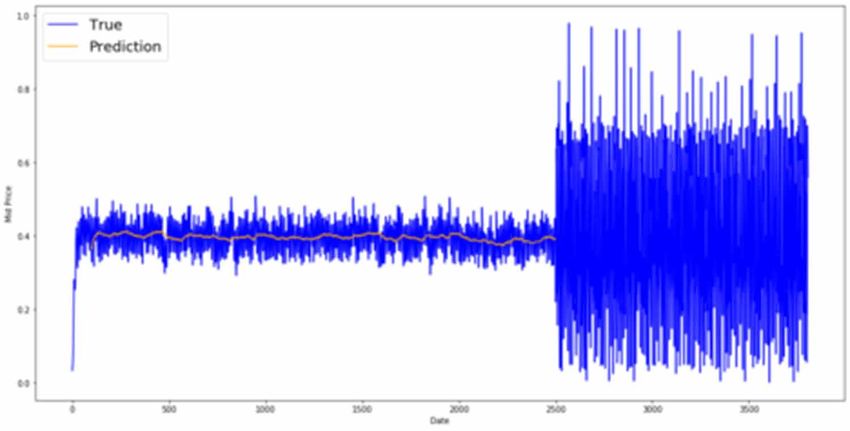
International Journal of Cognitive Informatics and Natural Intelligence
Volume 15 • Issue 4 • January-March 2021
Historical data of any company contain many details. Extracting essential features from them is a
tedious task. This task is accomplished using LSTM. Authors in (Qiu et al., 2020) have used Wavelet
Transform which is based on attention mechanism and LSTM, to extract important features and train
the same. The prediction model is established to predict stock price. Results from experiments in (Qiu
et al., 2020) have shown attention based LSTM performs better than other 3 models.
RNN, a recurrent neural network model is used extensively for time series applications. But
the major drawback of this model is its long term dependency issues which arise from its basic
structure. So, in order to overcome the long term dependency, Vanilla LSTM was proposed which is
the most commonly used LSTM. Author in (Sherstinsky, 2020) has explained clearly with equations
moving from RNN to LSTM. Author has used Albeit unconventional notation to express and ease
understanding of LSTM networks.
In this article, LSTM, a special RNN model is used to predict stock prices using Fundamental
Analysis. LSTM model is selected for prediction as it out performs RNN especially in avoiding
long term dependencies. Important characteristics are extracted in previous data which is a needed
requirement in prediction of stock price. Given, past data of a company, LSTM can learn the data
and can analyze the pattern of stock price movement. This learning can help predicting the stock
more accurately.
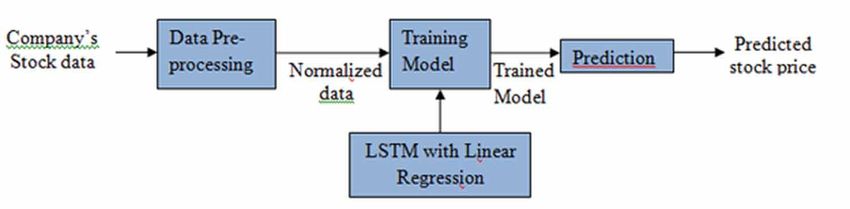
4. PROPOSED METHODOLOGY
The following modules have been identified to perform the analysis of various parameters to do
stock prediction.
1. Data Collection – Infosys data is collected from thehttps://www.bseindia.com/markets/equity/
EQReports/StockPrcHistori.aspx?expandable=6&scripcode=512289&flag=sp&Submit=G. This
dataset contains the parameters like Open price, Close Price, High price and Low price, WAP
and other characteristics. In the analysis, above parameters are considered for stock prediction
using LSTM, a RNN model. Nearly 250 months dataset is taken for analysis. Dataset is divided
into training data set and test data set. Training data set is used to train the model and Test data
set is used for prediction.
2. Data Preprocessing- The dataset collected is the raw data which can be inconsistent, incomplete
and cannot be used to represent in efficient format. Data preprocessing involves methods to
convert the raw data into useful and efficient format. The first step is to normalize the data. Data
normalization is generally done when attributes contain varied range of values. Normalization
coverts these values to common scale without distorting. Minmax Scalar function is used to
normalize the data. But Minmax scalar function converts the data in the range of 0 to 1. So the
data is normalized by splitting the data into window size that suits the dataset.
3. Training Module – LSTM (Long Term Short Module) work excellently for time series data. This
RNN model learns network considering past data. LSTM a special kind of RNN develops a model
by using data generator and data augmentation. Model considers 3 layers of LSTM’s and linear
regression. Three layers of LSTM are encapsulated in MultiRNNCell in Tensorflow. This model
is trained for past data by dividing data into batches. Output is again fed into neural network by
finding loss between predicted stock prices and actual ones. Finally, model is optimized using
Adam optimizer. Model is trained for train data and trained model does prediction on test data.
4. Prediction - The model tries to predict stock price by considering high price which is an average
of company’s low and high price. Prediction is done using dynamic_rnn function which uses
prediction model and train dataset. Obtained result is sent to Regression layer. Regression layer,
a model that finds least mean square error is used. This process is repeated for fixed number of
epochs. During this process, model learns stock price movements, and tries to predict almost
accurately.
5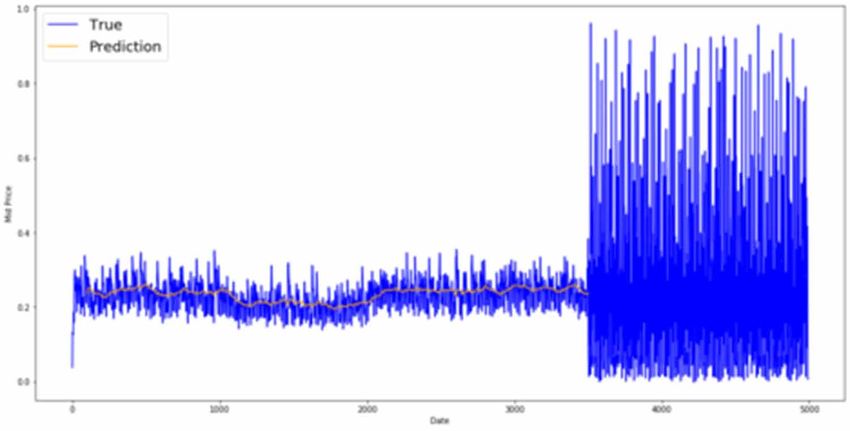
International Journal of Cognitive Informatics and Natural Intelligence
Volume 15 • Issue 4 • January-March 2021

Figure 3. A good prediction than compared to standard averaging

    This model has shown a good prediction than compared to standard averaging. The analysis is
done for various companies under IT sector and analysis shows how LSTM model performs better by
considering mid price, which is an average of low and high price of a company’s stock price (Figure 3).

5. EXPERIMENTAL RESULTS AND DISCUSSION

The experiment is conducted for various companies using mid price which is an average of low
price and high price. Here, data obtained is first normalized using MinMaxScalar Function. Then,
Standard Averaging is performed on smoothened data. The results obtained from Standard Averaging
are compared against LSTM model. In LSTM, a data generator is first implemented which has a
method called unroll batches which outputs a set of num_unrollings, which determines the number
of time steps you look into future. In this model, a num_ unrollings of 50 is used and a batch size of
500 is used. Finally MultiRNN Cell in TensorFlow is used to combine three LSTM layers. An epoch
size of 30 is used in the experiment. Results show that MSE is reduced on every epoch which clearly
indicates model is learning and is able to predict stock price movement. In this paper, the results of
Standard Averaging and LSTM are taken for four different companies under IT sector. The results
of MSE for various companies and epochs are also presented.

6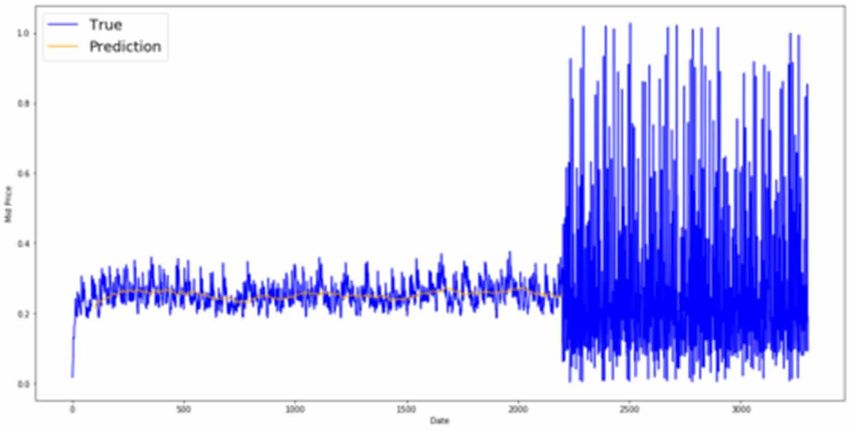
International Journal of Cognitive Informatics and Natural Intelligence
Volume 15 • Issue 4 • January-March 2021
Figure 4. LSTM model with 30 epochs gave better accuracy than compared to Standard Averaging
Figure 5. LSTM model with 30 epochs gave better accuracy than compared to Standard Averaging
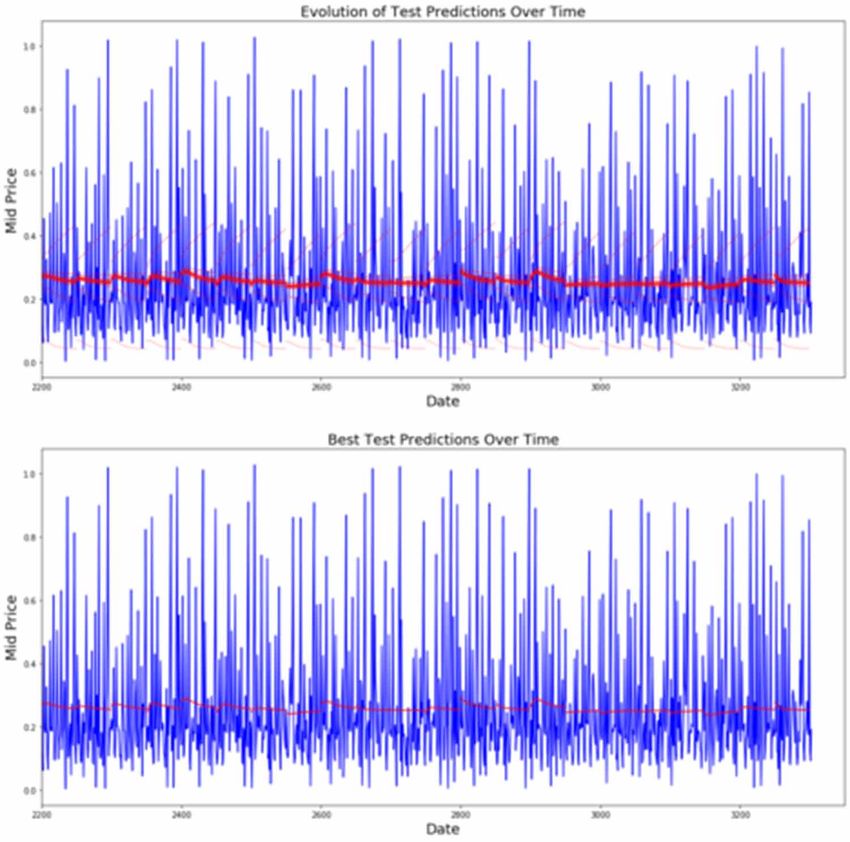
5.1. Results of Infosys Stock Price Prediction
Here, 3800 samples of Infosys stock prices are considered in this model. From these samples 3000
samples were used for the training purpose and other 800 samples are used for testing purpose.
Standard Averaging method and LSTM model were employed on these samples. From the graphs
plotted, as shown in Figure 4 and 5, LSTM model with 30 epochs gave better accuracy than compared
to Standard Averaging.
5.2. Results of TCS Stock Price Prediction
Historical stock prices of TCS were considered for the prediction. Out of 3800 samples, 3000 samples
were used for training purpose and the rest was used for testing. The results were improving over the
epochs as mean square error was decreasing. Accuracy of the prediction was improved as compared
to Standard Averaging. The results are shown in Figure 6 and 7.
7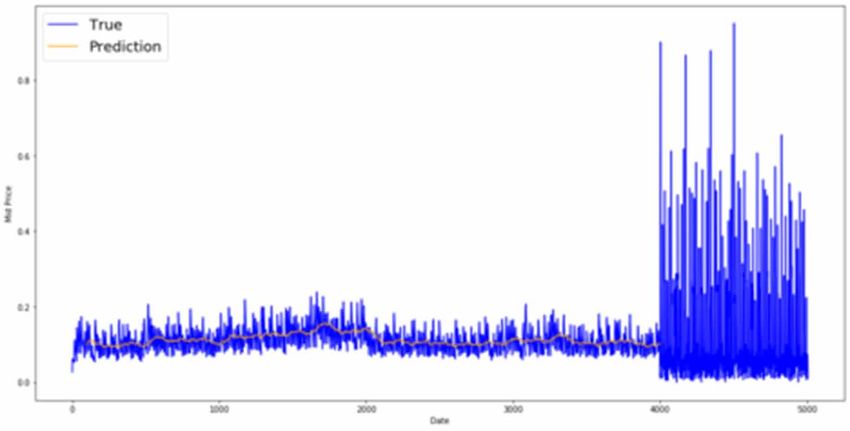
International Journal of Cognitive Informatics and Natural Intelligence
Volume 15 • Issue 4 • January-March 2021

Figure 6. Accuracy of the prediction was improved as compared to Standard Averaging

Figure 7. Comparison

8
International Journal of Cognitive Informatics and Natural Intelligence
                                                                                  Volume 15 • Issue 4 • January-March 2021

Figure 8. Predictions of the 2800 samples that were used in training along with other samples that were used for testing

Figure 9. Comparison

                                                                                                                           9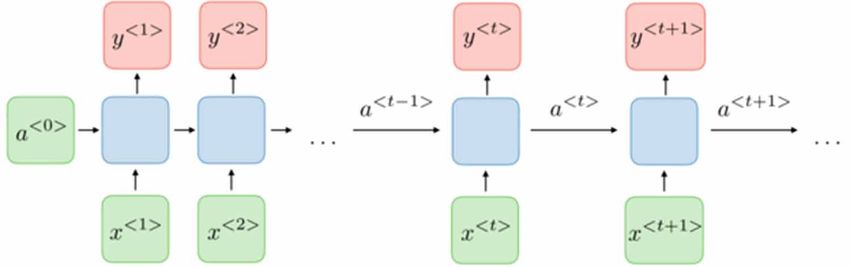
International Journal of Cognitive Informatics and Natural Intelligence
Volume 15 • Issue 4 • January-March 2021

Figure 10. Results of the prediction

Figure 11. Comparison

10
International Journal of Cognitive Informatics and Natural Intelligence
                                                                       Volume 15 • Issue 4 • January-March 2021

Table 1. Epoch readings

 Companies/Epoch               Epoch 1                                  Epoch 30
                               MSE                                      MSE
 Infosys                       0.0243                                   0.0136
 TCS                           0.06757                                  0.02315
 Tech Mahindra                 0.04039                                  0.01973
 WIPRO                         0.01810                                  0.0085

5.3. Results of Tech Mahindra Stock Price Prediction
Over 3300 samples of Tech Mahindra were considered. Of those samples, 2800 samples were used
in training and other samples were used for testing. Predictions are as shown in Figure 8 and 9. Even
these graphs indicate the LSTM could predict better than compared to Standard Averaging.

5.4. Results of WIPRO Stock Price Prediction
Similar method was followed for WIPRO by considering nearly 5000 samples. Out of which 4000
samples was used for training and other samples were used for testing. Results of the prediction
are as shown in Figure 10 and 11. MSE was reducing over the epochs which made accuracy of the
predictions even better compared to Standard Averaging.
     Mean Square Error of various companies is calculated for 30 epochs. The results of Epoch 1 and
Epoch 30 are represented in Table 1.
     From the tabulated values, it can be inferred that Mean Square Error is reducing as the number
of Epochs increases. MSE loss is going down as the amount of the training increases. This indicates
the LSTM model is learning stock prediction movement. The graphs clearly indicate LSTM performs
better than Standard Averaging.

6. CONCLUSION

This paper establishes a LSTM model which is comprised of 3 LSTM layers along with linear
regression. This model proves it predicts more accurately than Standard Averaging. The Recurrent
Neural Network having memory cells stores data that is very appropriate and uses this for further
calculation. This special type of neural network helps the model to learn better.
    Researchers future work stresses on using the stock related news either from twitter or any other
social media and use this analysis along with mid price to predict stock price. Since, only the past
data may not be sufficient to predict stock price as the market is too volatile and even depend on
current situations. This can even increase accuracy of the model.

                                                                                                             11
International Journal of Cognitive Informatics and Natural Intelligence Volume 15 • Issue 4 • January-March 2021 REFERENCES Bhardwaja, Narayanb, Vanrajc, & Maitreyee. (2015). Sentiment Analysis for Indian Stock Market Prediction Using Sensex and Nifty. In 4th International Conference on Eco-friendly Computing and Communication Systems. Elsevier Publication. Coyne, S., Madiraju, P., & Coelho, J. (2017). Forecasting Stock Prices Using Social Media Analysis. IEEE 15th Intl Conf on Dependable, Autonomic and Secure Computing. Ding, G., & Qin, L. (2019). Study on the prediction of stock price based on the associated network model of LSTM. Int. J. Mach. Learn. & Cyber. .10.1007/s13042-019-01041-1 Gao, , Chai, , & Liu, . (2017). Applying long short term memory neural networks for predicting stock closing price. 8th IEEE International Conference on Software Engineering and Service Science (ICSESS). Ghosh, , Bose, , Maji, , Debnath, , Sen, , & Chowdhury, . (2019). Stock Price Prediction Using LSTM on Indian Share Market. Proceedings of 32nd International Conference on Computer Applications in Industry and Engineering. Hamzaebi, C., Akay, D., & Kutay, F. (2009). Comparison of direct and iterative artificial neural network forecast approaches in multi-periodic time series forecasting. Expert Systems with Applications, 36(2), 3839–3844. doi:10.1016/j.eswa.2008.02.042 Hochreiter, S., & Schmidhuber, S. (1997). LSTM can solve hard long time lag problems. Advances in neural information processing systems. NIPS. Ma, H., Ab, G. E., Menonab, V. K., & Soman, , K.P. (2018). NSE Stock Market Prediction Using Deep-Learning Models. International Conference on Computational Intelligence and Data Science (ICCIDS 2018). Menon, V. K., Vasireddy, N. C., Jami, S. A., Pedamallu, V. T. N., Sureshkumar, V., & Soman, K. P. (2016). Bulk Price Forecasting Using Spark over NSE Data Set. International Conference on Data Mining and Big Data, 137-146. doi:10.1007/978-3-319-40973-3_13 Nivethitha. (2019). Future Stock Price Prediction using LSTM Machine Learning Algorithm. International Research Journal of Engineering and Technology, 6(3), 1182-1186. Qiu, J., Wang, B., & Zhou, C. (2020). Forecasting stock prices with long-short term memory neural network based on attention mechanism. PLoS ONE, 15(1). doi:10.1371/journal.pone.0227222 Sherstinsky, A. (2020). Fundamentals of Recurrent Neural Network (RNN) and Long Short-Term Memory (LSTM) network. Physica D: Nonlinear Phenomena, 404. 10.1016/j.physd.2019.132306 Zhang, G. P. (2003). Time-series forecasting using a hybrid ARIMA and neural network model. Neurocomputing, 50, 159–175. doi:10.1016/S0925-2312(01)00702-0 Zhang, J., & Huang, M. L. (2013). 5Ws model for bigdata analysis and visualization. IEEE 16th International Conference on Computational Science and Engineering, 1021-1028. Sagar B. Patil is an Assistant Professor for the School of Management Studies and research at KLE Technological University. 12
You can also read