Computer Support for Hull Condition Monitoring with PEGASUS
←
→
Page content transcription
If your browser does not render page correctly, please read the page content below
Computer Support for Hull Condition Monitoring with PEGASUS
     David Jaramillo, Germanischer Lloyd, Hamburg/Germany, david.jaramillo@gl-group.com
     Christian Cabos, Germanischer Lloyd, Hamburg/Germany, christian.cabos@gl-group.com

Abstract
Corrosion is one of the major issues for the structural condition of a vessel during its service life. In
case of tankers and bulk carriers this aspect is even more crucial due to the exposure of the structure
not only to salt water, but also to other abrasive substances in the cargo spaces. In order to monitor
the condition of structural components, condition assessments are conducted within the scope of class
surveys, statutory surveys and ship owner's surveys in regular time intervals. Information to be
recorded consists of thickness measurements and other findings affecting structural strength like
cracks, coating and anode condition. Today, thickness measurements are typically recorded manually
on ship drawings or tables, i.e. the recording and handling of such information is dominated by paper
work, manual copying of data, and spreadsheets. The amount of data and increasing requirements
with respect to condition assessment demand efficient computer support.

Currently, there is no standard for the storage of thickness measurement data. In this paper the
development of a new computer tool is presented, which supports the thickness measurement process
from planning through recording to visualization. The PEGASUS system makes use of a neutral data
format for hull condition monitoring data, which has been developed for this purpose in the EU
funded research project CAS. The foremost purpose of this data format is the easy association of
survey findings with their location on the ship.

1    Introduction

The condition of the steel structure of ships is subject to requirements of classification societies as
stipulated in the rules for classification on the one hand and to international requirements being
controlled by statuary regulations specified in several IMO resolutions (e.g. A744(18) and
MEPC.94(46)) on the other hand. Also from the business and operational perspective, the condition of
the structure of any marine vessel (ship or any other floating unit) is a major concern for the
owning/managing company during the whole service life. Since dry-docking stays represent an
interruption of the service of the vessel, they must be kept to a minimum. Furthermore, for ship types
most vulnerable with respect to corrosion (i.e. tankers and bulk carriers), special requirements from
the cargo owner, vetting procedures and additional inspections such as CAP (Condition Assessment
Programme), are common practice.

Usually, structural defects on ships are identified by means of visual inspections (marine surveys) and
measurements using special instruments (e.g. crack detection, tightness, plate thickness, etc.). These
inspections are carried out by surveyors of the classification societies, by specialized firms and
sometimes by crew staff. Structural defects have often been classified into the following categories,
e.g. in Weydling et al. (2003):

-   Material deformation (buckling)
-   Material Rupture (cracks, breach)
-   Material Degradation (Corrosion, Abrasion)

While the first two categories are relatively easy to localize (except for cracks), quantify, and
characterize, in the third case, especially when considering all possible types of corrosion (general
corrosion, pitting corrosion, grooving corrosion, etc.), the characteristics of the defect are more
difficult to describe, collect and report.

Corrosion is one of the most common types of deterioration of metal structures. It cannot be fully
avoided in maritime business, since most marine vessels are made of steel being more or less exposed
to water or aggressive substances during its service life. The focus of this paper is on monitoring of

                                                                                                        1
corrosion as an important mechanism to have some control over the process and to prevent for
instance structural failure or collapse, resulting in major damages for life and the environment.
2 Thickness Measurements (TM) for Corrosion Monitoring
Corrosion monitoring in maritime business is today typically performed through ultrasonic thickness
measurements (UTM) carried out by qualified operators using specialized measurement equipment.
Procedures for UTM are well established and mostly governed by requirements of the individual
Classification Societies. The International Association of Classification Societies (IACS) has
introduced so called Unified Requirements (UR) and Procedural Requirements (PR), covering
explicitly the execution of UTM as part of the classification survey procedure, IACS (2004) and IACS
(2006). The individual requirements are available for common ship types and include details on the
scope and locations of measurements as well as recommendations for the reporting format (so called
IACS TM tables, see Figure 1).
Ship's
Chess Class Identity No. 30999 Report No. RMAB 849
name
STRAKE
POSITION 8th strake from keelstrake, upper bilge strake
No. Org. Maximum Forward Reading Aft Reading
PLATE allowable Mean Diminution %
or Thk. Diminution Gauged Diminution P Diminution S Gauged Diminution P Diminution S
POSITION
Letter mm mm P S mm % mm % P S mm % mm % P S
7th J15 17,5 2,03 17,5 17,6 -- -- -- -- 17,5 17,5 -- -- -- -- -- --
6th J14B 17,5 2,03 17,7 17,8 -- -- -- -- 17,7 18,1 -- -- -- -- -- --
5th J14A 35,5 3,00 35,4 35,6 0,1 0,3 -- -- 35,3 35,6 0,2 0,6 -- -- 0,4 --
4th J13 35,5 3,00 35,7 35,4 -- -- 0,1 0,3 35,4 35,4 0,1 0,3 0,1 0,3 0,3 0,3
3rd J12 35,5 3,00 35,3 35,2 0,2 0,6 0,3 0,8 35,4 35,2 0,1 0,3 0,3 0,8 0,4 0,8
2nd J11 35,5 3,00 35,3 35,8 0,2 0,6 -- -- 35,4 36,0 0,1 0,3 -- -- 0,4 --
1st
J10 25,5 2,75 26,0 25,8 -- -- -- -- 25,4 25,7 0,1 0,4 -- -- 0,4 --
forward
Amidships J9 25,5 2,75 25,7 25,5 -- -- -- -- 25,7 25,9 -- -- -- -- -- --
1st aft J8 25,5 2,75 25,5 26,0 -- -- -- -- 25,7 25,8 -- -- -- -- -- --
2nd J7 25,5 2,75 25,8 25,9 -- -- -- -- 25,8 25,9 -- -- -- -- -- --
3rd J6 25,5 2,75 25,4 25,5 0,1 0,4 -- -- 25,5 25,6 -- -- -- -- 0,4 --
4th J5 25,5 2,75 25,4 25,2 0,1 0,4 0,3 1,2 25,2 25,6 0,3 1,2 -- -- 0,8 1,2
5th J4 22,0 2,43 21,6 22,1 0,4 1,8 -- -- 21,9 22,0 0,1 0,5 -- -- 1,1 --
6th J3 22,0 2,43 21,7 21,7 0,3 1,4 0,3 1,4 22,0 22,6 -- -- -- -- 1,4 1,4
7th J2 11,5 1,50 11,7 11,5 -- -- -- -- 11,5 11,6 -- -- -- -- -- --
8th J1 11,5 1,50 11,7 11,2 -- -- 0,3 2,6 11,4 11,6 0,1 0,9 -- -- 0,9 2,6
Figure 1: Tabular representation of thickness measurements following IACS standards
2.1 Need for process improvement
With respect to data collection and reporting, the current TM procedure is a highly manual process.
The analysis and assessment of often many thousand measurement points result in up to 500-page
report documents. Compilation of such reports is a tedious and long lasting process, which in most
cases takes longer than the docking itself. Significantly shorter reporting times can therefore have a
large positive impact on the monitoring and repair process as soon as it becomes possible that the
report is ready before the ship leaves the dock.
Another important disadvantage of the current procedure is the lack of an automatic integration of
measurement results with existing structural models of the ship, for the purpose of conducting e.g.
strength calculations. Nowadays, any required TM data exchange is performed manually and
redundantly, point by point. The major disadvantages of the current procedure can be summarized as:
- Data is entered redundantly (data collection reporting analysis)
- No link between tabular and graphical representation
- In many cases no graphical representation is available, in particular no adequate visualisation
(colouring, 3D view, filtering, sorting, etc.)
- No data interface between the gauging device and the used software (e.g. EXCEL)
- No automatic transfer of the TM results to a class calculation systems
2Considering the above mentioned aspects, the logical step for achieving an improvement in
processing time and data quality is the provision of adequate IT support in terms of tools for efficient
data input, assessment, and exchange and correspondingly tailored electronic data formats. For the
last years this has been the subject of Research and Development activities at Germanischer Lloyd in
close cooperation with industrial and academic partners. An example of such activities is the EU
Research Project CAS, in which Germanischer Lloyd in cooperation with two other IACS society
members (Bureau Veritas and Russian Register of Shipping) and other partners is developing a
neutral Data Model for collecting, transporting and storing TM data as described in the following
section. Building on this Data Model, Germanischer Lloyd has implemented the software tool
PEGASUS, for TM data collection, visualisation and reporting. This tool is introduced in later
sections.
2.2 Hull Condition Model (HCM)
In the current TM process, data collection is performed by noting the TM readings in previously
prepared sketches and drawings of the measured parts of the ship. Commonly, AutoCAD or similar
software is used for the preparation of such sketches. The TM campaign itself is often executed by
two operators; one for placing the probe on the measured steel parts (e.g. inside a tank or climbing a
bulkhead) and another for writing the results on paper. After the campaign, the final report is prepared
according to IACS TM tables (see Figure 1). For this purpose, usually spreadsheet software (e.g.
EXCEL) is used.
Typically, the CAD Drawings and the Excel tables represent today’s maximum degree of IT support
for the TM procedure. There is no standard electronic format for the TM data itself. Results of a
process analysis, Jaramillo et al (2006), show clearly, that a standardized format to be used by all
participants in the process in combination with adequate software tools would solve many of the
aforementioned problems.
Consequently, the Hull Condition Model (HCM) data format developed in the CAS project aims
specifically at improving the current TM process, Jaramillo et al. (2005). Furthermore, HCM covers
other aspects of the Hull1 Condition Monitoring and Assessment (HCMA) process beyond the scope
of the Thickness Measurements, such as pitting corrosion, coating condition, buckling and cracks.
HCM is based on XML technology and contains the data constructs which are necessary to transport
information about the structural condition of a ship. The Data Model will be proposed to IACS for
standardisation with the aim to reach wide acceptance and hence easy data exchange between the
parties involved in the TM process.
HCM is a data model focussing on the service phase of the vessel. The foremost purpose of HCM is
the easy association of survey findings with their location on the ship. Serving mainly this goal, the
complexity and detail of the model is kept to a minimum.
For that reason, HCM uses simplified geometry in contrast to complex, topology-based structural
definitions used for other purposes in shipbuilding, mainly during the design phase (strength
calculation, manufacturing preparation, etc.). In HCM, simplified geometry is used
- for the graphical representation of the structural parts for both data collection and visualisation
purposes and
- for mapping measurement results to a more complex analysis model.
The level of accuracy of the geometry representation in HCM is comparable to the one found in
sketches and drawings prepared for the same purpose in the current process. The focus of the model is
on the identifiable shape of each individual structural part and its position in the vessel. In contrast,
1
The term "Hull" is used here to refer to all structural aspects of a vessel in contrast e.g. to machinery
or parts of the electrical installation.
3the relationships between the parts and their accurate shape are less important in this case. In
particular, gaps or overlaps between adjacent plates in the model pose no problem as long as it is
possible for the user to identify the displayed part and associate it with what is seen on the steel
drawings or in the real ship.
The association between measured value and the corresponding structural part can be established by
the user either by means of the position of the measurement point (transported in the HCM file) or by
other linking mechanisms such as a naming scheme (i.e. a globally unique identifier) for each
structural part. As soon as a measurement point has been entered, within the data model it uniquely
references a plate and its local position on the plate.
3 TM Process with PEGASUS
PEGASUS is a software tool developed at Germanischer Lloyd to support the TM process. The tool is
intended to be used by TM firm inspectors, by GL surveyors on site and by GL Hull Condition
experts at the Head Office in Hamburg. When designing PEGASUS, special attention has been given
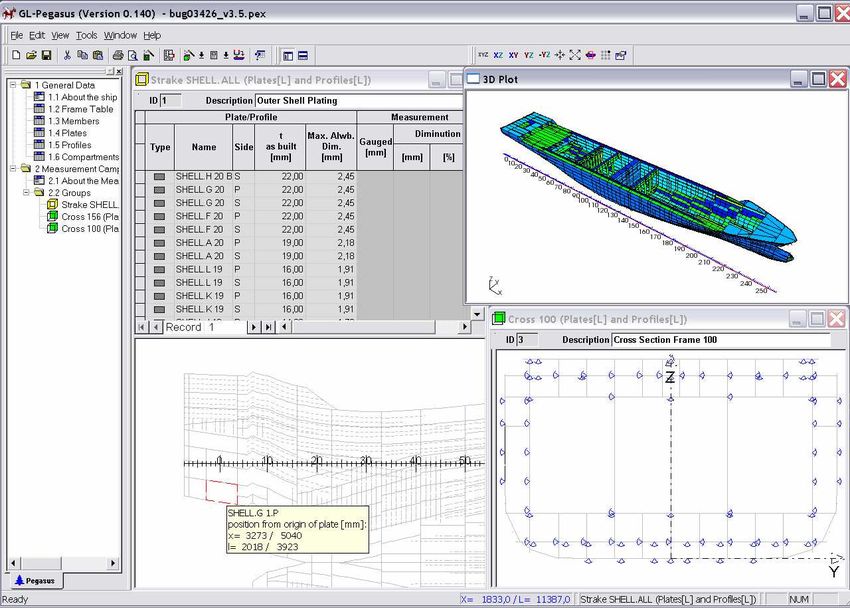
to achieve fast and easy input and visualisation of TM data. Figure 2 shows a screenshot of
PEGASUS in action.
Figure 2: Screenshot of the PEGASUS application
The concept of the new TM process using PEGASUS is shown in Figure 3. Starting from an available
POSEIDON structure model, the initial HCM file, containing the simplified geometry representation
of the structure parts, will be generated by means of a corresponding data interface. At this stage, the
HCM file contains general information about the ship, the frame table, information about each
structural part to be measured (plates and stiffeners), the compartment definitions and a list of
structure members. This initial HCM file (pre-survey status) is prepared at Germanischer Lloyd and
sent to the corresponding TM firm.
4Ultrasonic
Tabular & Gauging Device
HCM File
(XML) Graphical
POSEIDON Display
Pegasus Pegasus
TM Report
fleet-online TM firm
GL
HCM File
(XML)
Ship Owner
Pegasus Viewer
Figure 3: Sketch of the new TM process using PEGASUS
3.1 Preparation of the TM Campaign
At the TM firm, after loading the HCM file in PEGASUS the different "tasks" of the TM campaign
can be prepared (so called TM Configurations). For this purpose it is possible to define:
a) cross-section-based views of the structure, which
are usual for so called "TM belts" at specific
frame positions,
b) strake-based views, which are usual for global
thickness measurements on bottom, shell and
upper deck plating,
c) compartment-based views, which correspond to
the natural measurement procedure in closed
spaces or
d) user defined configurations of the structure parts
to be measured.
The corresponding dialogue is shown in Figure 4. Figure 4 Creating TM configurations
A TM configuration consists of a set of measurable structure parts, which are arranged according to a
specific measurement task. For instance, if the task is to measure the whole outer shell plating, the
common arrangement for data collection and reporting is strake based (based on the shell expansion
drawing), but if the task consists of the measurement of a "belt", then a cross section based
arrangement of the structure parts at the specific frame position is more convenient.
The PEGASUS screenshot in Figure 2 shows typical strake based and cross section based TM
configurations. Data Collection can be achieved in both the tabular and the graphical view.
Furthermore, the gauging values are visible independently of the configuration; e.g. readings taken in
cross section view are visible in the corresponding position in the strake view and vice-versa.
3.2 Data Collection
PEGASUS has been designed to provide support in different user scenarios depending on aspects like
5the different way of working of TM firms (e.g. number of operators) and the available equipment
(simple or sophisticated gauging devices, data loggers, etc). Data collection is achieved by entering
the measured values directly in the tables or in the graphical representation. Both views are
interconnected and can be hidden or shown as required. The data can be entered in PEGASUS directly
on site or later in the office. In the latter case, graphical views of the measured areas can be printed
out and taken onboard for data collection. This approach corresponds to the current way of working,
with the advantage, that once the data is entered in PEGASUS further processing is much easier than
today with respect to reporting, visualisation, and assessment.
Additionally, a direct connection to an UTM device is supported. Depending on the used device, it is
possible to have a one or two directional data exchange. In the first case the measured values are
transmitted to PEGASUS and assigned to the corresponding position. In the second case a complete
measurement plan can be sent to the UTM device. The inspector goes onboard with the programmed
UTM device, in which the measurement plan can be displayed in tabular form, takes the
measurements and sends all the results back to PEGASUS. Figure 5 shows a TM configuration in
PEGASUS and the corresponding view on the display of a Krautkraemer DMS-2 UTM device.
Figure 5: Data exchange with the DMS-2 UTM Device
3.3 TM reporting
After the data collection phase, the HCM file containing the measurement values is available (post
survey status). At this stage the TM reports can be generated in PEGASUS according to the IACS
requirements. To facilitate integration with word processing software, the Rich Text Format (RTF)
has been chosen for this purpose (see Figure 6). In fact, automatic generation of IACS compliant TM
reports represents one of the major improvements in terms of time saving with respect to the old
process. PEGASUS provides flexibility in the composition of the TM report by means of a reporting
wizard. Individual reports for each configuration (e.g. for daily reports) or a global report containing
all available TM results can be generated.
6Figure 6: Automatically generated TM Report
3.4 Analysis and Assessment
Finally, both the TM report and the post survey HCM file are sent to Germanischer Lloyd (local and
head office), where the analysis of the TM data is performed using PEGASUS. For this purpose, the
visualisation mechanisms are used to easily identify the hot spots. If necessary, the measurement data
can be imported into POSEIDON from the HCM file and longitudinal strength calculations can be
performed using the measured thickness values.
As mentioned previously, an important aspect of
the support provided by PEGASUS is the
adequate visualisation of the TM data. For this
purpose, a colouring scheme based on the degree
of corrosion is used in both graphical and tabular
views of the TM data. Additionally, the structural
arrangements can be displayed in a 3D view
providing a global overview of the measured
areas. Figure 7 shows an example 3D view in
PEGASUS colour coded with respect to
thickness diminution.
For orientation purposes the frame scale can be
displayed in both 2D and 3D graphical views. By
Figure 7 3D View in PEGASUS placing the mouse cursor over a structure part,
additional information can be shown like
identification of the plate/stiffener or the name of
the structure member to which it belongs.
7Measurement points are displayed in different ways. The displayed information can be configured, e.g. showing the id of the point, the measured value, or an assigned numbering for the UTM device configuration. As the result of a TM campaign is contained in an HCM file, which is a neutral data format, the information about the corrosion status of the vessel can be provided to the ship owner via online services (e.g. GL's fleet-online). An HCM Viewer (e.g. a special version of PEGASUS) will be provided as a tool for the Ship Owner to adequately visualize the data. 3.5 Availability of structure models In the last years, the creation of an electronic structure model has become part of the new-building process. In case of Germanischer Lloyd, the software used for this task is POSEIDON. For old ships such a structural model is rarely available today, but obviously a model that accompanies the vessel’s life cycle is also beneficial in other cases than Corrosion Monitoring as e.g. for Emergency Response Service. For that reason, the number of ships in service for which structural models are available will clearly increase in the coming years. In the case of PEGASUS, an HCM file containing the part of the ship to be measured will be generated from a POSEIDON model. This POSEIDON model will most likely be prepared by Germanischer Lloyd. 4 Conclusions and Outlook A new software tool supporting the thickness measurement process has been developed by Germanischer Lloyd. The target users of PEGASUS are TM firms and GL staff (Surveyors and Experts) for data collection and data assessment, respectively. Ship owners will be able to view results of thickness measurements in 2D and 3D visualizations with a special viewing program. Instead of preparing sketches and drawings after taking the measurements, a structural model of the ship will be prepared before the inspection. A derived HCM model can then be used to plan the measurements. By directly associating gaugings to the model during inspection using PEGASUS, the complete results of the measurement campaign can be available directly afterwards. Thereby, inspection results can be presented earlier to the ship owner and potential sources of error are reduced because of significantly less manual interaction during measurement and reporting. Acknowledgements The HCM Data Model is being developed in cooperation with the members of the CAS consortium (Bureau Veritas, Russian Register of Shipping, Materiaal Meetingen, SENER, Intertanko, Lisnave, Instituto Superior Tecnico, Total and Cybernetix). This work is supported by the European Commission in the Sixth Framework Programme. The joint work and the funding provided by the European Commission are gratefully acknowledged. The data interfaces to and from UTM devices have been developed in cooperation with GE Inspection Technologies (formerly Krautkraemer). References BRUCE et al. (2003), Inspection and Monitoring, in: Proceedings of the 15th International Ship and Offshore Structures Congress, Mansour, Q.E., Ertekin, R.C., eds., 2003, Vol. 2, p.37-69. IACS (2004), PR 19 "Procedural Requirement for Thickness Measurements", Revision 3, June 2004, http://www.iacs.org.uk/preqs/PR19R3.PDF IACS (2006), UR Z "Requirements concerning Survey and Certification", Revision 12, 2006, http://www.iacs.org.uk/ureqs/URZ.PDF 8
IACS1 (2004), Guideline 77 "Guidelines for the Surveyor on how to Control the Thickness
Measurement Process", Revision 1, July 2004, http://www.iacs.org.uk/_pdf/Rec77.pdf

IACS2 (2004), PR 23 "Procedures for Reporting Information on the Approval of Thickness
Measurement Firms", Revision 1, December 2004, http://www.iacs.org.uk/preqs/PR23R1.PDF

IMO (2001), Resolution MEPC.94(46) "Condition Assessment Scheme", 2001.

IMO (2003), Resolution MEPC.111(50), Amendments to regulation 13G, addition of new regulation
13H, 2003.

JARAMILLO D., CABOS C., RENARD P. (2005), Efficient Data Management for Hull Condition
Assessment, International Conference on Computer Application in Shipbuilding ICCAS 2005, Pusan,
Korea, Sept. 2005.

JARAMILLO D., MIKELIS N., CARTAXO A., ROUTISSEAU L., MOERLAND P. (2006), CAS
Deliverable D-1-2-1 "Business Process Analysis and User Requirements", Draft version 0.7, March
2006.

JARAMILLO D., CABOS C., RENARD P. (2006), Efficient Data Management for Hull Condition
Assessment, International Journal of CAD/CAM Vol.6, No. 1, 2006

WEYDLING C., KREBBER K. (2003), Erfassung und Verarbeitung von Dickenmessungen,
Abschlussbericht Teilprojekt WIPS II B3, GL-Report BFC 2003.282, 2003.

                                                                                                  9
You can also read