Black Sea Bass Fishery Information Document - Mid ...
←
→
Page content transcription
If your browser does not render page correctly, please read the page content below
Black Sea Bass Fishery Information Document
                                             June 2021

This document provides a brief overview of the biology, stock condition, management system, and
fishery performance for black sea bass (Centropristis striata) with an emphasis on 2020 (note that
there are caveats associated with 2020 data due to COVID-19 related data gaps). Data sources
include unpublished National Marine Fisheries Service (NMFS) commercial fish dealer reports,
vessel trip reports (VTRs), permit data, as well as Marine Recreational Information Program
(MRIP) data and stock assessment information. All 2020 data should be considered preliminary.
For more information on black sea bass management, including previous Fishery Information
Documents, please visit http://www.mafmc.org/sf-s-bsb.

 Key Facts
     •   Black sea bass are not overfished and overfishing is not occurring, according to the most
         recent stock assessment, which included data through 2018. Incorporation of a revised
         time series of MRIP data and data on the large 2015 year class both contributed to an
         increase in estimated stock biomass compared to the previous assessment.
     •   Updated stock assessment information will be available in July 2021.
     •   In 2020, about 4.12 million pounds of black sea bass were landed by commercial
         fishermen, a 19% increase from 2019. Commercial fish dealers paid an average of $2.40
         per pound of black sea bass, a 30% decrease from the 2019 average price. This decrease
         was likely influenced by impacts of the COVID-19 pandemic on market demand in 2020.
     •   Recreational fishermen harvested an estimated 9.05 million pounds of black sea bass in
         2020, a 5% increase from 2019. Anglers fishing from private/rental vessels accounted for
         86% of black sea bass harvest (in numbers of fish) in 2020.

Basic Biology
Black sea bass are distributed from the Gulf of Maine through the Gulf of Mexico. Genetic studies
have identified three stocks within that region. This document focuses on the stock from the Gulf
of Maine through Cape Hatteras, North Carolina.
Adult and juvenile black sea bass are mostly found on the continental shelf. Young of the year
(i.e., fish less than one year old) can be found in estuaries. Adults show strong site fidelity during
the summer and prefer to be near structures such as rocky reefs, coral patches, cobble and rock
fields, mussel beds, and shipwrecks. Black sea bass migrate to offshore wintering areas starting in
the fall. During the winter, young of the year are distributed across the shelf and adults and
juveniles are found near the shelf edge. During the fall, adults and juveniles off New York and
north move offshore and travel along the shelf edge to as far south as Virginia. Most return to
northern inshore areas by May. Black sea bass off New Jersey to Maryland travel southeast to the

                                                                                                    1
shelf edge during the late fall. Black sea bass off Virginia and Maryland travel a shorter distance
due east to the shelf edge, which is closer to shore than in areas to the north.1,2
Black sea bass are protogynous hermaphrodites, meaning they are born female and some later
transition to males, usually around 2-5 years of age. Male black sea bass are either of the dominant
or subordinate type. Dominant males are larger than subordinate males and develop a bright blue
nuccal hump during the spawning season. About 25% of black sea bass are male at 15 cm (about
6 inches), with increasing proportions of males at larger sizes until about 50 cm, when about 70-
80% of black sea bass are male. Results from a simulation model highlight the importance of
subordinate males in spawning success. This increases the resiliency of the population to
exploitation compared to other species with a more typical protogynous life history. About half of
black sea bass are sexually mature by 2 years of age and 21 cm (about 8 inches) in length. Black
sea bass reach a maximum size of about 60 cm (about 24 inches) and a maximum age of about 12
years.2, 3
Black sea bass in the Mid-Atlantic spawn in nearshore continental shelf areas at depths of 20-50
meters. Spawning usually takes place between April and October. During the summer, adult black
sea bass share habitats with tautog, hakes, conger eel, sea robins and other migratory fish species.
Essential fish habitat for black sea bass consists of pelagic waters, structured habitat, rough bottom,
shellfish, sand, and shell, from the Gulf of Maine through Cape Hatteras, North Carolina. Juveniles
and adults mostly feed on crustaceans, small fish, and squid. The Northeast Fisheries Science
Center (NEFSC) food habits database lists spiny dogfish, Atlantic angel shark, skates, spotted
hake, summer flounder, windowpane flounder, and monkfish as predators of black sea bass.1
Status of the Stock
The information below is based on the most recent stock assessment information available when
this document was written. Updated stock assessment information will be available in July 2021.
A black sea bass operational stock assessment was peer reviewed and accepted in August 2019. It
incorporated commercial and recreational fisheries data and fishery-independent survey data
through 2018, including revised MRIP data for 1989-2018. The assessment concluded that the
black sea bass stock north of Cape Hatteras, North Carolina was not overfished and overfishing
was not occurring in 2018. Spawning stock biomass in 2018 was estimated to be 2.4 times the
target level. The average fishing mortality rate on fully selected ages 6-7 fish in 2018 was 9%
below the fishing mortality threshold reference point, meaning that overfishing was not occurring
in 2018 (Table 1). Figure 1 and Figure 2 show the time series of estimated spawning stock biomass,
recruitment, fishing mortality, and catch (landings and dead discards) from the August 2019 stock
assessment. The values for fishing mortality and spawning stock biomass were adjusted for 2018
only to account for retrospective bias in the model.4
The 2011 year class (i.e., those fish spawned in 2011) was estimated to be the largest in the time
series at 144.7 million fish. The 2015 year class was the second largest at 79.4 million fish. The
2011 year class had a major impact on recent stock dynamics and was much more prevalent off
Massachusetts through New York compared to New Jersey and south. The large 2015 year class
is more evenly distributed from southern New England through the Mid-Atlantic. Recruitment of
the 2017 year class as age 1 in 2018 was estimated at 16.0 million fish, well below the 1989-2018
average of 36 million fish (Figure 1).4 Recruitment estimates for the 2018-2020 year classes are
not yet available.
2An updated black sea bass stock assessment will be peer reviewed in July 2021 and will be used
to inform 2022-2023 catch and landings limits. This assessment will include data through 2019.
Given data gaps for 2020 related to COVID-19 and the time required to address those gaps where
possible, 2020 data will not be incorporated into this update.
Table 1: Black sea bass biological reference points from the 2019 operational stock assessment.4
Reference Points and terminal year SSB and F 2019 operational stock assessment
estimates Data through 2018
SSBMSY proxy = SSB40% (biomass target) 31.07 mil lb / 14,092 mt
½ SSBMSY
15.53 mil lb / 7,046 mt
(biomass threshold defining an overfished state)
73.65 mil lb / 33,407 mt (2018). Adjusted for
Terminal year SSB retrospective bias.
240% of SSBMSY. Not overfished.
FMSY proxy = F40%
0.46
(threshold defining overfishing)
0.42 (2018). Adjusted for retrospective bias.
Terminal year F Fully selected ages 6-7.
9% below FMSY. Overfishing not occurring.
40,000 R SSB SSBmsy 160
35,000 140
30,000 120
Recruitment (age 1, millions)
25,000 100
SSB (mt)
20,000 80
15,000 60
10,000 40
5,000 20
0 0
1989
1990
1991
1992
1993
1994
1995
1996
1997
1998
1999
2000
2001
2002
2003
2004
2005
2006
2007
2008
2009
2010
2011
2012
2013
2014
2015
2016
2017
2018
Figure 1: Black sea bass spawning stock biomass (solid line); recruitment (bars), 1989 - 2018; and
biomass reference point (dashed line) from the 2019 operational stock assessment. Recruitment is
shown as age 1 fish (e.g., the 2011 year class is shown in 2012). The red circle is the retro-adjusted
spawning stock biomass value for 2018. The red square is the retro-adjusted recruitment value for
2018. These values were adjusted only for 2018. The adjustments were made to correct for
retrospective bias in the assessment model. The adjusted spawning stock biomass estimate should
be used for comparison against the reference point. The stock is overfished when spawning stock
biomass is below this reference point. 4
3Total Catch F Fmsy=F40%=0.46
12,000 1.2
10,000 1.0
Fishing Mortality (F)
Total Catch (mt)
8,000 0.8
6,000 0.6
4,000 0.4
2,000 0.2
0 0.0
Figure 2: Fishing mortality rate (F) on black sea bass ages 6-7, the FMSY proxy reference point
from the 2019 operational stock assessment, and total catch (landings and dead discards), 1989-
2018. The red circle is the retro-adjusted fishing mortality rate for 2018. This adjustment was made
to correct for retrospective bias present in the assessment model and is used as the estimate to
compare to the reference point. Overfishing is occurring when the fishing mortality rate exceeds
this reference point.4
Management System and Fishery Performance
Management
The Mid-Atlantic Fishery Management Council (Council) and the Atlantic States Marine Fisheries
Commission (Commission) work cooperatively to develop commercial and recreational fishery
regulations for black sea bass from Maine through Cape Hatteras, North Carolina. The Council
and Commission work in conjunction with NMFS, which serves as the federal implementation and
enforcement entity. This cooperative management system was developed because a significant
portion of the catch is taken from both state waters (0-3 miles offshore) and federal waters (3-200
miles offshore). This joint management program began in 1996 with the approval of amendment
9 to the Summer Flounder, Scup, and Black Sea Bass Fishery Management Plan (FMP). The
original FMP and subsequent amendments and framework adjustments are available at:
www.mafmc.org/fisheries/fmp/sf-s-bsb.
Commercial and recreational black sea bass fisheries are managed using catch and landings limits,
minimum fish sizes, open and closed seasons, gear regulations, permit requirements, and other
regulations.
The Council’s Scientific and Statistical Committee (SSC) recommends annual Acceptable
Biological Catch (ABC) levels for black sea bass. The Council must either approve the ABC
recommended by the SSC or a lower ABC. The ABC is divided into commercial and recreational
Annual Catch Limits (ACLs) based on the allocations prescribed in the FMP (i.e., 49%
commercial, 51% recreational, applied to the portion of the ABC that is expected to be landed)
and the recent distribution of discards between the commercial and recreational fisheries. These
4allocations have been in place since 1998. The Council and Commission are considering an
ongoing FMP amendment to determine if these allocation percentages should be revised to reflect
more recent data.5
The Council and Commission also approve commercial and recreational annual catch targets
(ACTs), which are set equal to or less than the respective ACLs to account for management
uncertainty. To date, the black sea bass ACTs have always been set equal to the ACLs. The ABC,
ACLs, and ACTs are catch limits which account for both landings and discards, while the
commercial quota and recreational harvest limit (RHL) are landing limits. The commercial quota
and RHL are calculated by subtracting expected discards from the respective ACTs.
COVID-19 Data Impacts in 2020
The COVID-19 pandemic impacted data collection in both the recreational and commercial
fisheries. Commercial effort and markets were impacted by COVID-19 to various degrees;
however, data collection for commercial landings from seafood dealers continued uninterrupted.
Commercial discard estimates for 2020 will be affected by missing observer data. Commercial
discard estimates are developed using approaches that rely heavily on observer data. On March
20, 2020, NMFS temporarily waived the requirement for vessels with Greater Atlantic permits to
carry a fishery observer or at-sea monitor. This waiver was extended several times before observers
were redeployed on August 14, 2020. At this time it is not clear whether alternative methodologies
will be developed to generate 2020 commercial discard estimates for black sea bass and other
species.
The COVID-19 pandemic disrupted the recreational Access Point Angler Intercept Survey
(APAIS). All New England and Mid-Atlantic states suspended APAIS sampling starting in late
March or April 2020. APAIS sampling resumed between May and August 2020, depending on the
state. NMFS used imputation methods to fill gaps in 2020 catch data with data collected in 2018
and 2019. These proxy data match the time, place, and fishing mode combinations that would have
been sampled had the APAIS continued uninterrupted. Proxy data were combined with observed
data to produce catch estimates using the standard estimation methodology. The mail and
telephone surveys that collect recreational effort data continued largely uninterrupted. NMFS has
indicated that when complete 2021 recreational data are available in 2022, they will evaluate the
effects of including 2021 data (for example, alongside 2019 data and instead of 2018 data) in the
imputation. Because these effects are unknown, the agency cannot predict whether they will seek
to revise they 2020 catch estimates.
Fishery Landings Summary
Table 2 shows black sea bass catch and landings limits from 2011 through 2021, as well as
commercial and recreational landings through 2020. Total landings (commercial and recreational)
peaked in 2017 at 15.5 million pounds. About 13.26 million pounds of black sea bass were landed
by commercial and recreational fishermen from Maine through Cape Hatteras, North Carolina in
2020 (Figure 3).6,7
5Table 2: Summary of catch and landings limits, and landings for commercial and recreational black sea bass fisheries from Maine
through Cape Hatteras, NC 2010 through 2021. All values are in millions of pounds unless otherwise noted.6,7
Management measure 2011a 2012a 2013a 2014a 2015a 2016b 2017c 2018c 2019c 2020c 2021d
ABC 4.50 4.50 5.50 5.50 5.50 6.67 10.47 8.94 8.94 15.07 17.45
Commercial ACL & ACT -- 1.98 2.60 2.60 2.60 3.15 5.09 4.35 4.35 6.98 9.52
Commercial quotae 1.71 1.71 2.17 2.17 2.21 2.71 4.12 3.52 3.52 5.58 6.09
Commercial landings 1.69 1.72 2.26 2.40 2.38 2.59 4.01 3.46 3.53 4.21 --
% of com. quota landed 99% 101% 104% 111% 108% 96% 97% 98% 100% 75% --
Recreational ACL & ACT -- 1.86 2.90 2.90 2.90 3.52 5.38 4.59 4.59 8.09 7.93
RHLe 1.78 1.32 2.26 2.26 2.33 2.82 4.29 3.66 3.66 5.81 6.34
Recreational landings, old
1.17 3.18 2.46 3.67 3.79 5.19 4.16 3.82 -- -- --
MRIP estimates
Recreational landings,
3.27 7.04 5.68 6.93 7.82 12.05 11.50 7.92 8.61 9.05f --
revised MRIP estimates
% of RHL harvested (based on
old MRIP estimates through 2018; 66% 241% 109% 162% 163% 184% 97% 104% --h 156% --
g
new MRIP estimates for 2020)
a
Measures in 2010-2015 were based on a constant catch approach used by the Council’s SSC to set the ABC.
b
Measures in 2016 were based on ABC that was set using a data poor management strategy evaluation approach.
c
Measures in 2017-2021 were set based on a peer reviewed and approved stock assessment. The 2020-2021 measures are based on a stock assessment update that
incorporated the revised time series of MRIP data.
d
The 2021 measures account for revisions to the Council’s risk policy.
e
The commercial quotas and RHLs for 2006-2014 account for deductions for the Research Set Aside program.
f
2020 recreational estimates were developed using imputation methods (incorporating 2018 and 2019 data) to account for missing 2020 APAIS data.
g
The percent of RHL harvested is based on a comparison of the RHL to the previous or old MRIP estimates. The RHLs through 2019 did not account for the new
MRIP estimates; therefore, it would be inappropriate to compare RHLs through 2019 to the revised MRIP estimates.
h
2019 estimates in the “old MRIP units” are not available. The 2019 RHL should not be compared to harvest in the new MRIP units because it did not account for
revisions to the data.
618 Commercial
Recreational
16 Total
Landings (millions of pounds)
14
12
10
8
9.05
6
4
2 4.21
0
1981
1982
1983
1984
1985
1986
1987
1988
1989
1990
1991
1992
1993
1994
1995
1996
1997
1998
1999
2000
2001
2002
2003
2004
2005
2006
2007
2008
2009
2010
2011
2012
2013
2014
2015
2016
2017
2018
2019
2020
Figure 3: Commercial and recreational black sea bass landings in millions of pounds from Maine
through Cape Hatteras, North Carolina, 1981-2020. Recreational landings are based on the revised
MRIP estimates.6,7
Commercial Fishery
About 4.21 million pounds of black sea bass were landed in the commercial fishery in 2020. This
is the highest amount of landings in the time series of available data from 1981 through 2020.
Commercial black sea bass landings generally follow the coastwide quota and the 2020 quota of
5.58 million pounds was higher than any previous quota (Table 2, Figure 3). The 2020 quota was
not fully harvested in large part due to impacts of the COVID-19 pandemic on market demand.
Commercial black sea bass landings were lowest in 2009, when 1.18 million pounds were landed
and the lowest quota in the time series was implemented (1.09 million pounds).7
Black sea bass are a valuable commercial species. Total ex-vessel value averaged $11.57 million
per year during 2018-2020. Landings and average price per pound (adjusted to 2020 dollars) were
generally stable from 2010 through 2016. Landings increased in 2017 with an increase in the quota.
On an annual coastwide level, the average price per pound tended to decrease with increases in
landings since 2016 (Figure 4).7 Prices are impacted by many factors in addition to landings. The
relationship between landings and price varies at the regional, state, and sometimes port level
based on market demand, state-specific regulations (e.g., seasonal openings), or individual trawl
trips with high landings, all of which can be inter-related.
Over 183 federally-permitted dealers from Maine through North Carolina purchased black sea bass
in 2020. More dealers bought black sea bass in New York than in any other state (Table 3).7
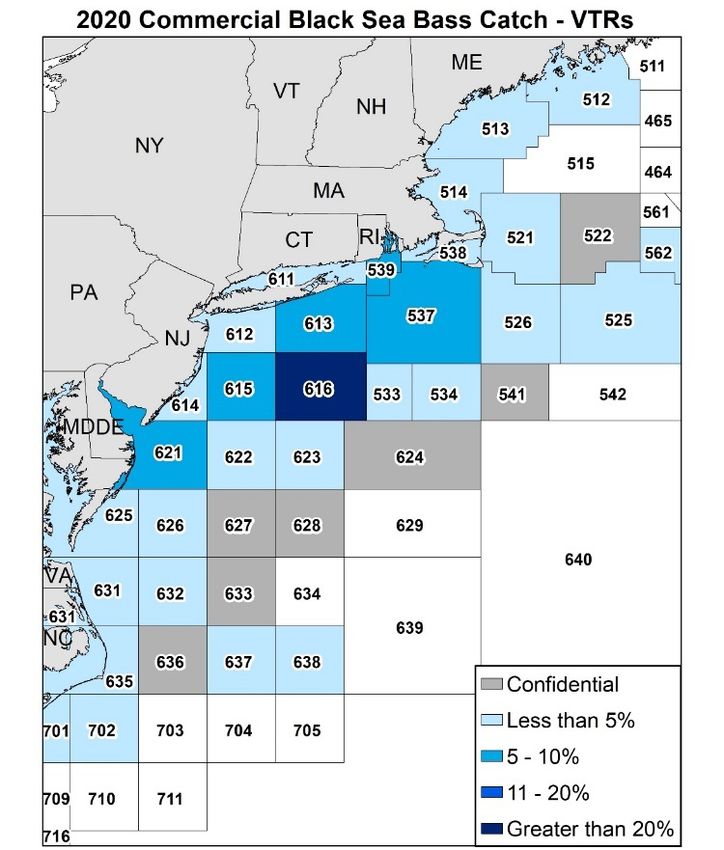
According to federal VTR data, statistical area 616, which includes important fishing areas near
Hudson Canyon, was responsible for the largest percentage (38%) of commercial black sea bass
catch (landings and dead discards, as reported by captains) in 2020. Statistical area 621, off
southern New Jersey, Delaware, and Maryland accounted for the second highest proportion of
catch (8%), followed by statistical area 613, south of Long Island (8%); statistical area 615 off
New Jersey (8%); statistical area 537, south of Massachusetts and Rhode Island (6%); and
statistical area 539, inshore of area 537 (5%; Table 4, Figure 5). Statistical area 539 had the highest
7number of trips which reported black sea bass catch on federal VTRs in 2020 (2,102 trips),
followed by statistical area 613 (1,092 trips).8
In 2020, most commercial black sea bass landings from state and federally-permitted vessels
occurred in New Jersey (26%), followed by Massachusetts (17%), Rhode Island (13%), Virginia
(12%), and Maryland (10%).7
The percentage of landings by state is generally driven by and closely matches the state-by-state
commercial quota allocations that have been in place since 2003. States set measures to achieve
their state-specific commercial quotas. In February 2021, the Council and the Commission’s
Summer Flounder, Scup, and Black Sea Bass Management Board approved changes to these
allocations to partially account for biomass distribution. The State of New York successfully
appealed the February 2021 decision and, as a result, further revisions to these allocations are
expected later in 2021.9
At least 100,000 pounds of black sea bass were landed in each of 11 ports in 8 states from Maine
through North Carolina in 2020. These 11 ports collectively accounted for over 67% of all
commercial black sea bass landings in 2020 (Table 5).7
A moratorium permit is required to fish commercially for black sea bass in federal waters. In 2020,
710 federal commercial black sea bass permits were issued.10
A minimum commercial black sea bass size limit of 11 inches total length has been in place in
federal waters since 2002. There is no federal waters black sea bass possession limit; however,
states set possession limits for state waters.
About 72% of commercial black sea bass landings reported on federal VTRs in 2020 were caught
with bottom otter trawl gear, 24% with pots/traps, and 3% with hand lines. Other gear types each
accounted for 1% or less of total commercial landings reported on VTRs in 2020.8 It is important
to note that federal VTR data do not account for landings of black sea bass by vessels that are only
permitted to fish in state waters. Some gear types (e.g., handlines) are more prevalent in state
waters than in federal waters.
Any federally-permitted vessel which uses otter trawl gear and catches more than 500 pounds of
black sea bass from January through March, or more than 100 pounds from April through
December, must use nets with a minimum mesh size of 4.5-inch diamond mesh applied throughout
the codend for at least 75 continuous meshes forward of the end of the net. Pots and traps used to
commercially harvest black sea bass must have two escape vents with degradable hinges in the
parlor. The escape vents must measure 1.375 inches by 5.75 inches if rectangular, 2 inches by 2
inches if square, or have a diameter of 2.5 inches if circular.
8Landings Ex-vessel value Avg price per pound
14 4.50
Landings (millions of lb) or Value
12 4.00
(millions of $, adjusted)
3.50
Price ($/lb, adjusted)
10
3.00
8 2.50
6 2.00
1.50
4
1.00
2 0.50
0 0.00
1996
1998
2000
2002
2004
2006
2008
2010
2012
2014
2016
2018
2020
Figure 4: Landings, ex-vessel value, and average price for black sea bass, ME-NC, 1996-2020.
Ex-vessel value and price are inflation-adjusted to 2020 dollars using the Gross Domestic Product
Price Deflator.7
Table 3: Number of dealers, by state, reporting purchases of black sea bass in 2020. C =
confidential.7
State ME NH MA RI CT NY NJ DE MD VA NC
Number of dealers C 0 28 28 12 43 28 4 8 13 19
Table 4: Statistical areas that accounted for at least 5% of the total commercial black sea bass
catch (landings and dead discards) in 2020 based on federal VTRs, with associated number of
trips.8 Federal VTR data do not capture landings by vessels only permitted to fish in state waters.
Percent of 2020 Commercial
Statistical Area Number of Trips
Black Sea Bass Catch
616 38% 587
621 8% 222
613 8% 1,092
615 8% 168
537 6% 828
539 5% 2,102
9Figure 5: Proportion of black sea bass catch (landings and dead discards) by statistical area in
2020 based on federal VTR data. Confidential areas are associated with fewer than three vessels
and/or dealers. Confidential areas collectively accounted for less than 1% of commercial catch
reported on VTRs in 2020. The amount of catch not reported on federal VTRs (e.g., catch from
vessels permitted to fish only in state waters) is unknown. In 2019, Northeast Fisheries Science
Center Data (“AA tables”) suggest that 20% of total commercial landings (state and federal) were
not associated with a statistical area reported in federal VTRs; AA data for 2020 are not available.8
Table 5: Ports reporting at least 100,000 pounds of black sea bass landings in 2020, associated
number of vessels, and percentage of total commercial landings. C = confidential.7
% of total
Pounds of black Number of vessels
Port name commercial black
sea bass landed landing black sea bass
sea bass landed
Point Pleasant, NJ 682,754 16% 37
Ocean City, MD 396,825 9% 9
Point Judith, RI 395,813 9% 148
New Bedford, MA 289,393 7% 57
Montauk, NY 229,432 5% 91
Cape May, NJ 211,373 5% 30
Hampton, VA 208,316 5% 23
Newport News, VA 157,717 4% 14
Beaufort, NC 141,486 3% 42
Sea Isle City, NJ 131,149 3% 9
Lewes, DE C C C
10Recreational Fishery
The Council develops coast-wide regulations for the recreational black sea bass fishery in federal
waters, including a minimum fish size limit, a possession limit, and open and closed seasons (Table
6). The Commission and member states develop recreational measures in state waters (Table 7).
In July 2018, MRIP released revisions to their time series of recreational catch and landings
estimates based on adjustments for a revised angler intercept methodology and a new effort
estimation methodology, namely a transition from a telephone-based effort survey to a mail-based
effort survey. The revised estimates of catch and landings are several times higher than the
previous estimates for shore and private boat modes, substantially raising the overall black sea
bass catch and harvest estimates. The RHLs and other management measures through 2019 were
based on the previous MRIP estimates and should not be compared against the revised MRIP
estimates. The revised MRIP estimates were incorporated into the stock assessment in 2019 and
were used to derive the catch and landings limits for 2020 and beyond.
According to the most recent MRIP data, between 1981 and 2020, recreational catch (landings and
live and dead discards) of black sea bass from Maine through Cape Hatteras, NC was lowest in
1984 at 4.73 million fish and was highest in 2017 at 41.19 million fish. Recreational harvest in
weight was highest in 2016 at 12.05 million pounds; however, harvest in numbers of fish was
highest in 1986 at 19.28 million fish. Recreational harvest in weight was lowest in 1981 at 1.53
million pounds, while harvest in numbers of fish was lowest in 1998 at 1.56 million fish.6
It should be noted that the coastwide 2016 and 2017 MRIP estimates for black sea bass are viewed
as outliers by the Monitoring and Technical Committees and the Scientific and Statistical
Committee due to the influence of very high estimates in individual states and waves (i.e., New
York 2016 wave 6 for all modes and New Jersey 2017 wave 3 for the private/rental mode). Steps
have been taken to address uncertainty in these specific estimates in the stock assessment and in
management.
In 2020, an estimated 4.23 million black sea bass, at about 9.05 million pounds, were harvested by
recreational anglers from Maine through Cape Hatteras, North Carolina (Figure 3, Table 9).6 This
represents a 56% overage of the 2020 RHL (Table 2). The Council and Board agreed to leave the
recreational bag, size, and season limits unchanged in 2020 despite an expected RHL overage.
This was viewed as a temporary solution to allow more time to consider how to fully transition the
management system to use of the revised MRIP data, including ongoing considerations related to
the commercial/recreational allocation and the Recreational Reform Initiative. The 2020 RHL
overage will be discussed in development of 2022 recreational measures but is unlikely to impact
the 2022 RHL and ACL given recent biomass estimates and the Council’s Accountability
Measures.11
In 2020, 56% of black sea bass harvested by recreational fishermen from Maine through North
Carolina (in numbers of fish) were caught in state waters and 44% in federal waters (Table 9).
Most of the recreational harvest in 2020 was landed in New York (30%), followed by New Jersey
(19%), Rhode Island (15%), and Massachusetts (14%).6
For-hire vessels carrying passengers in federal waters must obtain a federal party/charter permit.
In 2020, 850 vessels held a federal party/charter permit.10
About 86% of the recreational black sea bass harvest in 2020 came from anglers fishing on private
or rental boats, about 12% from anglers aboard party or charter boats, and 2% from anglers fishing
11from shore (Table 11).6 Party and charter fishing was restricted in all states for part of 2020 due to
the COVID-19 pandemic.
Table 6: Federal black sea bass recreational measures, Maine - Cape Hatteras, NC, 2007 - 2020.6
Year Min. size Bag limit Open season
2007-2008 12” 25 Jan 1 - Dec 31
2009 12.5” 25 Jan 1 - Oct 5
2010-2011 12.5” 25 May 22 - Oct 11; Nov 1 - Dec 31
2012 12.5” 25 May 19 - Oct 14; Nov 1 - Dec 31
2013 12.5” 20 Jan 1 - Feb 28; May 19 - Oct 14; Nov 1 - Dec 31
2014 12.5” 15 May 19 - Sept 18; Oct 18 - Dec 31
2015-2017 12.5” 15 May 15 - Sept 21; Oct 22 - Dec 31
2018-2021 12.5” 15 Feb 1 - 28; May 15 - Dec 31
Table 7: State waters black sea bass recreational measures in 2018-2021. The only changes made
during these years were to maintain a Saturday opening (Massachusetts) or to account for harvest
in the February opening (Virginia and North Carolina). 6
Bag
State Min. Size Open Season
Limit
Maine 13” 10 May 19 - Sept 21; Oct 18 - Dec 31
New Hampshire 13” 10 Jan 1 - Dec 31
2018: May 19 - Sept 12
Massachusetts 15” 5 2019 & 2020: May 18 - Sept 8
2021: May 18 – Sept 8
3 Jun 24 - Aug 31
Rhode Island 15”
7 Sept 1 - Dec 31
Connecticut private & shore 15” 5 May 19 - Dec 31
CT authorized party/charter 5 May 19 - Aug 31
15”
monitoring program vessels 7 Sept 1- Dec 31
3 Jun 23 - Aug 31
New York 15”
7 Sept 1- Dec 31
10 May 15 - Jun 22
12.5” 2 Jul 1- Aug 31
New Jersey
10 Oct 8 - Oct 31
13” 15 Nov 1 - Dec 31
Delaware 12.5” 15 May 15 - Dec 31
Maryland 12.5” 15 May 15 - Dec 31
2018: Feb 1 - 28; May 15 - Dec 31
2019: Feb 1-28; May 15-31; June 22-Dec 31
Virginia 12.5” 15
2020: Feb 1 - 29; May 29 - Dec 31
2021: Feb 1-28; May 15-May 31; Jun 16-Dec 31
2018: Feb 1 - 28; May 15 - Dec 31
North Carolina, North of 2019: Feb 1 - 28; May 17 - Dec 31
12.5 15
Cape Hatteras (35° 15’N) 2020: Feb 1 - 29; May 17 - Nov 30
2021: May 15 - Dec 31
12Table 8: Estimated recreational black sea bass catch (harvest and live and dead discards) and
harvest from Maine through Cape Hatteras, North Carolina, 2011-2021, based on the revised
MRIP estimates.6
Catch Harvest Harvest % of catch
Year
(millions of fish) (millions of fish) (millions of pounds) retained
2011 12.47 1.78 3.27 14%
2012 34.95 3.69 7.04 11%
2013 25.71 3.01 5.68 12%
2014 23.29 3.81 6.93 16%
2015 23.17 4.39 7.82 19%
2016 35.80 5.84 12.05 16%
2017 41.19 5.70 11.50 14%
2018 24.99 3.99 7.92 16%
2019 32.32 4.38 8.61 14%
2020 34.11 4.23 9.05 12%
Table 9: Estimated percentage of black sea bass recreational harvest (in numbers of fish) in state
and federal waters, from Maine through North Carolina, 2011-2021, based on the revised MRIP
estiamtes.6
Year State waters Federal waters
2011 65% 35%
2012 69% 31%
2013 67% 33%
2014 68% 32%
2015 69% 31%
2016 59% 41%
2017 40% 60%
2018 61% 39%
2019 62% 38%
2020 56% 44%
2011-2020 average 60% 40%
2018-2020 average 59% 41%
13Table 10: State-by-state contribution to total recreational harvest of black sea bass (in number of
fish), Maine through Cape Hatteras, North Carolina, 2018 - 2020, based on the revised MRIP
estimates.6
State 2018 2019 2020 2018-2020 average
Maine 0.0% 0.0% 0.0% 0.0%
New Hampshire 0.0% 0.0% 0.0% 0.0%
Massachusetts 17.0% 12.0% 13.6% 14.1%
Rhode Island 17.7% 11.8% 14.6% 14.6%
Connecticut 9.5% 11.8% 9.6% 10.3%
New York 21.4% 36.0% 30.1% 29.4%
New Jersey 26.0% 19.0% 19.2% 21.3%
Delaware 2.2% 1.0% 3.3% 2.2%
Maryland 3.9% 3.0% 1.9% 2.9%
Virginia 2.2% 5.3% 6.5% 4.7%
North Carolina 0.2% 0.1% 1.1% 0.5%
Table 11: Percent of total recreational black sea bass harvest (in numbers of fish) by recreational
fishing mode, Maine through Cape Hatteras, North Carolina, 2011-2020, based on the revised
MRIP estimates.6
Year Shore Party/charter Private/rental Total Number of Fish
2011 3% 21% 76% 1,782,519
2012 1% 19% 80% 3,690,188
2013 2% 9% 89% 3,014,535
2014 3% 16% 81% 3,806,448
2015 0% 12% 88% 4,392,452
2016 4% 9% 88% 5,841,460
2017 1% 9% 90% 5,704,072
2018 1% 12% 86% 3,992,628
2019 3% 18% 79% 4,377,491
2020 2% 12% 86% 4,227,860
2011-2020 avg 2% 13% 85% 4,082,965
14References
1
Drohan, A.F., J. P. Manderson, D. B. Packer. 2007. Essential fish habitat source document: black
sea bass, Centropristis striata, life history and habitat characteristics, 2nd edition. NOAA
Technical Memorandum NMFS NE 200.
2
Northeast Fisheries Science Center. 2017. 62nd Northeast Regional Stock Assessment Workshop
(62nd SAW) Assessment Report. Northeast Fisheries Science Center Reference Doc. 17-03. 822
p. Available at: https://www.nefsc.noaa.gov/publications/crd/crd1703/
3
Blaylock, J. and G.R. Shepherd. 2016. Evaluating the vulnerability of an atypical protogynous
hermaphrodite to fishery exploitation: results from a population model for black sea bass
(Centropristis striata). Fishery Bulletin 114(4): 476-489.
4
Northeast Fisheries Science Center. 2019. Prepublication copy of the August 2019 operational
stock assessment report prepared for the Council and the SSC. Available at:
http://www.mafmc.org/ssc-meetings/2019/september-9-11
5
More information on the Summer Flounder, Scup, and Black Sea Bass Commercial/Recreational
Allocation Amendment is available at: https://www.mafmc.org/actions/sfsbsb-allocation-
amendment.
6
Personal communication from the National Marine Fisheries Service, Fisheries Statistics
Division. Accessed June 2021. Available at: https://www.fisheries.noaa.gov/data-
tools/recreational-fisheries-statistics-queries
7
Unpublished NMFS commercial fish dealer data (i.e., “DERS”), which include both state and
federal dealer data).
8
Unpublished NMFS VTR data.
9
More information on the Black Sea Bass Commercial State Allocation Amendment/Addendum
is available at: https://www.mafmc.org/actions/bsb-commercial-allocation.
10
Unpublished NMFS permit data.
11
A summary of the accountability measures is available at: https://www.mafmc.org/s/AMs-
description_SF_scup-BSB_Dec2020.pdf
15You can also read


