Analyzing the National Football League is challenging, but player tracking data is here to help
←
→
Page content transcription
If your browser does not render page correctly, please read the page content below
Research note
arXiv:1909.10631v1 [stat.AP] 23 Sep 2019

 Michael J. Lopez*
 Analyzing the National Football
 League is challenging, but player
 tracking data is here to help

 Abstract: Most historical National Football League (NFL) analysis, both main-
 stream and academic, has relied on public, play-level data to generate team and
 player comparisons. Given the number of oft omitted variables that impact on-field
 results, such as play call, game situation, and opponent strength, findings tend
 to be more anecdotal than actionable. With the release of player tracking data,
 however, analysts can better ask and answer questions to isolate skill and strat-
 egy. In this article, we highlight the limitations of traditional analyses, and use a
 decades-old punching bag for analysts – fourth-down strategy – as a microcosm for
 why tracking data is needed. Specifically, we assert that, in absence of a previously
 unmeasured variable, past findings supporting an aggressive fourth down strategy
 may have been overstated. Next, we synthesize recent work that comprises this
 special Journal of Quantitative Analysis in Sports issue into player tracking data
 in football. Finally, we conclude with some best practices and limitations regarding
 usage of this data. The release of player tracking data marks a transition for the
 league and its’ analysts, and we hope this issue helps guide innovation in football
 analytics for years to come.

 Keywords: National Football League; player tracking; causal inference; fourth downs

 1 The problem with football data
 Across the physical and social sciences, the gold standard for identifying causes and
 effects of certain behaviors, therapies, or interventions is the randomized experiment.
 Randomization is attractive because subjects that receive one treatment are, in
 expectation, comparable to those that receive another treatment. When examining
 an outcome of interest in a randomized trial, one can be confident that there are no
 underlying and unmeasurable differences (e.g, confounding variables) that would

 *Corresponding author: Michael J. Lopez, National Football League
2 Lopez

be responsible for causing said results. Succinctly – randomized designs ensure that
apples are compared to apples.
 Analyzing football data is like that, except the opposite. That is, all virtually
all football data is observational, which means that any study of athlete or team
behavior is potentially confounded by other variables linked to the game or player.
Because of this, it is often quite difficult to rule out whether extraneous factors
related to players and games are responsible for findings. In football, we rarely get
to compare apples to apples.
 Consider the well-established argument in NFL analytics circles that teams
should pass more and run less (Kovash and Levitt, 2009; Hermsmeyer, 2018). Unlike
what would happen in randomized designs, teams don’t flip a coin to decide if
they’ll attempt a pass. Instead, coaches call a pass play based on, among other
factors, quarterback skill, game situation, and opposing defense, many of which
are traits that likely differ from settings that call for run plays. Certain drivers of
play choice, including down, distance needed for a first down, and score differential,
are known prior to a play. But several other variables, such as quarterback health,
defensive formation and personnel, and pre-snap movement, are both (i) likewise
linked to whether or not a team attempts a pass, and (ii) difficult to quantify.
 Not only are there several factors that go into NFL play-calling, but many
cannot be measured using traditional data. An artifact of the NFL’s historical
data collection is that the hundreds of player movements and decisions in a play
are reduced to one observation, one row in a data set. Worse, at least in terms of
public data, most of the 22 players on the field at a given time aren’t even recorded
as being there (Schatz, 2005). At around 160 plays per game, it is feasible to look
at play-level outcomes such as win probability, expected points, run/pass strategy,
and fourth down behavior, while conditioning on what we know about plays before
they happen. But both before and within a play, events in football are reactionary.
Substitutions by one team lead to changes in personnel by the other. Formations
by the defense lead to audibles by the offense. Motion from the slot back spurs a
new defensive coverage scheme. And even after the play, hip placement of defensive
backs creates new cuts from wide receivers and a lineman’s first step signals an
opposing linebacker’s read. Under this complex interplay, nothing is as simple as
whether or not a team’s coach called a passing play, which makes trying to untangle
the marginal effect of passing versus running exceedingly difficult. Thus, even
when conditioning on several variables, such as Hermsmeyer (2018), which includes
number of defenders near the line-of-scrimmage and other play and game-level
characteristics, we are likely not accounting for something else.
 Why do these differences matter? The answer lies in how we leverage analytical
insight to impact the game. It means one thing to find that passing results in better
outcomes (yards per play, expected yards per play, win probability added) than run
NFL player tracking intro 3

plays. Analysis can be improved by conditioning on traits such as down, distance,
and formation. But it means substantially more to find that among teams that ran
the ball, they’d have been better off had they passed more often. This is a tricky
but important distinction. This second claim is a causal one, and cannot be made
with certitude unless we are able to condition on all relevant football variables.
Researchers are unable to condition on variables we do not have, which jeopardizes
any attempt to establish causality in football.
 Beginning in 2016, those 160 observations per game turned into roughly 300,000.
That season, each player was equipped with radio-frequency identification (RFID)
chips in each of his shoulder pads, observations that provide the location of each
player at roughly 10 frames-per-second, wherever he goes on the field. From player
movement, it is straightforward to calculate speed, angle, and acceleration. These
data are termed the NFL’s "Next Gen Stats" (see ℎ : // . . /
for more insight and summary metrics). For the first time, analysts can dig beyond
play-level analyses to better understand the game. Variables that used to only show
up in scouting reports – ones such as route type, running back space, or defensive
back coverage – can now be estimated directly from data. Soon, analysts will be
breaking down a game before their coaches have even watched the film.
 Given the novelty of player tracking data, much remains unknown about the
questions that can be answered from it. But for statisticians, the goal should be
clear – how can we leverage this data to ensure we are comparing apples to apples?

2 The importance of unmeasured confounding:
 a unique example
Over the last several years, the lowest hanging fruit among NFL analytics enthusiasts
has been team behavior on fourth down. Authors as far back as Carter and Machol
(1978), and including more recent work from Romer (2006), Burke et al. (2013),
and the author of this manuscript (Yam and Lopez (2019)), have argued that teams
are too passive on fourth down. Roughly, it has been argued that a more aggressive
strategy is worth 0.4 wins per year (Romer, 2006; Yam and Lopez, 2019). In a
limited 16-game season, that fractional gain takes on an added importance.
 Traditional fourth-down analyses has compared play outcomes (such as success
rates, expected points, or win probability) before and after potential conversion
attempts. The crux of these works requires some level of extrapolation regarding
the outcomes for teams that did not go for it, if they were instead to have gone for
it. For example, Romer (2006) used success rate, Burke and Quealy (2013) used
4 Lopez

expected points, and Yam and Lopez (2019) used win probability, all to imply that
teams that did not go for it would have been better off going for it.
 Each fourth-down analysis framework mentioned above assumed some level of
equipoise between teams that did not go for it and those that did. Yam and Lopez
(2019) went as far as using propensity-score based matching techniques to ensure
that teams that did not go for it were compared to similar teams that did go for it.
But even the most novel of matching techniques designed for observational data
cannot get around the limitation of unmeasured confounding. That is, what if there
was an unmeasured characteristic of teams that went for it that fundamentally
differed from those that did not go for it, one that simultaneously impacted both
coaches’ decisions and play outcomes?
 Turns out, there is one – the actual distance needed for a first down.

2.1 How actual distance impacts fourth-down strategy

In the gathering and disseminating of play-by-play data, NFL game-day assistants
assign an integer value to each distance needed for a first down. All distances
between 0 and 2 yards (not inclusive) are supposed to be listed as 4th-and-1’s, with
successive buckets consisting of one-yard intervals. So, both 4th-and-0.1 inches
and 4th-and-71.9 inches are listed as 4th-and-1’s. Likewise, distances of 4th-and-72
inches to 4th-and-107.9 inches are intended to be listed as 4th-and-2’s.
 Figure 1 shows two pairs of density plots containing the distributions of actual
yards needed for a first down, comparing the distance on the RFID chip embedded
in the football (prior to the ball snap) to the RFID chip in the sideline chain.1 The
chart is split by the integer categorization in the NFL play-by-play data (either a
4th-and-1 or a 4th-and-2).
 Teams that went for it on 4th-and-1 did so from an average of 0.78 yards away
from the line to gain; teams that did not go for it, meanwhile, were 0.99 yards
away. On 4th-and-2 plays, teams that went for it did so from an average of 2.02
yards away, while those that did not averaged 2.10 yards away.2

1 On goal-to-go plays, the actual distance needed for the first down is the difference
between the ball RFID chip and the goal-line.
2 We also used a second data wrangling strategy, where we identified the distance needed
for a first down by using ten-yards from the original spot where each ball was marked
on first down (with an exception taken for goal-line plays). On fourth-down plays, the
differences between teams that went for it and teams that did not go for it were slightly
larger than the ones shown here.
NFL player tracking intro 5

 Actual 4th down distances by yard line group
 2017/18 regular seasons
 4th−1 4th−2

 0
 Line to gain Line to gain
 Distance needed for a first down

 1

 Went for it?
 FALSE
 2
 TRUE

 3

 4

 0.00 0.25 0.50 0.75 0.00 0.25 0.50 0.75
 Density

Fig. 1: Exact distances needed for a first down, split by teams that went for it (yes/no) and
NFL play-by-play yard line categorization (4th-and-1, 4th-and-2). Teams that went for it did
so from shorter distances within each yard line group.
6 Lopez

 (a) Likelihood of going for it on 4th−down (b) Likelihood of converting on 4th−down
 1.00 1.00

 0.75 0.75
 % of plays

 Percent
 0.50 0.50

 0.25 0.25

 0.00 0.00
 0 1 2 3 0 1 2 3
 Actual distance needed Actual distance needed

Fig. 2: Likelihood of going for it (left side) on 4th-down, and likelihood of a successful con-
version (right side) on 4th-down. Each line shows the estimates from a generalized model of
outcome (either going for it, or of successfully going for it) given the actual distance needed
for a first down. Teams with shorter distances are more likely to go for it and to convert.

 The actual distance needed for a first down yardage impacts both the attempt
rate (among all teams) and the success rate (among teams that went for it), as
shown in Figure 2. The left side of Figure 2 provides estimates from a generalized
additive model (GAM) of attempt rate (Did teams go for it (Y/N), conditional on
the actual distance needed for a first down), fit using 2017 and 2018 fourth down
plays. Teams in 4th-and-inches went for it about 70% of the time, while teams in
*long* 4th-and-1 situations went for it about 30% of the time. The right side of
Figure 2 highlights how the rate of success varied based on actual distance needed
for a first down, using estimates from a separate generalized additive model (Did
teams gain a first down (Y/N), conditional on the actual distance needed). On
4th-and-inches, teams converted roughly 82% of the time, while in *long* 4th-and-1
situations, they converted around 55% of the time.
 What does this imply?
 Because they had further to go for a first down, teams that did not go for it
did not have the same chances for success as the teams that did go for it. Thus,
findings that inferred success rates, expected points, or win probability outcomes
from teams that went for it almost assuredly overestimated the benefit of going for
it on fourth down. For years, we failed to compare apples to apples.
 Interestingly, although the GAM’s in Figure 2 allow for a non-linear relationship
between distance and each outcome, each curve looks somewhat linear. If we instead
fit a line using the integer categorization of distance, we would see roughly the same
NFL player tracking intro 7

figure. That is, even though we were able to use more precise data, our results still
matched how we could have predicted coaches to behave using only static data.
 Replicating the approach of Yam and Lopez (2019) can help approximate what
this means as far as the value of 4th-down aggressiveness. While those authors used
data from prior to the 2016 season, we use the 2017 and 2018 seasons only, with an
identical approach and code provided at ℎ : // ℎ . / / −
 ℎ − / / / . We replicate under two scenarios. First, we
use the play-by-play distance category to check results over the past two seasons.
Second, we use the actual distance that the offense needed for a first down in place
of the interger distance. As in Yam and Lopez (2019), we only use plays in the “go
for it” range of the 4th-down-bot (Burke et al., 2013).
 Using the play-by-play distance category (4th-and-1, 4th-and-2, etc), we find
that an aggressive fourth-down strategy would have been worth, in expectation, an
extra 0.27 wins per-team per-year during the 2017 and 2018 seasons. Among teams
that did not go for, we find an estimated 3.3% difference in win probability added
per-play had they instead gone for it (95% CI, 1.9% to 4.7%). This is somewhat in
line with the original findings, with a slight drop likely driven by recent upticks in
team aggressiveness on fourth down (Stuart, 2017).
 When using the actual distance needed for a first down (instead of the integer
distance), the benefit of an aggressive fourth-down strategy drops to an extra
0.14 wins per year. Alternatively, the average difference in win probability added
per-play is estimated at 2.0% (95% CI, 0.0% to 3.9%). For both per-play win
probability and per-team benefit in terms of wins-added per-year, roughly 45%
of the benefit to an aggressive fourth down strategy is negated when accounting
for actual distance needed for a first down, a previously unmeasured confounding
variable.
 Though this attenuation of the effect size matches our intuition that going for it
on fourth down is generally less advisable from longer distances, the primary lesson
here extends beyond 4th-down strategy. Indeed, there could be other reasons why
the benefit of aggressive approach remains underestimated (Romer, 2006). Instead,
we aim to highlight the surprising insight that tracking data can provide. Repeated
analyses of something in the game of football, in this case, fourth downs, had told
us that coaches should “stop being stupid” with how they were acting (Cheema,
2019). But there was more to the story, in this case something intrinsically different
about teams that went for it and teams that did not, which was responsible for at
least part of the original findings.
 Indeed, in football, there’s almost always more to the story.
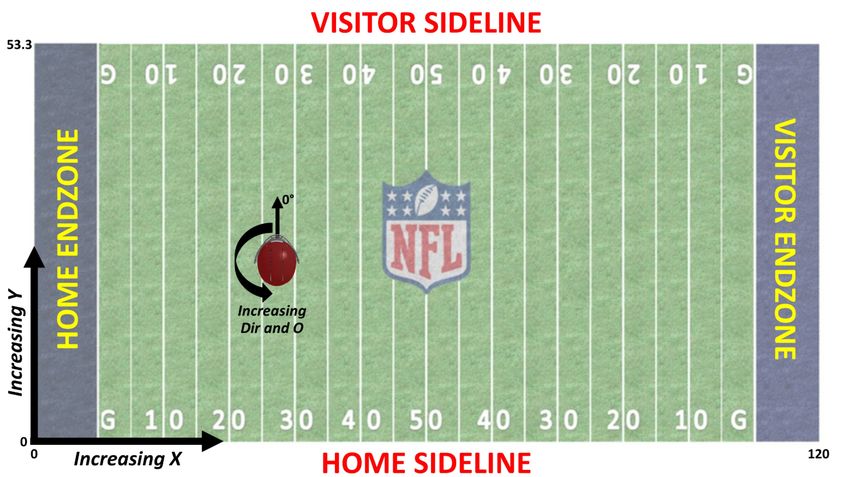
8 Lopez

3 Crowdsourcing insight into player tracking
 data
Papers accepted into this special issue of the Journal of Quantitative Analysis in
Sports highlight the multitude of ideas where such apples-to-apples comparisons
are now, more than ever, feasible.
 Each of these papers stem from the National Football League’s Big Data Bowl,
an event originating from the league office designed to crowdsource public insight
into tracking data, with the hope of inspiring analytically-inclined fans, curating
ideas for team staffers, and spurring data-driven innovation in football.
 **use examples here (this part will be based on which articles are accepted)**

4 Conclusion and next steps
This manuscript highlights several use cases of NFL tracking data, including both
old and new research questions. In particular, we return to one of the league’s oldest
findings – that teams should be more aggressive on fourth down – to suggest that
previous work may have overestimated the effect of going for it. Specifically, given
the relative distance needed for a first down, teams that went for it on fourth down
tended to do so from shorter distances, even when conditioning on the play-by-play
yardage category. More generally, we summarize how the articles in this JQAS
special issue on player tracking data will help shape the future of NFL analytics
work.
 Although we explicate on the value of player tracking insight in the NFL,
it is important to acknowledge that this data is not a panacea for all football
problems. Given the complexity of the game, there will always be fundamental
football questions that data alone cannot precisely answer. Additionally, player
tracking data is more arduous to analyze when compared to traditional play-by-play
data; anecdotally, nearly every entrant to the league’s Big Data Bowl wished they
could have had more time to refine their work. To wit, here is a list of best practices
and caveats for working with tracking data in the NFL.
 1. Tracking data contains the and coordinates for each player and the
football, collected at roughly 10 frames-per-second. Locational information is
provided by signals sent from radio-frequency identification (RFID) chips that are
placed inside each player’s shoulder pads and inside the football. Speed, orientation,
and distance traveled are straightforward to calculate using the tracking information,
and are provided by the NFL’s Next Gen Stats group. The typical game can contain
NFL player tracking intro 9

anywhere from 250,000 to 350,000 rows of data (1 row for each player on the field,
on each play, at each time stamp) on which actual game action is occurring. Players
are also tracked before and after plays (this information was not provided as part
of the Big Data Bowl, and is generally seen as less pertinent). The coordinate is
not measured (e.g, height of the player, or height of the ball), nor can the precise
location of helmets, arms, and legs be verified or easily estimated.
 2. The field coordinates are fixed at each NFL stadia, as shown in Figure 3.
From left to right, the length of the field spans from = 0 to = 120 (units are
in yards), while the width of the field spans = 0 to = 160/3. Often, the first
step in any analysis of tracking data is to ensure offensive teams are moving in
the same direction. This requires flipping roughly half of a game’s offensive plays
from one direction to the other, while creating new (subtracted from 120) and
 (subtracted from 160/3) coordinates. Additionally, standardizing by the play’s
line-of-scrimmage may be warranted.
 3. Several play-specific traits remain unknown even when looking at tracking
data. These include the initial play call, if the quarterback or coach called an audible,
how the defense would have lined up if the offense used a different formation, if a
wide receiver ran the correct route, etc. Each of these variables may be pertinent
to more precisely estimate, as an example, the value of passing versus running.
The absence of important play-level qualities highlights the need for analysts to
work directly and cohesively with football experts in order to maximize the value
of tracking data.
 4. Some specifics about the data that researchers may want to be aware of.
First, given updates to the RFID tags prior to the start of each season, small
differences in speed measurements may exist from one year to the next. Additionally,
the coordinates on the football are considered to be slightly less reliable than the
coordinates on the players. Next, while analyzing maximum speed for players is
often an easy-to-understand step, researchers should be wary that occasionally this
maximum speed is reached while (or immediately after) a player is hit or tackled
by an opponent. That said, tracking data is considered quite dependable; according
to the Next Gen Stats group, location information is accurate to within +/- 12
inches, and reliable data has been collected on 99.999% of the entirety of players
and games over the last two seasons.

 For years, data-driven innovation in the football was limited, and the NFL
was, rightly or not, perceived to be trailing other leagues in terms of how teams
used analytics. But insight lagged, in part, because so too did data. Behind player
tracking insight, such excuses are no longer valid. The NFL’s new data cannot tell
us where exactly to look for insight, but it will allow us to both create new stories
and to make old ones more complete.
10 Lopez

Fig. 3: Coordinates for working with player tracking data. Each stadia is equipped such
that the home and visiting team end zones are fixed throughout the game. However, the
end zones that teams defend in a game are not determined until the start of each half, and
those directions change at the conclusion of the first and third quarters.

References
B. Burke and K. Quealy. How coaches and the nyt 4th down bot compare. http://www.
 nytimes.com/newsgraphics/2013/11/28/fourth-downs/post.html, 2013. Accessed June
 21, 2017.
B. Burke, S. Carter, J. Daniel, T. Giratikanon, and K. Quealy. 4th down: When to go for it
 and why. https://www.nytimes.com/2014/09/05/upshot/4th-down-when-to-go-for-it-
 and-why.html?_r=0, 2013. Accessed March 20, 2017.
V. Carter and R. E. Machol. Note—optimal strategies on fourth down. Management Science,
 24(16):1758–1762, 1978.
A. Cheema. Nfl coaches should stop being stupid on fourth downs. https://www.thespax.
 com/nfl/message-to-nfl-coaches-stop-being-stupid-on-fourth-downs/, 2019. Accessed
 July 20, 2019.
J. Hermsmeyer. For a passing league, the nfl still doesn’t pass enough. https://fivethirtyeight.
 com/features/for-a-passing-league-the-nfl-still-doesnt-pass-enough/, 2018. Accessed
 June 27, 2019.
K. Kovash and S. D. Levitt. Professionals do not play minimax: evidence from major league
 baseball and the national football league. Technical report, National Bureau of Economic
 Research, 2009.
D. Romer. Do firms maximize? evidence from professional football. Journal of Political
 Economy, 114(2):340–365, 2006.
A. Schatz. Football’s hilbert problems. Journal of Quantitative Analysis in Sports, 1(1), 2005.
NFL player tracking intro 11

C. Stuart. Nfl coaches are making better decisions. https://slate.com/culture/2017/11/nfl-
 coaches-are-making-better-fourth-down-decisions.html, 2017. Accessed July 20, 2019.
D. R. Yam and M. J. Lopez. What was lost? a causal estimate of fourth down behavior in
 the national football league. Journal of Sports Analytics, (Preprint):1–15, 2019.
You can also read