Intercontinental Exchange (NYSE: ICE)
Investor Presentation
November 15th, 2016
←
→
Page content transcription
If your browser does not render page correctly, please read the page content below

Intercontinental Exchange (NYSE: ICE) Investor Presentation November 15th, 2016

FORWARD-LOOKING STATEMENT AND LEGENDS
CAUTIONARY STATEMENT REGARDING FORWARD LOOKING STATEMENTS
This presentation may contain “forward-looking statements” made pursuant to the safe harbor provisions of the Private Securities Litigation Reform Act of 1995.
Statements regarding ICE’s business that are not historical facts are forward-looking statements that involve risks, uncertainties and assumptions that are difficult to
predict. Although we believe the expectations reflected in these forward-looking statements are reasonable, these statements are not guarantees of future results,
performance, levels of activity or achievements, and actual results may differ materially from what is expressed or implied in any forward-looking statement. The
factors that might affect our performance include, but are not limited to: general economic conditions and conditions in global financial markets; volatility in commodity
prices, equity prices, and price volatility of financial benchmarks and instruments such as interest rates, credit spreads, equity indexes and foreign exchange rates;
our business environment and industry trends; continued high renewal rates of subscription-based data revenues; changes in domestic and foreign laws, regulations,
rules or government policy with respect to financial markets, or our businesses generally, including increased regulatory scrutiny or enforcement actions and our
ability to comply with these requirements; our ability to identify and effectively pursue acquisitions and strategic alliances and successfully integrate the companies we
have acquired or acquire in the future; the success of our clearing houses and our ability to minimize the risks associated with operating multiple clearing houses in
multiple jurisdictions; the resilience of our electronic platforms and soundness of our business continuity and disaster recovery plans; performance and reliability of
our technology and the technology of our third party service providers; increasing competition and consolidation in our industry; our ability to keep pace with rapid
technological developments and to ensure that the technology we utilize is not vulnerable to security risks, hacking and cyber-attacks; the accuracy of our cost
estimates and expectations; our belief that cash flows from operations will be sufficient to service our current levels of debt and fund our working capital needs and
capital expenditures for the foreseeable future; our ability to identify trends and adjust our business to respond to such trends; our ability to maintain existing market
participants and attract new ones, and to offer additional products and services, leverage our risk management capabilities and enhance our technology; our ability to
attract and retain our key talent; our ability to protect our intellectual property rights, including the costs associated with such protection, and our ability to operate our
business without violating the intellectual property rights of others; and potential adverse results of litigation and regulatory actions and proceedings. For a discussion
of such risks and uncertainties, which could cause actual results to differ from those contained in the forward-looking statements, see ICE’s Securities and Exchange
Commission (SEC) filings, including, but not limited to ICE’s most recent Annual Report on Form 10-K for the year ended December 31, 2015, as filed with the SEC
on February 4, 2016. These filings are available in the Investors section of our website. We caution you not to place undue reliance on these forward-looking
statements. Any forward-looking statement speaks only as of the date on which such statement is made, and we undertake no obligation to update any forward-
looking statement or statements to reflect events or circumstances after the date on which such statement is made or to reflect the occurrence of an unanticipated
event. New factors emerge from time to time, and it is not possible for management to predict all factors that may affect our business and prospects. Further,
management cannot assess the impact of each factor on the business or the extent to which any factor, or combination of factors, may cause actual results to differ
materially from those contained in any forward-looking statements.

GAAP AND NON-GAAP RESULTS
This presentation includes non-GAAP measures that exclude certain items we do not consider reflective of our cash operations and core business performance. We
believe that the presentation of these non-GAAP measures provides investors with greater transparency and supplemental data relating to our financial condition and
results of operations. These adjusted non-GAAP measures should be considered in context with our GAAP results. A reconciliation of Adjusted Net Income from
Continuing Operations, Adjusted Earnings Per Share from Continuing Operations, Adjusted Operating Income, Adjusted Operating Margin and Adjusted Operating
Expenses to the equivalent GAAP measure and an explanation of why we deem these non-GAAP measures meaningful appears in our Form 10-Q filed with the SEC
on August 3, 2016 and in the appendix to this presentation. The reconciliation of Adjusted Tax Rate and Adjusted Debt-to-EBITDA to the equivalent GAAP results
appear in the appendix to this presentation. Our Form 10-Q, earnings press release for the first quarter of 2016 and this presentation are available in the Investors
and Media section of our website at www.theice.com.

EXPLANATORY NOTES
All net revenue figures represent revenues less transaction based expenses for periods shown. All earnings per share figures represent diluted weighted average
share count on continuing earnings.
     INTERCONTINENTAL EXCHANGE                                                                                                                                        2
BEST IN CLASS GROWTH & RETURNS
>50% recurring revenue, highly transparent financial model
Strong growth in operating cash flow and capital return
Double-digit earnings growth track record
Focus on creating value by generating improving Return on Invested Capital (ROIC) consistently
above cost of capital
EPS Growth
Sales
(1) Other
Cash Equities
$10.33
+16% y/y
5% 4%
(3)
YTDQ316
REVENUES
44% Data Services
38%
OF
$3.4B
Global Derivatives (1)
9%
(2) (2) (2) Sep (2)
'16
YTD Listings
(1) Net of transaction based expenses
(2) These represent non-GAAP measures. Adjusted EPS refers to adjusted earnings per share from continuing operations. Please refer to slides in the appendix for reconciliations to
the equivalent GAAP measures. The GAAP results for 2013, 2014 and 2015 were $3.84, $8.46 and $11.39, respectively and the GAAP results for YTD Sep. '16 were $8.93.
(3) QTD Sep. '15 figures reflect pro forma results which include Interactive Data Corporation and Trayport as if we had owned them during that period. 2015 pro forma results by
quarter are available in the Investor Relations section of our website.
INTERCONTINENTAL EXCHANGE 3
GLOBAL EXCHANGE, CLEARING & DATA LEADER 11 GLOBAL EXCHANGES 6 CENTRAL CLEARING HOUSES GLOBAL DATA SERVICES Across All Asset Classes Across Futures & OTC Leveraging Proprietary Data Volume growth leader in global Clearing houses in the US, Europe, Strong recurring revenue streams futures markets with 19% 9-yr UK, Singapore and Canada based on mission-critical data CAGR(1) Introduced >500 new cleared Combination of proprietary data, ICE Futures exchanges in the US, products across asset classes processes, indices, benchmarks Europe, UK, Singapore and over 7 years to help customers driving 6-7% rev. growth in 2016 Canada; NYSE Group includes US trade and manage risk and on a pro forma basis cash equity and options regulatory compliance globally Connectivity solutions serving exchanges demand for security, capacity (1) CAGR from 2006 to 2015. INTERCONTINENTAL EXCHANGE 4
GLOBAL NETWORK OF EXCHANGES & CLEARING
HOUSES
Offering key asset classes across our 11 exchanges
Home to key global benchmarks around the world:
Energy: ~50% of crude & refined oil ADV
Ags: benchmarks in sugar, coffee, cocoa and canola
Rates: leading European short-term rates contracts
Equity indices: futures on MSCI, FTSE and Russell
US cash equities: NYSE is growing its share of trading
US equity options: 2nd largest in US
Global reach with 6 clearing houses:
Multi-asset class offering maximizing capital efficiencies
Leading risk management system and services
~600 CDS Instruments cleared in US & EU
Strong performance across asset classes:
Q316YTD Total Rev +4% y/y(1); Q316YTD commodities
Rev +7% y/y driven by oil
3Q16 solid Rev growth across ICE Brent (+9%), gasoil
(+8%), and WTI (+10%)
YTD Oct volume growth of +9%
INTERCONTINENTAL EXCHANGE 5
(1) YTD Sept ‘15 figures reflect pro forma results which include Interactive Data Corporation and Trayport as if we had owned them during that period.
2015 pro forma results by quarter are available in the Investor Relations section of our website.DIVERSE, GLOBAL & PROPRIETARY DATA SERVICES
Pricing & Analytics – YTDQ316 Rev $624MM, +4% y/y(1)
Full range of integrated data services for ▪ Independent evaluated pricing services, reference data and
trade life-cycle and risk management valuations across fixed income markets
In millions
▪ Expanding index services and licensing regulated benchmarks
$1,463MM
$1,600 +6% y/y
$1,378MM 7% Exchange Data – YTDQ316 Rev $403MM, +14% y/y(1)
▪ New products and services driving growth
$1,200
▪ Data across 9 asset classes from our 11 global exchanges:
$800 ◦ Customer and license access from data vendors and end users
10%
◦ View-only data access, direct access services, daily indices,
4% forward curves and related exchange data services
$400
Desktop & Connectivity – YTDQ316 Rev $436MM, +3% y/y(1)
▪ Desktop and web-based applications deliver real-time market
$0 information, analytics and decision support technologies
(1)
YTDQ315 YTDQ316 ▪ Consolidated feeds provide financial data from multiple market
sources
▪ Connectivity services offer reliable/secure transmission of
exchange data
(1) YTDQ315 figures reflect pro forma results which include Interactive Data Corporation and Trayport as if we had owned them during that period. 2015 pro forma results by quarter are
available in the Investor Relations section of our website.
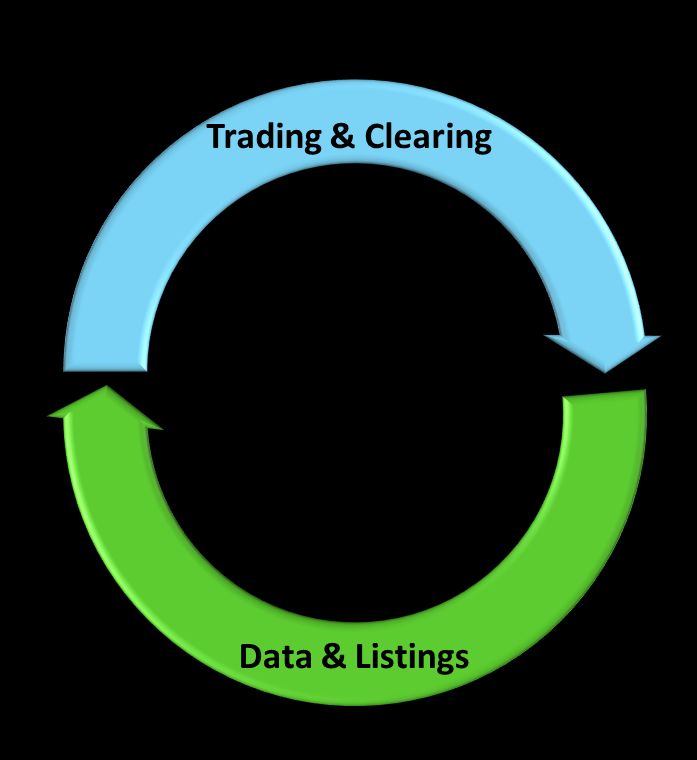
INTERCONTINENTAL EXCHANGE 6Virtuous Cycle Driving Consistent Earnings Growth
Data, trading and risk management infrastructure
brings unparalled efficiency as an enterprise solution
Secular trends driving demand for data include
passive investing, market fragmentation, automation,
clearing, reporting, requirements for independent
valuation and reporting data
Compliance with regulation and best practices are
driving firms towards greater independence, reporting,
transparency & systems testing
Enterprise service platform is a complete solution
across front, middle and back office workflows
• Covers pricing & evaluations, benchmarks, indices,
reference data and exchange data delivered via
desktops, secure infrastructure and direct feeds
• SPSE/CMA acquisitions offer expanded evaluations
services and in-depth credit market analytics
• New data products support automation, liquidity
and transparency in fixed income markets
7Product Diversity Enables Consistent Growth
• Strategic approach delivering growth amid dynamic regulatory, economic and volatility environments
• Consistent evolution of model by focusing on secular growth, including clearing and data
(1) $3.4B (2)
+4% y/y
(1) Net of Transaction Based Expenses
(2) YTDQ315 figures reflect pro forma results which include Interactive Data Corporation and Trayport as if we had owned them during that period. 2015
pro forma results by quarter are available in the Investor Relations section of our website.
8UNMATCHED, CONSISTENT GROWTH THROUGH
MARKET CYCLES
Driving growth, investing to generate strong returns on capital & double digit adj. EPS target
(1),(2)
(2)
(2)
+4% y/y (2)
+11% y/y
$ (Millions)
$ (Millions)
YTD YTD
Q316 Q316
(2)
+10% y/y
+69% y/y
$ (Millions)
$ (Millions)
YTD YTD
Q316 Q316
(1) Net of Transaction Based Expenses (2) YTDQ315 figures reflect pro forma results which include Interactive Data Corporation and Trayport as if we had owned them during
that period. 2015 pro forma results by quarter are available in the Investor Relations section of our website.
Adjusted figures represent non-GAAP figures. Please refer to the slides in the appendix for reconciliations to the relevant GAAP measures.APPENDIX INTERCONTINENTAL EXCHANGE 10
Third Quarter 2016 Revenue
▪ Data & Listings revenue +5% y/y(1); including pricing & analytics +3%(1), adjusted for impact of Pound
  devaluation and 3Q15 billing true-up
▪ Trading & Clearing revenue -4% y/y; energy revenues +4%, and interest rate revenues -15% despite ADV
  +13%, due to currency impacts and customer mix
▪ Expect pro-forma data revenue growth of 6-7% in 2016; favorable trends entering 2017

                                                                                                                                                                 Q3 15 Pro
                                                                                                  $ (in millions)                                 Q3 '16          Forma(1)          % Chg
55% Recurring Revenue
                                                                                                  Data Services(1):
                                                                                                      Pricing and analytics                             209                209       (1)%
                                                                                                      Desktops and connectivity                         144                141        3%
                                   $136        $44                                                    Exchange Data                                     136                116       17%

                       $144                                                                       Listings                                              106                101        5%
                                                                                                  Data & Listings Segment                               595                567        5%
                                     $1.1B                $390
                                   Flat y/y(1)                                                    Trading & Clearing, net:
                       $209
                                                                                                      Commodities                                       262                255        2%

                                    $106                                                              Financials(2)                                     177                205      (14)%
                                              $49(2)
                                                                                                  Other                                                   44                 46      (2)%
                                                                                                  Trading & Clearing Segment                            483                506       (4)%

  (1) QTD Sep. '15 figures reflect pro forma results which include Interactive Data Corporation and Trayport as if we had owned them during that period. 2015 pro forma results by quarter
  are available in the Investor Relations section of our website.
  (2) Net of transaction based expenses.
                                                                                                                                                                                             11
Third Quarter 2016 Adjusted Expense
▪ Adj. expense -3% y/y(1); adj. margin +2 pts y/y(1) to 55%
▪ Expense discipline and synergy acceleration; increased 2016 expense synergies from $75MM at beginning
of year to ~$115MM, including ~$65MM related to Interactive Data acquisition
▪ Adj. op expense guidance of $500-505MM for 4Q16, includes addition of Securities Evaluations and Credit
Market Analysis
Q3 15 Pro
$ (in millions) Adj. Q3 '16 Forma(1) % Chg
Data & Listings
Other Operating(2) 253 254 —%
D&A 37 40 (10)%
M&A 6 — 1,117%
Data & Listings
296 294 1%
$48 $72 Operating Margin 50% 48% +2pts
$39
Trading & Clearing
$484M Other Operating(2) 152 169 (10)%
-3% y/y(1) D&A 35 35 2%
$93
M&A 1 2 (78)%
$232 Trading & Clearing
188 206 (9)%
Operating Margin 61% 59% +2pts
(1) QTD Sep. '15 figures reflect pro forma results which include Interactive Data Corporation and Trayport as if we had owned them during that period. 2015 pro forma results by quarter
are available in the Investor Relations section of our website.
(2) Other operating includes SG&A, rent, professional services, technology and communications, and compensation and benefits
Adjusted figures represent non-GAAP measures. Please refer to slides in the appendix for reconciliations to the equivalent GAAP measures.
12Strong Cash Flow & Debt Reduction
▪ Generated $1.5 billion in operating cash flow YTD
▪ YTD dividends of $307MM; +28% y/y
▪ Restarted share repurchases in Oct. '16 under existing $1B authorization
▪ Approved 5-for-1 stock split; with a record date of 10/27/16 and a distribution date of 11/3/16
(1)
$1.5B
$7.3B
$6.3B
2.8x
2.3x
$890MM
(1) Adjusted debt-to-EBITDA leverage ratio reflects the ratio of adjusted debt to adjusted EBITDA for the trailing twelve months. This reflects a non-GAAP measure. Please refer to
slides in the appendix for reconciliation to the equivalent GAAP measure.
13ICE Summary Balance Sheet
In millions
Balance Sheet 9/30/2016 12/31/2015 Change
Assets ▪ $458MM unrestricted cash
Unrestricted Cash $458 $627 $(169)
▪ Total debt of $6.3B; Adj. Debt-to-
Other Current Assets 51,386 52,686 (1,300)
EBITDA(1) of 2.3x
Current Assets 51,844 53,313 (1,469)
PPE (net) 1,080 1,037 43 ▪ $254MM YTD 2016 capex
Other Assets 23,372 23,637 (265)
◦ Op capex & cap software $200MM
◦ Real estate capex $54MM
Total Assets $ 76,296 $ 77,987 $(1,691)
Liabilities & Equity ▪ TTM ROIC(2) of 7.8%
Short-Term Debt 1,585 2,591 (1,006)
Other Current Liabilities $50,769 $52,152 $(1,383)
Long-Term Debt 4,720 4,717 3
Other Long-Term Liabilities 3,644 3,652 (8)
Total Liabilities 60,718 63,112 (2,394)
Redeemable Noncontrolling Int 34 35 (1)
Total Equity 15,544 14,840 704
Total Liabilities & Equity $ 76,296 $ 77,987 $(1,691)
(1) This is a non-GAAP measure. Please refer to slides in the appendix for reconciliation to the equivalent GAAP measure.
(2) ROIC = LTM (Operating Income x (1-Tax Rate) ) / (Avg Debt + Avg Shareholders Equity + Avg Minority Interest - Avg Cash, Cash Equiv, & ST Investments).
14Adjusted Net Income from Continuing Ops and EPS from
Continuing Ops
In millions (except per share amounts)
3 Months 3 Months 9 Months 9 Months
Ended 9/30/16 Ended 9/30/15 Ended 9/30/16 Ended 9/30/15
Income from continuing operations $350 $310 $1,090 $922
Add: NYSE and Interactive Data transaction and integration costs 7 6 31 31
Add: Amortization of acquisition-related intangibles 76 33 230 99
Add: Employee severance costs related to Creditex U.K.
brokerage operations 4 — 4 —
Add: Creditex customer relationship intangible asset impairment 33 — 33 —
Add/(Less): Litigation settlements and accruals, net of insurance
proceeds — (4) — 15
Less: Income tax effect related to the items above (45) (18) (111) (52)
Add/(Less): Deferred tax adjustments on acquisition-related
intangibles — — 14 (14)
Add/(Less): Other tax adjustments (34) — (34) 7
Less: Net income from continuing operations attributable to non-
controlling interest (6) (4) (20) (18)
Adjusted net income attributable to ICE $385 $323 $1,237 $990
Diluted EPS from continuing operations $2.86 $2.76 $ 8.93 $ 8.10
Adjusted Diluted EPS from continuing operations $3.21 $2.91 $10.33 $8.87
Diluted weighted average common shares outstanding 120 111 120 112
15Adjusted Net Income from Continuing Ops and EPS from
Continuing Ops
In millions (except per share amounts)
12 Months 12 Months 12 Months
Ended 12/31/15 Ended 12/31/14 Ended 12/31/13
Income from continuing operations $1,295 $1,005 $320
Add: NYSE and Interactive Data transaction and integration costs
and acquisition related success fees 83 124 140
Add: Amortization of acquisition-related intangibles 140 131 56
Add: Litigation settlements and accruals, net of insurance
proceeds 15 — —
Add: Pre-acquisition interest expense on debt issued for
Interactive Data acquisition 5 — —
Add: Cetip impairment loss — — 190
Add: Duplicate rent expense and lease termination costs — — 7
Add: Early payoff of outstanding debt — — 51
Less: Income from OCC equity investment — (26) —
Less: Net gain of sale of 6% remaining ownership in Euronext — (4) —
Less: Income tax effect related to the items above (83) (89) (85)
Less: Deferred tax adjustments on acquisition-related intangibles (82) (14) —
Add: Other tax adjustments 7 12 —
Less: Net income from continuing operations attributable to non-
controlling interest (21) (35) (16)
Adjusted net income attributable to ICE $1,359 $1,104 $663
Diluted EPS from continuing operations $ 11.39 $ 8.46 $ 3.84
Adjusted Diluted EPS from continuing operations $12.15 $9.63 $8.38
Diluted weighted average common shares outstanding 112 115 79
16Adjusted Operating Income, Operating Margin &
Operating Expense Reconciliation
In millions
3 Months Ended 3 Months Ended 9 Months Ended 9 Months Ended
9/30/16 9/30/15 9/30/16 9/30/15
Total revenues, less transaction-based expenses $1,078 $816 $3,361 $2,463
Total operating expenses 604 376 1,752 1,131
Less: NYSE and Interactive Data transaction and integration costs 7 6 31 31
Less: Employee severance costs related to Creditex U.K.
brokerage operations 4 — 4 —
Less: Creditex customer relationship intangible asset impairment 33 — 33 —
Less: Amortization of acquisition-related intangibles
76 33 230 99
Adjusted total operating expenses $484 $337 $1,454 $1,001
Adjusted operating income $594 $479 $1,907 $1,462
Operating margin 44% 54% 48% 54%
Adjusted operating margin 55% 59% 57% 59%
17Adjusted EBITDA Reconciliation
In millions
Trailing 12 Months
Ended 9/30/16
Adjusted net income $1,606
Add: Income tax expense 427
Add: Income tax expense adjustment on Non-GAAP Items 230
Less: Other income, net(1) (27)
Add: Interest expense(1) 159
Add: Depreciation and amortization(1) 264
Adjusted EBITDA from Continuing Ops $2,659
Adjusted EBITDA - Interactive Data Corp. & Trayport (pre acquisition)(2) $101
Combined Adjusted EBITDA $2,760
Debt, as reported 6,305
Add: Balance of unamortized premiums/discounts and debt issuance costs, net 31
Principal amount of debt outstanding (Adjusted Debt) $6,336
Adjusted Debt-to-EBITDA leverage ratio 2.3x
(1) Excludes adjustments already included in Non-GAAP financial measures.
(2) Represents pro forma EBITDA for the pre acquisition period covering 10/1/15-12/10/15 for Trayport and 10/1/15-12/11/15 for Interactive Data Corporation.
.
18Adjusted Effective Tax Rate Reconciliation
In millions
3 Months 3 Months
Ended 9/30/16 Ended 9/30/15
Income before income tax expense $443 $423
Less: Income tax expense 93 113
Net Income $350 $310
Effective tax rate 21% 27%
Income before income tax expense $443 $423
Add: NYSE and Interactive Data transaction and integration costs 7 6
Add: Amortization of acquisition-related intangibles 76 33
Add: Employee severance costs related to Creditex U.K. Brokerage
operation 4 —
Add: Creditex customer relationship intangible asset impairment 33 —
Add: Litigation accruals — (4)
Adjusted Income before income taxes $563 $458
Income tax expense $93 $113
Add: Income tax effect for the above items 45 18
Add: Other tax adjustments 34 —
Adjusted income tax expense $172 $131
Adjusted Income before income tax expense $563 $458
Adjusted income tax expense 172 131
Adjusted Net Income $391 $327
Adjusted effective tax rate 30% 28%
19ICE: A GROWING GLOBAL NETWORK
1997 2001 2007 2008 2010 2011 2013 2014
Continental Power ICE expands reach ICE acquires ICE expands in Asia
ICE expands into ICE acquires New ICE enters credit market ICE invests in
Exchange (CPEX) in emissions markets NYSE Euronext to create with Singapore
energy futures by York Board of Trade with acquisition of Brazilian clearing
acquired to build with acquisition of the premier financial exchange & clearing
acquiring the and Winnipeg leading interdealer CDS provider Cetip
new electronic Climate Exchange markets operator; adds house
International Commodity broker Creditex
Inorganic Growth
OTC energy Petroleum Exchange; signs interest rates to asset
market Exchange exclusive class portfolio
license for U.S. ICE adds leading
Russell Indexes ICE acquires 2011 provider of analytics,
YellowJacket, an instant 2013 valuation & market
ICE launches Brazilian 2014 data
Continental messaging platform marketplace for
Power Exchange ICE acquires ICE aquires majority
developed for traders, electric power through majority stake in stake in continental
now operating as ICE JV with local market
WCE Chat
APX Endex and European clearing 2015
experts launches ICE ICE acquires leading
house, now ICE Clear
Endex, a continental Netherlands provider of pricing &
European energy analytics for fixed
exchange income instruments
2000 2001 2002 2008 2009 2010 2011 2012 2014-15
ICE is formed to ICE launches ICE introduces ICE launches ICE ICE launches 2 ICE launches ICE ICE Clear Credit ICE transitioned ICE Benchmark
develop ICE eConfirm, industry’s first Clear Europe, UK’s CDS clearing mobile App for successfully ~800 cleared Administration
Organic Growth
transparent providing traders cleared OTC first new houses, quickly iPhone and iPad transitions under over-the-counter becomes new
marketplace for with electronic energy contracts clearing house in becoming the global with real-time and Dodd-Frank energy swaps to administrator for
OTC energy trade 100 years leader customizable futures LIBOR, ICE
confirmations 2003 interface ICE and NGX Swap Rate and
expand alliance to Gold Price
ICE Data is
ICE Link launches physical crude
launched with
enhanced credit 2015
ICE’s proprietary
derivative novation ICE launches ICE
data and ICE Futures
process Trade Vault, its swap Singapore
indices
data repository, in
Launches with
U.S., E.U. and
Commodity and
Canada
FX Contracts
Serving Asian
Introduced ~100 new products annually Markets
INTERCONTINENTAL EXCHANGE 20SERVING GLOBAL MARKETS
MARKETS & CLEARING PRODUCTS MARKETS & CLEARING PRODUCTS
FUTURES EXCHANGES CASH EXCHANGES
ICE Futures U.S. New York Stock Exchange
ICE Futures Europe NYSE Arca
ICE Futures Canada NYSE MKT
ICE Futures Singapore NYSE Amex Options
ICE Endex NYSE Arca Options
NYSE Bonds
CENTRAL CLEARING HOUSES OTC MARKETS
ICE Clear U.S. ICE OTC Energy
ICE Clear Europe ICE Swap Trade & Creditex
ICE Clear Canada Trayport
ICE Clear Singapore
AGS ETPs
ICE Clear Credit
BONDS FX
ICE Clear Netherlands CREDIT DERIVATIVES INTEREST RATES
ENERGY PRECIOUS METALS
EQUITIES/INDEX/OPTION
INTERCONTINENTAL EXCHANGE 21You can also read


