Chapter 1. GIS Fundamentals
←
→
Page content transcription
If your browser does not render page correctly, please read the page content below
GIS Fundamentals
Chapter 1. GIS Fundamentals
1. GIS Overview
GIS refers to three integrated parts.
• Geographic: Of the real world; the spatial realities, the geography.
• Information: Data and information; their meaning and use.
• Systems: The computer technology and support infrastructure.
GIS therefore refers to a set of three aspects of our modern world, and offers
new ways to deal with them (Davis, 21).
In 1990, the President of the Association of American Geographers, Saul Cohen,
was quoted: “Times are changing, and our methods of meeting the needs of the
times are also changing. The world is entering the ‘post-industrial Information
Age’– a time when information is becoming a major product of, and foundation
for, progress. Increasing emphasis on data management is apparent and
necessary. Today’s focus in geography (or any other discipline) on data handling
and data manipulation reflects the national (and international) emphasis on
meeting the needs of the postindustrial information age.”
The concept of information is indeed the heart of the rapidly growing field of
Geographic Information Systems or GIS. As the world moves into the
Information Age, meaningful data and information are becoming the major
‘currency’. With the continuous advances in computer technology, it is easy to
concentrate on dazzling systems and software, but the real value of any product
is the data and the information such data provides. At the heart of any GIS is
information.
This chapter introduces the reader to the very basic principles of Geographic
Information Systems, by giving an overview of the different operations that it can
handle and perform, as well as its environment. It aims to explain what GIS is,
and presents the ArcView Graphical User Interface.
2. What is GIS?
2.1 History of GIS
Spatial analysis has been around as long as maps have been used for
navigation. Traditional GIS has included paper maps, and manual tools that were
utilized before the computer age.
There are many theories on how and where the original GIS began and took hold
in the information-based world we live in today. There is little doubt that the
Harvard Laboratory for Computer Graphics, later renamed by adding “and Spatial
Analysis”to its title, was a key institution in the birth and early development of
GIS in the United States. A large number of the founders of GIS in the academic
and commercial sectors spent time at the Harvard Lab in the 1960s and 1970s,
as staff, students, or visitors, exchanging ideas that would shape the field.
Work Site Alliance – Community Based GIS Education 1
2000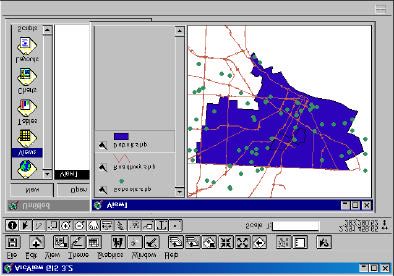
GIS Fundamentals
Most would acknowledge that the two dominant commercial GIS producers in the
United States are Environmental Systems Research Institute (ESRI) and
Intergraph. Estimates usually indicate that together they produce at least half of
the GIS software in the country. ESRI will be the focus of this chapter, with the
ESRI desktop application ArcView being utilized for the software application of
this course. Jack Dangermond, the President of ESRI, Inc. since 1969, is well
known to GIS users because he established the company in that year, then
subsequently developed and launched ARC/INFO in 1982. Dangermond
continues to refine ESRI’s software, and his efforts qualify him as one of the
original thinkers in the development of spatial analysis systems. (Lakhan, 2)
2.2 GIS Description
Geographic Information Systems (GIS) are computerized systems for the
storage, retrieval, manipulation, analysis, and display of geographically
referenced data. Since they can include either physical, biological, cultural,
demographic, or economic information, they are valuable tools in natural, social,
medical, and engineering sciences as well as in business and planning.
The infrastructure to any GIS is made up of four components whose interrelation
is shown on the illustration below. These components can be listed in order of
importance as follows.
• Methods and People – The most important part of a GIS infrastructure.
Although GIS is a powerful tool, it will not work without some well-adapted
methods and trained people.
• Data – The needed raw material to be processed by the system. The focus
and attention should be on data. In fact, most work will be devoted to data
input and management. Data (information) is the foundation of GIS
applications.
• Software – The computer programs needed to run GIS. There are many GIS
programs available, from low-cost and low-performance packages to
expensive and very powerful ones. This also includes support programs, such
as statistical, word processing, graphing, and others.
• Hardware – The machinery on which GIS operates – computers, printers,
plotters, digitizers, and other types of equipment. (Davis, 25)
Figure 1.1. Components of a GIS.
Work Site Alliance – Community Based GIS Education 2
2000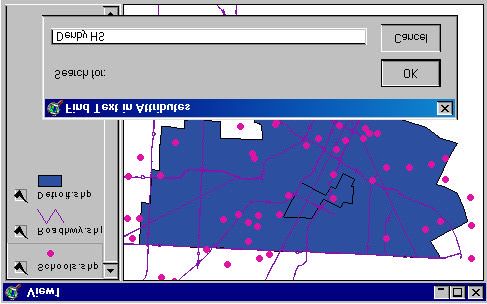
GIS Fundamentals
Unfortunately, GIS is often developed in the wrong order and more attention is
given to the dazzling hardware and software, rather than trying to fit the data to
the computer technology. The statement ‘garbage in; garbage out’can be
applied to the data collection process for the organization and the people who
utilize and implement that data. The greatest piece of software, and the
computers with the greatest amount of memory and speed, will not improve the
information from data that is poorly gathered and inputted into the system.
2.3 General Purposes of GIS
A description of GIS is that it is a computerized system that deals with spatial
data. GISs essentially perform five processes or tasks.
• Input
• Manipulation
• Management
• Query and Analysis
• Visualization
Input – Gathering data from many sources. Before geographic data can be used
in a GIS, the data must be converted into a suitable digital format. Today many
types of geographic data already exist in GIS-compatible formats. These data
can be obtained from data suppliers and loaded directly into a GIS. (ESRI, Inc.)
Manipulation – Converting data from one form to another; that is, conversion
from one geometric projection to another, re-scaling, and other computer “tricks”
to make the data more useful; changing one map file to match another. It is likely
that data types required for a particular GIS project will need to be transformed or
manipulated in some way to make them compatible with your system. For
example, geographic information is available at different scales (detailed street
centerline files; less detailed census boundaries; and postal codes at a regional
level). Before this information can be integrated, it must be transformed to the
same scale (degree of detail or accuracy). This could be a temporary
transformation for display purposes or a permanent one required for analysis.
GIS technology offers many tools for manipulating spatial data and for weeding
out unnecessary data. (ESRI, Inc.)
Management and Storage – Efficient digital storage and retrieval for easy,
efficient selection and viewing of data in a variety of ways. This involves
administering and keeping track of data, including integration of various data sets
into a common database. For small GIS projects it may be sufficient to store
geographic information as simple files. However, when data volumes become
large and the number of data users becomes more than a few, it is often best to
use a database management system (DBMS) to help store, organize, and
manage data. A DBMS is nothing more than computer software for managing a
database. There are many different designs of DBMSs, but in GIS the relational
database design has been the most useful. In the relational design, data are
stored conceptually as a collection of tables. Common fields in different tables
are used to link them together. This surprisingly simple design is so broadly used
Work Site Alliance – Community Based GIS Education 3
2000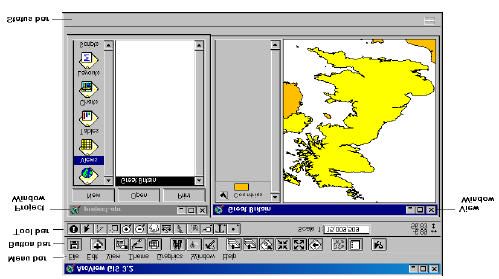
GIS Fundamentals
primarily because of its flexibility and very wide range of applications both within
and outside of GIS. (ESRI, Inc.)
Query and Analysis – Manipulating data to produce insight and new
information. Simplifying the data or the world and its processes to understand
how things work. Once you have a functioning GIS containing your geographic
information, you can begin to ask simple questions such as:
• Who owns the land parcel on the corner?
• How far is it between two places?
• Where is land zoned for industrial use?
And, analytical questions such as:
• Where are all the sites suitable for building new houses?
• What is the dominant soil type for oak forest?
• If I build a new highway here, how will traffic be affected?
Visualization – Presenting data in various ways for easy understanding of maps
and reports (Davis, 23). For many types of geographic operations, the end result
is best visualized as a map or graph. Maps are very efficient at storing and
communicating geographic information. While cartographers have created maps
for millennia, GIS provides new and exciting tools to extend the art and science
of cartography. Map displays can be integrated with reports, three-dimensional
views, photographic images, and other output such as multimedia. (ESRI, Inc.)
3. AreView Graphical User Interface (GUI)
User Interface is a generic term, in computer science, which is adopted for all
components that humans use to communicate with computers. It includes
anything between the input devices (keyboard, mouse, etc) and the output
devices (printer, video display monitor, etc) which translate the electronic signals
sent back by the machine to the user.
Graphical User Interface (GUI) designs a display format that enables the user to
choose commands, to start programs, and to see lists of files and other options
by pointing to icons and lists of menu items on the screen. Choices can generally
be activated either with the keyboard or a mouse. The ArcView GUI consists of
controls called menus, buttons, and tools arranged in three bars at the top of
an Application window. The following figure shows the GUI associated to the
called “View Window”:
Work Site Alliance – Community Based GIS Education 4
2000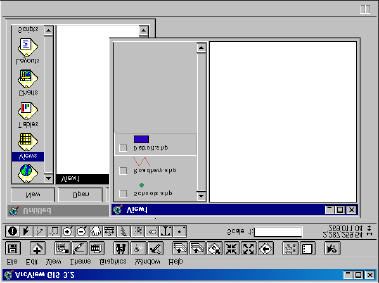
GIS Fundamentals
Figure 1.2. Basic Graphical User Interface of ArcView.
• The Menu bar provides access to ArcView operations through pull-down
menus.
• The Button bar provides quick access to commonly used operations.
• The Tool bar contains tools that perform operations requiring input from the
mouse. (Also, when you click on a tool, the cursor changes to reflect the tool
you have chosen).
When you place the cursor over a menu choice, button, or tool, the Status bar
displays a one-line description of the operation it performs. The Status bar also
reports measurements and displays a progress bar for lengthy operations.
(ESRI)
Below are examples of ArcView sessions showing all the available types of
documents in a GIS project.
• View document
• Table document
• Chart document
• Layout document
• Script document
Project
A project is a collection of associated windows, or documents, that are displayed
during an ArcView session. The Project window contains all of the other
documents associated with the project (views, tables, charts, layouts and
scripts). All of these associated documents are accessed through the active
project window.
Projects are text (ASCII) files stored with an “.apr”extension. Projects contain
pointers to the physical locations of associated documents as well as user
preferences (colors, GUI, window sizes & positions). The user preferences stored
with the project affect only the way the data is displayed not the data itself.
Work Site Alliance – Community Based GIS Education 5
2000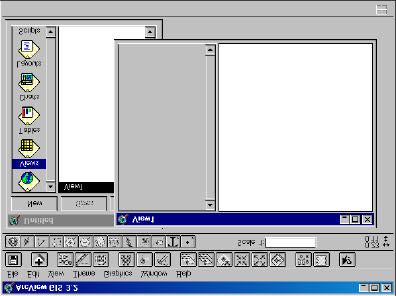
GIS Fundamentals
Figure 1.3. Project window containing associated ArcView documents.
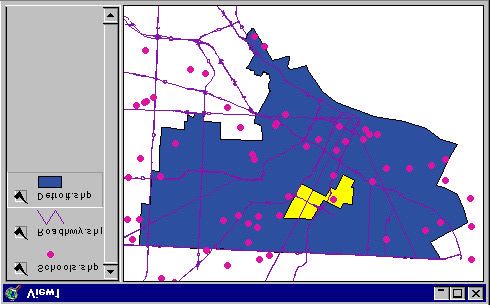
View
A view is the graphic representation of spatial information and can contain any
number of “layers”or “themes”of spatial information (see Chapter 4). The
different themes associated to a view are listed in the Table of Contents, a
sizable space located along the left side of the View window. As seen in the
example below, “Major Roads,”“Schools,”and “Census Block Groups”polygons
would be the selected themes in a single view.
Figure 1.4. View window displaying layers or themes of spatial information.
Table
A table is ArcView’s representation of tabular data. Tables contain descriptive
information about a specific subject. Each row, or record, defines one entry in
the database (e.g., one Census Block polygon); each column, or field, defines a
single characteristic for the entry (e.g. Area). Any dBase, INFO or ASCII file can
be displayed as an ArcView Table (see Chapter 2).
Work Site Alliance – Community Based GIS Education 6
2000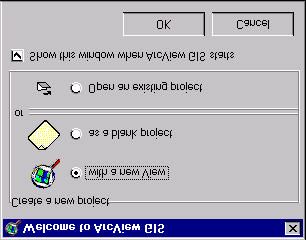
GIS Fundamentals
Figure 1.5. Table displaying tabular data about the theme.
Chart
Charts provide graphic representation of summarized tabular data. Charts can
also query data from the table from which it was built. Six chart types are
available: line, bar, column, X,Yscatter, area, and pie. (NOTE: the same chart
types as in the Microsoft Excel spreadsheet software). The example below
depicts GIS data of high school sizes on a bar graph.
Figure 1.6. A chart summarizing tabular data.
Layout
The layout document is used to combine all other documents (views, tables, and
charts) into an output document (usually a hardcopy map). Any previously
composed view can be placed into a layout. Within the layout a north arrow,
scale bar, legend and other graphics can be added (see Chapter 6).
Work Site Alliance – Community Based GIS Education 7
2000GIS Fundamentals
Figure 1.7. A layout combining views, tables, and charts for map-making purposes.
Script
Script windows are for writing and displaying Avenue scripts that customize the
ArcView user interface or perform user-designed tasks. From the button bar you
check syntax, debug, and run your script.
Avenue is ArcView’s object-oriented programming language. With Avenue you
can modify the appearance of ArcView, create new programs, make complex
tasks simple, and communicate with other applications such as ARC/INFO, a
relational database manager or a spreadsheet. Using scripts, ArcView can be
customized for specific user needs and for specific applications and tasks. The
figure below is an example of the Avenue scripting language.
Figure 1.8. Example of the object-oriented programming language used by ArcView.
Work Site Alliance – Community Based GIS Education 8
2000GIS Fundamentals
Exercises
In this section, the student will learn to open ArcView projects and themes, and use
some of the buttons and tools associated to the View document.
1A. Opening a Project in ArcView GIS
From the Start menu, go to Programs.
Open the GIS application that is installed on your computer (with the same steps
as if you have to open any other application such as Microsoft Word, etc). When
ArcView is opened, you will notice an Untitled Project window with the following
dialog boxes:
Click on OK in the first dialog box (on the left of the page).
Click on No when the second dialog box pops up, and an empty view window will
open.
Work Site Alliance – Community Based GIS Education 9
2000GIS Fundamentals
1B. Adding Themes to a View
With the View window open and active, you then add a theme to the view.
Click on the “ Add Theme”button. An Add Theme window pops up.
After navigating to the right path (Your Drive:\Chapter 1\data), the “Add Theme”
window will appear as follows.
NOTE: When you choose to add a theme to a project, it may be from:
• a Feature Data Source (ArcView shape file, ARC/INFO coverage)
• an Image Data Source (Digital Photos, etc)
In this exercise, we will deal only with Feature Data.
You can choose to add one or multiple themes. To do this hold the Shift Key
down (for multiple selection), and click on the themes: Detroit.shp,
Roadhwy.shp, and Schools.shp
Click on OK.
Work Site Alliance – Community Based GIS Education 10
2000GIS Fundamentals
1C. Working in the View Window
On the left side of the View window, we have the Table of Contents which holds
a list of the themes in the view. Themes which are “on”are denoted by the check
mark in the box on the left of each theme. If a theme is on, then it is visible in the
view.
Click on the check box for each of the three themes you have just added.
The order of themes within the Table of Contents dictates the order in which the
themes are drawn in the view. The top theme in the Table of Contents is drawn
last and is the top layer of the view. The order of the themes can be rearranged
by clicking on a theme with the mouse and then dragging it to a new position in
the Table of Contents.
Notice the order in which the themes are in your View Window.
Click on and drag the Detroit.shp to the top of the Table of Contents.
Notice the change in the “map”by interchanging the order of the themes as
directed. Drag the theme Detroit.shp back to the bottom list.
Many functions in ArcView require that one or more themes are “active.”An
active theme is that which responds to the View GUI. The legend for an active
theme appears “raised”in the table of contents. Themes can be made active by
clicking on the name of the theme in the Table of Contents. Multiple themes may
be made “active”by holding down the Shift Key and clicking with the mouse on
each required theme.
Make the Detroit.shp theme active.
Click on the “Zoom to Active Theme”button.
Work Site Alliance – Community Based GIS Education 11
2000GIS Fundamentals
1D. Using Some Buttons & Tools in the View GUI:
Another strength of ArcView is the additional tools associated with the View
window. These tools can be used on themes and can help you manipulate the
view, find features in the themes, and add graphic features.
Click on these buttons for immediate response.
Zoom to extent of all themes
Zoom to extent of active themes
Zoom in
Zoom out
Click on the following tools and move the pointer into the view graphics area.
Zoom into view (single click, or click and drag a box in the view)
Zoom out from view (single click in the view)
Move the view around (click and drag in the view)
Click on the Select Features tool.
Move the pointer to the polygon located in the middle of the Detroit.shp theme
(which should be the active theme).
The polygon is now selected, and become highlighted.
Click on the “ Zoom to Extent of Selected Features”button. The View will
“focus”on the selected polygon.
Click on the “ Clear Selected Features”button to un-select the previous
area.
Work Site Alliance – Community Based GIS Education 12
2000GIS Fundamentals
Click on the “ Zoom to Previous Extent ”button to retrieve the previous
aspect of the view.
Additional feature theme functions include the Find Feature, and the
Identify Feature tools.
The find feature button allows you to find a particular feature in a view, table or
chart. In a view all the themes you want to search should be active. The string
(text or numeric) you wish to search for is typed in the dialog box. This provides a
search of any occurrences within the project window.
Make the Schools.shp theme active.
Click on the Find Feature tool. A dialog box pops up.
Type in Denby HS.
Click OK. The High School location is highlighted in the View.
1E. Closing the Project
Go to the Project window.
From the File menu, choose Close Project.
Click on No when prompted to save the changes you made so far.
Work Site Alliance – Community Based GIS Education 13
2000GIS Fundamentals
Bibliography
Davis, Bruce E. GIS: A Visual Approach. Santa Fe: Onward Press, 1996.
ESRI Web Page. Environmental Systems Research Institute, Inc. Http://www.esri.com.
Lakhan, V. C. Introductory Geographical Information Systems. Chelsea: Summit
Press, 1996.
Work Site Alliance – Community Based GIS Education 14
2000You can also read