Improved Qsofa Algorithm Based on PPG Wearable Device - IOPscience
←
→
Page content transcription
If your browser does not render page correctly, please read the page content below

Journal of Physics: Conference Series

PAPER • OPEN ACCESS

Improved Qsofa Algorithm Based on PPG Wearable Device
To cite this article: Yepeng Liu et al 2021 J. Phys.: Conf. Ser. 1848 012001

View the article online for updates and enhancements.

 This content was downloaded from IP address 46.4.80.155 on 18/04/2021 at 00:56
ICAACE 2021 IOP Publishing
Journal of Physics: Conference Series 1848 (2021) 012001 doi:10.1088/1742-6596/1848/1/012001

Improved Qsofa Algorithm Based on PPG Wearable Device

 Yepeng Liu *1, a, XiaoxiaoYu2, b, Xin Luo3, c, Ziyu Liu4, d, Yu He5, e
 1
 College of Information Engineering, Wuhan University of Technology, Wuhan,
 China
 2
 College of Engineering and Architecture, University College Dublin, University
 College Dublin Belfield, Dublin 4
 3
 College of Information Engineering, Wuhan University of Technology, Wuhan,
 China
 4
 College of Software Engineering, Huazhong University of Science and Technology,
 Wuhan, China
 5
 College of Information Engineering, Wuhan University of Technology, Wuhan, China
 a
 lyplymx@whut.edu.cn, byuxiaoxiaoholly2009@126.com, c1271132771@qq.com,
 d
 zy30386@163.com, e1052176873@qq.com

 Abstract. This paper designs an improved Qsofa algorithm based on photoplethysmography
 measurement technology. The algorithm is mainly used to achieve accurate measurement of the
 subject’s heart rate and blood pressure and a more refined Qsofa health score. In terms of health
 data processing, this paper uses a combination of data threshold and mean stabilization
 algorithms to significantly improve measurement accuracy. In terms of health analysis, this paper
 greatly reduces the difficulty of the GCS coma evaluation method in the traditional Qsofa
 algorithm, and at the same time makes the final score of the evaluation more detailed in the same
 level, so as to more accurately show the health status of the subjects.

1. Introduction
In the era of epidemics, one of the mainstream symptoms of critical emergency patients is sepsis. Based
on international research results in the Qsofa field, this paper designs an improved Qsofa measurement
and evaluation algorithm based on the photoelectric volume module of wearable devices. Its main
functions are accurate measurements of heart rate and blood pressure and evaluation of the coma of the
subjects. In terms of heart rate and blood pressure detection, the current mainstream wearable device
health detection algorithm design is relatively weak, and its core processing algorithm is the direct
average method. This processing method is relatively simple and direct, but it is easy to cause data errors
due to abnormal data. In this paper, based on the clustering idea of data cleaning of big data, a
combination algorithm of data set stabilization and the threshold value is proposed to improve the
accuracy of health data measurement. At the same time, this paper provides a simpler and more feasible
evaluation plan for coma evaluation, which not only greatly simplifies the evaluation method of coma,
but also retains the accuracy of coma evaluation. Besides, this paper combines the AHP analytic method
to propose a more scientific health scoring method, so that the three evaluation scores of blood pressure,
heart rate, and coma are calculated in a more scientific ratio to the final health score, so as to achieve a
simple and efficient evaluation of critical patients.

 Content from this work may be used under the terms of the Creative Commons Attribution 3.0 licence. Any further distribution
 of this work must maintain attribution to the author(s) and the title of the work, journal citation and DOI.
Published under licence by IOP Publishing Ltd 1
ICAACE 2021 IOP Publishing
Journal of Physics: Conference Series 1848 (2021) 012001 doi:10.1088/1742-6596/1848/1/012001

2. Traditional Algorithm and Technology

2.1. Data processing mean value method
The traditional health data method in wearable devices is the mean value method, and its specific
operation method is to accumulate a certain physiological index data set and divide it by the number of
data to obtain the average value as the final data measurement result. This algorithm can only be used
to eliminate errors caused by small numerical fluctuations. The accuracy of the algorithm will be greatly
affected in terms of filtering out abnormal points or the maximum and minimum values.

2.2. Apache Ⅱ scoring methods
The APACHE Ⅱ scoring system is called acute physiology and chronic health scoring system which
includes APS, Age Score, and Chronic Health Status Score. The larger the final score, the more serious
the condition. The total score of the APACHE Ⅱ scoring system is 0 to 71 points. At the same time, the
APACHE II scoring system proposed a formula for calculating the risk of death R. In the formula, A
represents the estimated intercept, and B represents the estimated coefficient of each independent
variable i, such as physiological disorder, age group, severe chronic health impairment, and diagnosis
category. The method divided the sum of the R-value of each patient by the total number of patients to
get the estimated mortality of all patients. The calculation formula is as formula 1:
 ln A formula 1
 The APACHE II system is easy to use, but it also has more limitations. First, the scoring accuracy
(such as calibration-level) will decrease over time [4,5]. Secondly, unlike the SOFA scoring system,
APACHE II is greatly affected by treatment, so it often needs to evaluate the patient within 24 hours of
entering the ICU.

2.3. SOFA scoring method
The SOFA scoring standard is a simple and effective method to describe dysfunction/failure in critically
ill patients. The total score is 0-24 points. The larger the score, the more serious the condition. The
SOFA scoring system selects parameters based on the principle of being objective, easy to obtain, and
independent from treatment interference [1], through continuous recording of data to better understand
and monitor the patient's condition, and at the same time have a better response to the dynamic changes
of organ function.

2.4. Photoplethysmography measurement technology mounted on wearable devices
The PPG is based on the ILED light source and detector, which measures the attenuated light reflected
and absorbed by human blood vessels and tissues, traces the pulsation state of blood vessels, and
measures the pulse wave. The way of its signal obtained is simple, the measuring device is easy to wear
and other characteristics have made it gradually become the main method of measuring blood oxygen,
pulse, and heart rate under non-hospital conditions. However, because the measurement is a point area
and the measurement data is single, it will often cause a certain amount of invalid data due to noise
errors, leading to deviations in the measurement results.

3. The Algorithm in This Paper

3.1. Based on the characteristics of blood pressure and heart rate data of wearable devices
At present, the single-point measurement of the PPG heart rate and blood pressure carried on wearable
devices is likely to cause unstable measurement data and invalid data during data transmission. This
paper use algorithm to correct received data on the receiving end of the physiological indicators because
of the above phenomena and combines the corrected heart rate and blood pressure data to evaluate and
analyze human health.

 2
ICAACE 2021 IOP Publishing
Journal of Physics: Conference Series 1848 (2021) 012001 doi:10.1088/1742-6596/1848/1/012001

3.2. Receive data processing
(1) Data validation
 To improve the validity of the received data, this step is mainly used to delete abnormal data
transmitted from the wearable device to the processing terminal. First, set the heart rate and blood
pressure threshold, and if the received data exceeds the threshold, it will be eliminated. Combined with
clinical data, this paper sets the human body's limit heart rate, which is 220 beats per minute as the heart
rate threshold, and sets the human body's limit high-risk systolic pressure which is 200mmhg as the
receiving blood pressure threshold [1,2]. At the same time, during the PPG measurement process, the
data transmitted by the hardware will contain a large number of values 0, and this step only retains non-
zero values as valid data. The specific implementation process is as formula 2 and 3:
 , 220
 ( ) formula 2
 , 220
 , 200
 ( ) formula 3
 , 200
 (2) Data stabilization
 To improve the stability of each datum in the received data group effectively, this step calculates the
relative distance between the data in the heart rate and blood pressure data group after threshold
processing and data group mean, which is based on the principle of mathematical statistics. The specific
calculation formula is as follows:
 ( )
 formula 4
 √ ( )
 The relative distance of the processed data will be in the range of [-1,1]. Combined with clinical
experience [3], this paper will eliminate the physiological data whose absolute relative distance exceeds
0.5.
 (3) Data averaging
 Calculate the average value of the two sets of physiological data after stabilization and the value will
be the final blood pressure and heart rate value of the subjects. The specific formula is as follows:
 ∑ formula 5

3.3. Analysis of processed data
(1) IGCS Coma scoring algorithm
 Drawing lessons from the same field awareness evaluation methods such as the CRS-R and PVS [4],
this paper improves the problem that Qsofa's original collocation GCS awareness evaluation method is
difficult to implement among non-medical practitioners and proposed the IGCS algorithm. Besides, the
algorithm in this paper adds more evaluation items based on GCS to improve the accuracy of
consciousness evaluation and combines the human hearing, vision, language, and perception for
consciousness evaluation [5].
 To improve the operability and accuracy of the evaluation of coma for non-medical people, the
algorithm in this paper examines the auditory ability of the subjects from the following five levels, and
sorts them in order of auditory integrity from high to low, they are complete the corresponding
instructions independently according to the content of the tester, repeat the same content according to
the content of the tester, can only complete the listening position, voice response and no response. The
lower the limit content that the subjects can complete, the lower the score and also shows that the higher
the degree of hearing loss in the subjects’ consciousness. In the actual scoring process, this paper regards
the subjects’ best performance in the consciousness in a hearing test as the final result of this part and
scores as follows: complete the corresponding instructions independently according to the content of the
tester gets 4 points, repeat the same content according to the content of the tester gets 3 points, can only
complete the listening position gets 2 points, voice response gets 1 point and no response gets 0 points.
 In the visual part of consciousness detection, this paper divides the visual test score into 4 levels,
according to the visual retention integrity from high to low, are the eye can recognize objects and achieve
natural blinking, natural blinking but blurred object recognition, eyes can be opened only under external
stimuli and unable to open eyes. If the subjects can complete the content later, the score will be lower

 3
ICAACE 2021 IOP Publishing
Journal of Physics: Conference Series 1848 (2021) 012001 doi:10.1088/1742-6596/1848/1/012001

and it indicates that the subjects have a higher degree of loss of visual awareness. In the evaluation
scoring, this paper takes the subjects’ best situation in conscious vision as the final result of this part and
scores as follows: the eye can recognize objects and achieve natural blinking gets 3 points, natural
blinking but blurred object recognition gets 2 points, eyes can be opened only under external stimuli get
1 point, and unable to open eyes get 0 points. In actual operation, if the subject opens eyes periodically
and blinks smoothly during the observation process without irritation or foreign body sensation, it is
judged as natural eyes opening. If the subject can recognize the basic daily necessities, it is judged as
the subject can realize object recognition.
 In the language part of consciousness detection, this paper divides the language test into 4 levels,
ranked according to the language function retention integrity from high to low, they are responding
correctly to the questions asked by the tester, incoherent expression of the problem, can only pronounce
intermittent phrases and no response. If the subjects can complete the content later, the score will be
lower and it indicates that the subjects’ loss of language consciousness is higher. In the scoring process
of this item, this paper takes the best achievable situation of the subjects in language awareness as the
final result of this part and scores as follows: respond correctly to the questions asked by the tester gets
3 points, incoherent expression of the problem gets 2 points, can only pronounce intermittent phrases
gets 1 point and no response get 0 points.
 In the perception part of consciousness detection, this paper uses the stinging response to realize the
perception evaluation. The specific operation is as follows, by puncturing the subjects’ fingertips and
dividing the response into the following two situations, ranked according to the degree of perceptual
retention from high to low, they are the subjects was stabbed to avoid faster, the subjects have no
response or only a weak response. If the subjects meet the former gets 2 points, otherwise gets 0 points.
 Finally, this section summarizes the consciousness evaluation score scale as follows:

 IGCS score 4 3 2 1 0
 Auditory Complete the Repeat the Can only Voice No response
 ability corresponding same content complete the response
 instructions according to listening
 independently the content position
 according to of the tester
 the content of
 the tester
 Visual The eye can Natural Eyes can be Unable to
 ability recognize blinking but opened only open eyes
 objects and blurred under
 achieve object external
 natural recognition stimuli
 blinking
 Language Respond Incoherent Can only No response
 ability correctly to expression pronounce
 the questions of the intermittent
 asked by the problem phrases
 tester
 Perception Stabbed to No response
 ability avoid faster
 Fig.1 IGCS coma score scale

 (2) Heart rate and blood pressure classification
 To better evaluate the extent to which the user's health indicators exceed the health level, this paper
adopts the idea of tiered scoring to score the health indicators of the tested. Based on medical clinical
data, the upper limit of normal human systolic blood pressure is 130mmHg, and the upper limit of

 4
ICAACE 2021 IOP Publishing
Journal of Physics: Conference Series 1848 (2021) 012001 doi:10.1088/1742-6596/1848/1/012001

healthy resting heart rate is 90 beats per minute [6]. At the same time, the relationship between heart
rate and respiratory rate is 4 times [7]. The specific relation formula is as follows.
 4∗ formula 6
 Based on the above theoretical basis and Qsofa's original scoring principle, this paper divides the
heart rate and blood pressure scores into the following levels as shown in the figure:

 Score 0.00 0.85 0.90 0.95 1.00
 Heart rate, <90 90-110 110-130 130-160 160-220
 Systolic <130 130-140 140-150 150-170 170-200
 pressure,mmHg
 Fig.2 Improved blood pressure and heart rate rating scale in Qsofa algorithm

 (3) IGCS score normalization
 After all the above steps are processed, the blood pressure and heart rate scores of the subjects were
inversely correlated with the index health, while the coma score was positively correlated with the
conscious health. To make all the indicators like Qsofa score, the score, and health is inversely correlated,
this step will combine the data processing ideas TOPSIS to forward the data so as to achieve the effect
that the higher the score [8], the more critical the subject's situation. The processing formula is as follows:
 formula 7
 (4) Score standardization
 To better show the relative severity of the three indicators of coma, blood pressure, and heart rate,
this project normalizes each evaluation to obtain the relative score of each item. The specific formula is
as follows
 formula 8
 _
 is the score of the subject in this item and _ is the highest score that a subject can obtain
theoretically.
 (5) Point weighting
 In the Qsofa evaluation [9], the evaluation considers that blood pressure, heart rate, and coma are
equally important. Therefore, in the final calculation process, the relative scores of the three indicators
give equal importance and the weights of the three indicators are calculated based on the AHP weight
algorithm [10]. The weight calculation algorithm is as follows:
 First, set the important level of blood pressure, heart rate, and coma to 1. That is:
 1 formula 9
 1 formula 10
 1 formula 11
 Then list the analytic hierarchy process matrix based on the AHP algorithm:

 ⎛ ⎞
 ⎜ ⎟ formula 12

 ⎝ ⎠
 After that, calculate the weight of each item according to the algorithm:
 ∙ ∙ formula 13
 ∙ ∙ formula 14
 ∙ ∙ formula 15
 Finally, normalize each weight:
 ∑
 formula 16

 5
ICAACE 2021 IOP Publishing
Journal of Physics: Conference Series 1848 (2021) 012001 doi:10.1088/1742-6596/1848/1/012001

 In the above formulas, , , and represent the importance-level of heart rate, blood pressure,
and coma, , , and represent the non-standardized importance-weights of heart rate, blood
pressure, and coma, and , , and represent the normalized weight of heart rate, blood pressure,
and coma.
 (6) Calculate weighted score
 After the steps above are finished, the final score δ of the subject is calculated based on the formula
17. To make the partitions consistent with the traditional method, this paper uses the following method
to restore the weight. If the score is greater than 2, it is judged as unhealthy.
 3∑ ∙ formula 17

4. Test Results and Discussions

4.1. Experiment design
To verify the effectiveness and reliability of the algorithm in this paper, we used photoplethysmography
technology and improved the Qsofa evaluation method to test and evaluate 100 people randomly and
record relevant data. After the test, the detected data was compared with the use of medical equipment
and the traditional Qsofa evaluation algorithm. Besides, this paper selects 50 people (including medical
professionals and non-medical practitioners) randomly to improve the manual operation of improved
Qsofa and traditional Qsofa and compares the operating difficulty of the two algorithms based on the
difficulty calculation formula. The difficulty calculation formula is as formula 18:
 1 formula 18
 In this formula, represents the difficulty, the greater the value of , the greater the difficulty,
represents the number of correct items per capita, represents the total number of items manipulated,
and / represents the per capita correct rate of the experimenter operation.

4.2. Experimental results and discussion
Comparing the scores of the subjects on the original Qsofa and the improved Qsofa, we get the following
comparison results:

 Subject 1 2 3 4 5 6 7
 number
 Qsofa 1 2 2 1 2 0 0
 Improved 1.5 2.61 2.33 1.68 2.43 0.90 0.83
 Qsofa
 Result healthy unhealthy unhealthy healthy unhealthy healthy healthy
 Fig.3 Comparison of the scoring results between the improved Qsofa algorithm and the traditional
 Qsofa algorithm

 As can be seen from the above figure, the subjects use traditional Qsofa evaluation scores only in 4
grades from 0 to 3 points. After the improved evaluation algorithm in this paper, the score of the subjects
is composed of integers and decimals, and the integer part of the user’s score in the improved algorithm
is consistent with the traditional Qsofa integer score. This shows that the algorithm in this paper not
only can judge the condition of sepsis with the same correct rate as Qsofa but also realizes the refinement
of the severity of the condition of the subjects with the same integer part score, which greatly improves
the accuracy of the condition judgment.
 Hereafter this paper compares the time-consuming algorithm. After test records, the algorithm in this
paper and traditional algorithms take time to evaluate users as follows:

 6
ICAACE 2021 IOP Publishing
Journal of Physics: Conference Series 1848 (2021) 012001 doi:10.1088/1742-6596/1848/1/012001

 100 92

 Number of subjects
 80

 60

 40

 20
 1 5 2
 0 0
 0
 0~30 30~40 40~50 50~60 60~70 70~80
 The algorithm execution time

 (a) Improved Qsofa algorithm operation time
 120
 97
 Number of subjects

 100
 80
 60
 40
 20
 0 1 2 0 0
 0
 0~30 30~40 40~50 50~60 60~70 70~80
 The algorithm execution time

 (b) Traditional Qsofa algorithm operation time
 Fig.4 Comparsion of algorithm opeartion time

 It can be seen from the above figure that if the algorithm in this paper is used, more than 90% of the
evaluation time of the subjects will be about 40 seconds. The traditional Qsofa evaluation takes most of
the time between 40 seconds and 50 seconds, that is, there is no significant difference between the time
consumption of the algorithm in this paper and the traditional algorithm.
 Combined with the comparison of the results of the traditional Qsofa and the improved Qsofa in the
previous part, the improved Qsofa algorithm in this paper is more accurate than the traditional Qsofa in
the evaluation results, and the time-consuming is not significantly different from the traditional Qsofa
algorithm. This also shows that the operating efficiency of this algorithm is slightly higher than the
traditional Qsofa algorithm.
 To better verify the correctness of the heart rate and blood pressure obtained by the algorithm in this
paper, this paper uses a standard medical monitor to calibrate the algorithm index measurement accuracy
of this paper. The results are as follows:

 7
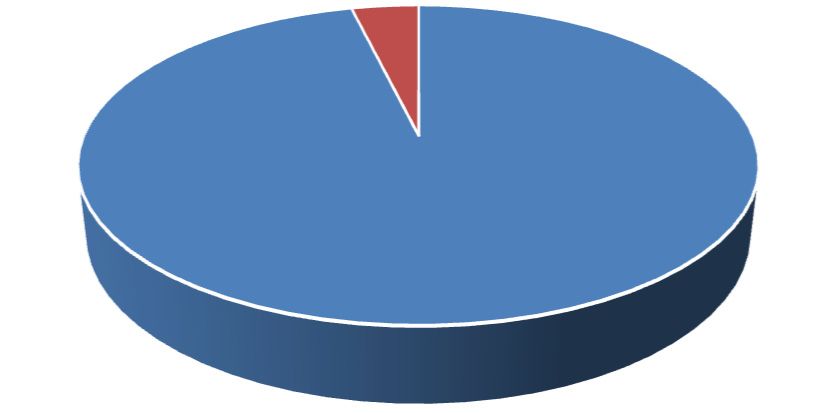
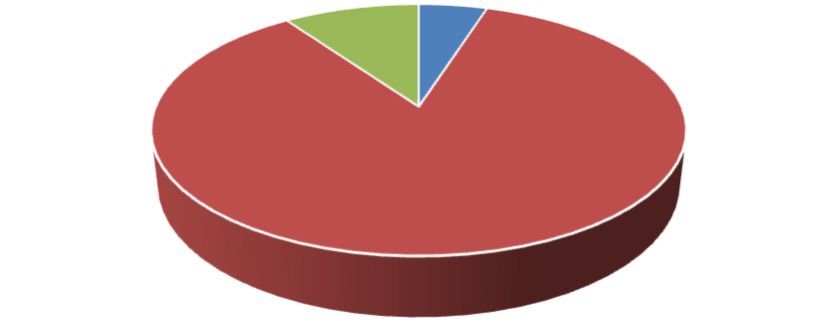
ICAACE 2021 IOP Publishing
Journal of Physics: Conference Series 1848 (2021) 012001 doi:10.1088/1742-6596/1848/1/012001

 3.80%

 96.20%

 Proportion of people with calibration error within 2%
 Proportion of people whose calibration error exceeds 2%

 (a) Distribution of accuracy of blood pressure and heart rate measurement results based on improved
 Qsofa algorithm
 9.80% 4.94%

 85.26%

 Proportion of people with calibration error within 7%
 Proportion of people with calibration error within 7%~13%
 Proportion of people whose calibration error exceeds 13%

 (b) Distribution of accuracy of blood pressure and heart rate measurement results based on traditional
 Qsofa algorithm
 Fig.5 Comparisons of algorithm accuracy

 From the above figure, 96.2% of the heart rate and blood pressure data of the algorithm in this paper
have errors within 2.00% compared with the standard heart rate and blood pressure data. While the heart
rate and blood pressure data obtained by the traditional mean method of wearable devices have errors
around 10% compared with the standard heart rate and blood pressure data. Therefore, the algorithm in
this paper significantly improves the accuracy of blood pressure and heart rate detection by wearable
devices.
 At last, this paper calculates the experimenter’s operation accuracy rate of the improved Qsofa
algorithm in this paper and the operation accuracy rate of the traditional Qsofa algorithm and then finds
the difficulty of the two methods. The higher the P-value, the greater the difficulty. To better compare
the operating difficulty of the two algorithms between medical and non-medical practitioners, 22 of the
50 experimenters were engaged in medical-related positions and had certain medical clinical experience.
The experimental results are as follows:

 8
ICAACE 2021 IOP Publishing
Journal of Physics: Conference Series 1848 (2021) 012001 doi:10.1088/1742-6596/1848/1/012001

 1 0.9

 Operation difficulty
 0.8

 0.6
 0.377
 0.4
 0.173
 0.2
 0.016
 0
 medical practitioners non‐medical practitioners

 traditional Qsofa algorithm improved Qsofa algorithm

 Fig 6 Improved Qsofa algorithm and traditional Qsofa algorithm operation difficulty comparison
 between medical and non-medical practitioners

 From the above results, it can be seen that among non-medical practitioners, the per capita operating
accuracy rate of traditional Qsofa is less than 10%, that is, the operating difficulty of traditional Qsofa
for non-medical practitioners is about 0.9, while the per capita operating accuracy rate of improved
Qsofa is 62.3%, that is, the difficulty value 0.377. Among medical practitioners, the per capita
correct rate of traditional Qsofa is 82.7%, that is, the difficulty value 0.173, and the per capita
correct rate of improved Qsofa is 98.4%, 0.016. From the above data, it can be concluded that the
improvement of Qsofa greatly reduces the difficulty of algorithm evaluation, whether in medical
practitioners or non-medical practitioners. Among them, the improved Qsofa reduces the difficulty of
operation by about 58% among non-medical practitioners and improves the accuracy of the algorithm
operation by about 18.98% among medical practitioners.

5. Conclusion
According to the experimental results, in the process of data processing, the algorithm in this paper
greatly improves the accuracy of the photoelectric volume module of the wearable device in the
measurement of heart rate and blood pressure. In terms of comprehensive health assessment, the
algorithm in this paper simplifies the coma evaluation method, thereby greatly reducing the difficulty
of Qsofa evaluation. Among them, from the perspective of the difficulty of operation by non-medical
practitioners, the difficulty of implementing the algorithm in this group is 58% lower than that of the
original algorithm. From the perspective of medical practitioners, the accuracy of the algorithm in this
paper is 18.98% higher than that of the original algorithm. In terms of the algorithm operation process
and effect, the algorithm in this paper not only shows the health of the subject in a more precise manner
but also the running time of the algorithm is not significantly prolonged, which also shows that the
algorithm in this paper operates better. In general, the algorithm in this paper has a significant
improvement in heart rate and blood pressure numerical processing and health analysis compared to
traditional algorithms, and it has good significance for the analysis of emergency sepsis health in
wearable devices.

Acknowledgment
This work is financially supported by National innovation and entrepreneurship training program for
college students. The authors deeply appreciate the support.

References
[1] van Campen C L M C, Rowe P C, Visser F C. Heart Rate Thresholds to Limit Activity in Myalgic
 Encephalomyelitis/Chronic Fatigue Syndrome Patients (Pacing): Comparison of Heart Rate
 Formulae and Measurements of the Heart Rate at the Lactic Acidosis Threshold during
 Cardiopulmonary Exercise Testing[J]. Advances in Physical Education, 2020, 10(2): 138-154.

 9
ICAACE 2021 IOP Publishing
Journal of Physics: Conference Series 1848 (2021) 012001 doi:10.1088/1742-6596/1848/1/012001

[2] Chen Q, Chen J, Zhou C, et al. Blood loss in primary total knee replacement with intra-articular
 injection of tranexamic acid and presurization[J]. Chinese Journal of Tissue Engineering
 Research, 2016, 20(44): 6564-6569.
[3] Anderson F. Assessing the Association between Heart Attack, High Blood Pressure, and Heart
 Disease Mortality Rates and Particulate Matter and Socioeconomic Status Using Multivariate
 Geostatistical Model[J]. Occupational Diseases and Environmental Medicine, 2016, 4(01): 8.
[4] Annen J, Filippini M M, Bonin E, et al. Diagnostic accuracy of the CRS-R index in patients with
 disorders of consciousness[J]. Brain injury, 2019, 33(11): 1409-1412.
[5] Garza N, Toussi A, Wilson M, et al. The increasing age of TBI patients at a single level 1 trauma
 center and the discordance between GCS and CT Rotterdam scores in the elderly[J]. Frontiers
 in neurology, 2020, 11: 112.
[6] Vignoli A, Tenori L, Luchinat C, et al. Differential Network Analysis Reveals Molecular
 Determinants Associated with Blood Pressure and Heart Rate in Healthy Subjects[J]. Journal
 of Proteome Research, 2020.
[7] Wadhwa V, Gonzalez A J, Selema K, et al. Novel device for monitoring respiratory rate during
 endoscopy-A thermodynamic sensor[J]. World journal of gastrointestinal pharmacology and
 therapeutics, 2019, 10(3): 57.
[8] Meshram S G, Alvandi E, Meshram C, et al. Application of SAW and TOPSIS in prioritizing
 watersheds[J]. Water Resources Management, 2020, 34(2): 715-732.
[9] Shahsavarinia K, Moharramzadeh P, Arvanagi R J, et al. qSOFA score for prediction of sepsis
 outcome in emergency department[J]. Pakistan Journal of Medical Sciences, 2020, 36(4): 668.
[10] Han Y, Wang Z, Lu X, et al. Application of AHP to road selection[J]. ISPRS International Journal
 of Geo-Information, 2020, 9(2): 86.

 10
You can also read