Wildlife Poaching Prediction with Data and Human Knowledge - AI for Social Good
←
→
Page content transcription
If your browser does not render page correctly, please read the page content below
Wildlife Poaching Prediction with Data and Human
                       Knowledge ∗

              Swaminathan Gurumurthy1 , Lantao Yu2 , Chenyan Zhang3 , Yongchao Jin4 ,
                              Weiping Li4 , Xiaodong Zhang5 , Fei Fang1
           1
             Carnegie Mellon University, 2 Shanghai Jiao Tong University, 3 Southeast University
                    4
                      World Wild Fund for Nature, China, 5 Huang Ni He Forest Bureau
         sgurumur@andrew.cmu.edu, yulantao@apex.sjtu.edu.cn, cy.zhang@seu.edu.cn,
    jinyongchao@orientscape.com, wpli@wwfchina.org, 1009595567@qq.com, feifang@cmu.edu

                                                   Abstract
              Poaching continues to be a significant threat to the conservation of wildlife and
              the associated ecosystem. Estimating and predicting where the poachers have
              committed or would commit crimes is essential to effective allocation of patrolling
              resources. The real-world data in this domain is often sparse, noisy and incomplete,
              consisting of a small number of positive data (poaching signs), a large number of
              negative data with label uncertainty, and an even larger number of unlabeled data.
              Fortunately, domain experts such as rangers can provide complementary informa-
              tion about poaching activity patterns. However, this kind of human knowledge
              has rarely been used in previous approaches. In this paper, we contribute new
              solutions to eliciting this knowledge from the experts and using that in conjunction
              with existing data to improve the performance of machine learning models. In
              collaboration with the World Wild Fund for Nature, we show that incorporating
              human knowledge leads to better predictions in a conservation area in Northeastern
              China where the charismatic species is Siberian Tiger.

1        Introduction
Wildlife conservation agencies try multiple solutions to protect the wildlife and their habitats from
poaching and illegal trade. One of these is to send rangers to patrol in protected conservation areas [9].
However, because of limited patrolling resources, it is impossible to monitor all intrusion routes and
protect the entire area. Thankfully, rangers record their findings, including animal signs and poaching
activity signs, e.g., snares placed by poachers during the patrol. One can analyze these records to get
insights into the poaching patterns and strategically allocate resources to detect and deter poaching
activities. There have been several previous works that provided predictive tools through designing
machine learning models trained and evaluated using real-world data from two conservation sites in
Uganda [11, 7, 4, 5]. Despite the effort made towards addressing these challenges, the sparsity of
positive data (poaching activity found) is still a major challenge. In this paper, we tackle this issue by
(i) exploiting the unlabeled data (regions not patrolled) to assist learning, and (ii) exploiting human
knowledge from domain experts such as conservation site managers and rangers in a quantitative way.
We provide the following contributions: (1) We present an approach to elicit quantitative information
about poaching threat from domain experts in the form of weak labels for clusters of data points.
(2) We provide two approaches to exploiting human knowledge to enhance machine-learning-based
predictive analysis. The first approach is to sample negative data points from unlabeled data. The
second approach is to sample positive and/or negative data points using the cluster-based estimation
of poaching threat. (3) We evaluate our proposed approaches using data from 2014-2018 in a
conservation area in China. Our experimental results show that incorporating human knowledge can
improve the performance of the predictive model.
     ∗
         All results in the paper have already been published in COMPASS 2018 conference.

32nd Conference on Neural Information Processing Systems (NIPS 2018), Montréal, Canada.
2 Related Work
There has been some previous work focusing on understanding and predicting poaching activities.
[10] and [12] analyze the physical environment and find correlations between certain features and
poaching incidents. More recently, machine learning based approaches have been explored to predict
poaching. [11] uses a Dynamic Bayesian Network that explicitly models the dependencies between
occurrence and detection of poaching activities, as well as the temporal pattern of poaching. [7]
designs an ensemble of decision trees which incorporate spatial correlation of poaching to account
for the undetected instances. [4] provides a hybrid model that combines decision trees and Markov
Random Fields [4] to exploit the spatiotemporal correlation of poaching activities. [5] proposes
to weigh the negative data points in the training set based on patrol effort so as to account for the
label uncertainty. However, the challenge of having limited data is not fully resolved and human
knowledge is only used in very limited ways in previous works such as to select features to be
considered and to represent the dependency and correlation relationships. In addition to wildlife
poaching, predicting other types of crimes based on real-world data has been studied using general
principles such as “crime predicts crime” in criminology[13, 6]. However, most of these rely on a
sufficiently large dataset and ignore the fact that there are undetected or unreported crime instances.
Thus, new methods for exploiting expert knowledge and using this implicit information in the data is
needed to efficiently handle cases with limited real-world data.
3 Domain Description and Real-World Dataset
3.1 Construction of Dataset
In this paper, we focus on Huang Ni He National Nature Reserve (HNHR), a conservation area
spanning about 75 sq. km in Northeastern China where the charismatic species is Siberian Tiger. We
divide the area into 1km grid cells and construct a dataset where each data point corresponds to a grid
cell in a patrol season. The label for each data point indicates the occurrence of poaching activity
in that grid cell in that patrol season. Thus, grid cells which have been patrolled but no snares were
found would be labeled as negative. And grid cells where the snares were found would be labeled
as positive. The grid cells which haven’t even been patrolled are treated as unlabeled data. The
features of each data point include: the distance from each area to the closest stream, village, patrol
post, river, marsh, village road, provincial road, national road, highway, conservation boundary; land
type, the elevation and slope of each area; patrol length (total distance patrolled in the grid) in last
patrol season. The patrolling and poaching data was recorded using SMART starting from 2014. The
geo-spacial features were extracted using a veriety of tools like ArcMap and QGIS. The details can
be found in the full version of our paper† .
3.2 Challenges in the Dataset
The lack of patrolling resources leads to a dataset
with several challenges and peculiarities. It suffers
from significant class imbalance, sparsity and noise
in negative labels.
In fact, as can be seen in Figure 1, the dataset is
extremely skewed with very few positive examples
(29.5 on average‡ ) in contrast to a large number of
negative examples (9310.5 on average). In addition,
only a small portion of the area is patrolled every
year, leading to a very large set of unlabeled data
(44493.25 on average). Additionally, since the snares
are hard to detect, the patrollers might have simply
missed the snares in certain regions while patrolling
and hence a lot of the negative data points might
indeed be positive. Therefore, we expect noise in the Figure 1: Number of data points (Log scale)
negative labels in our dataset.
†
https://arxiv.org/abs/1805.05356
‡
Average across all years except 2017-2018. The data in 2017-2018 is not complete and is thus excluded.
24 Methodology
Given the dataset, we aim to train a model that can predict or estimate the label for any data point
using geographical and patrol features. To help address the challenges of the dataset, we propose an
approach to elicit and exploit human knowledge. First, we collect quantitative domain knowledge
from experts through questionnaires built upon clustering. Second, we use the collected quantitative
domain knowledge to augment the dataset. Third, we use data duplication to alleviate the dataset
skew towards negative examples. Fourth, noting that most of the unlabeled data are negative data, we
augment the negative dataset with a randomly sampled subset of the unlabeled data. We will discuss
these approaches in more detail in subsequent sections.
4.1 Eliciting Information from Domain Experts
We consider several factors while collecting domain knowledge from
the experts. Firstly, it is not possible for the experts to give very
accurate and fine-grained information (e.g, the specific probabilities
for every region). Second, the experts cannot be expected to label a
huge amount of data given the limited amount of resources and time
they have. Third, it should be expected that the information provided
by the experts can be noisy. Hence, we have to settle for a limited
amount of information which is coarse-grained and noisy. Thus, we
Figure 2: Visualization of the develop the following scheme.Instead of asking the experts to score
40 clusters each individual cell,we first group these cells into clusters using K-
means clustering in the feature space. We then present these clusters
to the experts and ask them to provide a score for each cluster from 1 to 10, where 1 corresponds
to minimum threat level and 10 corresponds to maximum threat level. After discussions with the
domain experts, we chose to limit to 40 − 50 clusters to ensure consistency across the labeling on a
given set of clusters. Thus, we repeat this procedure twice, first with 40 clusters and then with 50
clusters. This helps account for any inconsistency in the scores provided by the experts. But, it also
introduces 2 sets of scores for each grid cell. In order to combine these two sets of cluster scores,
we propose a simple approach. If a grid cell k belongs to a cluster Ci1 with score s1 (Ci1 ) when 40
clusters are used and belongs to a cluster Cj2 with score s2 (Cj2 ) when 50 clusters are used, we define
the aggregated score as the minimum of the two, i.e.,
s(k) = min{s1 (Ci1 ), s2 (Cj2 )}
In other words, we assign a high score to a data point only if it received a high score in both cluster
sets. This approach helps us extract useful information about the threat level without causing much
cognitive burden on the experts. See Figure 2 for visualizations of the 40 clusters in the map.
4.2 Data Augmentation
In order to tackle the unique properties of the dataset we propose three ways to perform data
augmentation. First, we need to balance the dataset. Balancing the dataset is important to ensure that
the model does not classify all examples as negative, since that would achieve a very high accuracy in
an imbalanced dataset. To this end, we simply duplicate the positive examples to balance the dataset
during training, (called Data Duplication). Second, we add a random partition of the unlabeled set
into the negative set during training, ( called Negative Sampling (NS)). This flows from the fact
that most of the unlabeled examples are low threat regions, since the experts chose not to explore
those regions. Third, we propose to use the aggregated score computed using the cluster labels to
add the unlabeled data points that are likely to have positive labels to the positive dataset, (called
Score based Positive Sampling (PS)). This helps us incorporate some of the domain knowledge of
the experts into the label assignments in the dataset.
4.3 Model Implementations
Bagging Ensemble Decision Tree: We use bagging ensemble decision tree [2] with 1000 trees
where each base tree is trained using only 10 percent of the total training data. We use entropy to
compute the information gain at each node. We use the implementation provided scikit-learn with the
above mentioned parameters to train the model.
Neural Networks: We also use a three-layer feedforward neural network [8] with 8 neurons on the
first layer, 4 neurons on the second layers and a single neuron in the last layer spitting out the threat
probability for that data point. We use relu nonlinearity in the first and second layers and a sigmoid at
the output. To predict the final output we use an ensemble of 100 such neural networks.
35 Evaluation
5.1 Evaluation on Dataset
Given the limited number of positive
Table 1: Model Scores : Contribution of each component samples in the dataset, we perform 4-
fold cross validation to train and test our
Models LL score Recall Precision F1 score model performance multiple times and
Random decisions 0.51 0.5 0.004 0.008
DT 0.0 nan 0.0 0.000
average the results across all the runs.
DT with DD 14.60 0.31 0.17 0.219 The dataset here includes the entire data
DT with SMOTE 11.19 0.35 0.12 0.179 collected between 2013 to 2018. Table 1
DT with DD, PS 4.99 0.35 0.05 0.087 contains the precision, recall, F1 and the
DT with DD and NS 14.05 0.27 0.19 0.223 ll scores for the model and multiple base-
DT with DD, NS, PS 15.42 0.31 0.18 0.227
NN 0.0 nan 0.0 0.000 lines. We choose to report the ll score
NN with DD 3.26 0.72 0.016 0.031 because it offers better discriminability
NN with DD, NS 2.47 0.48 0.02 0.038 since it’s not bounded between [0, 1] In
NN with DD, NS, PS 3.70 0.79 0.02 0.039 the experiments listed in the Table 1, DD
indicates Data Duplication. We find that
data duplication is very crucial. The model completely fails (predicts negative labels for every
example) if we remove this component. We test another data oversampling technique called SMOTE:
Synthetic Minority Over-sampling Technique [3] to compare against data duplication. We observe
that this does not help with our dataset. For DT, we also observe that the Positive Sampling (PS)
when added standalone significantly deteriorates the precision since it leads to an increase in the
false positive rate. Adding Negative sampling (NS) standalone does not offer much benefit either.
But adding both positive and negative sampling together leads to a boost in performance. In fact, a
combination of NS and PS results in performance improvement in the neural network as well. This
shows that expert knowledge can boost the performance of both the machine learning models even if
their relative performances are very different. We observe that the neural network has a very high
false positive rate even after training with Negative sampling resulting in poor performance overall.
We also include the scores computed when using a random classifier which labels any example as
positive with probability 0.5 to give the readers a sense of baseline values for each of the scores.
5.2 Field Tests
The predictions of poaching activities made based on DT with DD and NS
trained on 2013-2017 dataset has been used to guide two sets of field tests.
In October 2017, a two-day field test was conducted in HNHR. The rangers
selected two patrol routes selected two of the patrol routes predicted by our
model which had not been frequently patrolled earlier. During the field test,
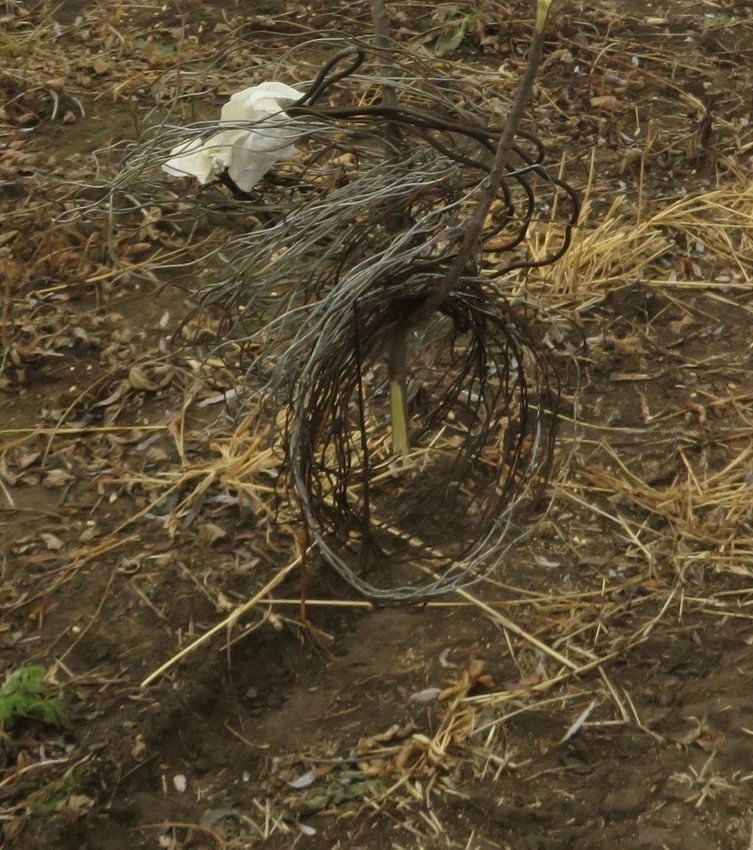
22 snares were found(see Figure 3). From November 2017 to February 2018,
a set of 34 patrol shifts were undertaken (each taking an avg of 2.85 hours).
During these patrols, 7 snares were found. However, rangers attribute the low
number of findings to the reduced tolerance to poaching in China this year, as
can be seen from a set of changes in policy [1]. Figure 3: Snares
found in pilot test.
6 Conclusion and Discussion
In this paper, we focus on eliciting and exploiting human knowledge to enhance the predictive
analysis in wildlife poaching. We designed questionnaires to elicit information from domain experts
in the form of weak labels over clusters of data points and use them to augment training data. We
show significant improvement in performance using multiple evaluation criteria for two classifiers,
decision trees, and neural networks. Taking cues from the results obtained on these exemplar model,
we expect improved performance on more complex models as well. Also, it is important to note
that our approach is fairly generic and can be used in a variety of other settings, where the expert
knowledge is costly and a large portion of the data is unlabeled.
Acknowledgments
We thank rangers from Huang Ni He Forest Bureau, China and officers from WWF China Northeastern
Office. We thank Tianyu Gu and Justin Jia for their help in analyzing the data and for providing
valuable feedback.
4References
[1] Rachael Bale. China shuts down its legal ivory trade, 2017.
[2] Leo Breiman. Bagging predictors. Machine learning, 24(2):123–140, 1996.
[3] N.V. Chawla, K.W. Bowyer, L.O. Hall, and W.P. Kegelmeyer. Smote: Synthetic minority
over-sampling technique. Journal of Artificial Intelligence Research, 2002.
[4] Shahrzad Gholami, Benjamin Ford, Fei Fang, Andrew Plumptre, Milind Tambe, Margaret
Driciru, Fred Wanyama, Aggrey Rwetsiba, Mustapha Nsubaga, and Joshua Mabonga. Taking
it for a test drive: a hybrid spatio-temporal model for wildlife poaching prediction evaluated
through a controlled field test. In Joint European Conference on Machine Learning and
Knowledge Discovery in Databases, pages 292–304. Springer, 2017.
[5] Shahrzad Gholami, Sara Mc Carthy, Bistra Dilkina, Andrew Plumptre, Milind Tambe, Margaret
Driciru, Fred Wanyama, Aggrey Rwetsiba, Mustapha Nsubaga, Joshua Mabonga, et al. Ad-
versary models account for imperfect crime data: Forecasting and planning against real-world
poachers. 2018.
[6] Hyeon-Woo Kang and Hang-Bong Kang. Prediction of crime occurrence from multi-modal
data using deep learning. PloS one, 12(4):e0176244, 2017.
[7] Debarun Kar, Benjamin Ford, Shahrzad Gholami, Fei Fang, Andrew Plumptre, Milind Tambe,
Margaret Driciru, Fred Wanyama, Aggrey Rwetsiba, Mustapha Nsubaga, et al. Cloudy with a
chance of poaching: adversary behavior modeling and forecasting with real-world poaching
data. In Proceedings of the 16th Conference on Autonomous Agents and MultiAgent Systems,
pages 159–167. International Foundation for Autonomous Agents and Multiagent Systems,
2017.
[8] Yann LeCun, Yoshua Bengio, and Geoffrey Hinton. Deep learning. nature, 521(7553):436,
2015.
[9] Andrew M Lemieux. Situational prevention of poaching, volume 15. Routledge, 2014.
[10] Jennifer F Moore, Felix Mulindahabi, Michel K Masozera, James D Nichols, James E Hines,
Ezechiel Turikunkiko, and Madan K Oli. Are ranger patrols effective in reducing poaching-
related threats within protected areas? Journal of Applied Ecology, 2017.
[11] Thanh H Nguyen, Arunesh Sinha, Shahrzad Gholami, Andrew Plumptre, Lucas Joppa, Milind
Tambe, Margaret Driciru, Fred Wanyama, Aggrey Rwetsiba, Rob Critchlow, et al. Capture: A
new predictive anti-poaching tool for wildlife protection. In Proceedings of the 2016 Interna-
tional Conference on Autonomous Agents & Multiagent Systems, pages 767–775. International
Foundation for Autonomous Agents and Multiagent Systems, 2016.
[12] Michael J Shaffer and Joseph A Bishop. Predicting and preventing elephant poaching incidents
through statistical analysis, gis-based risk analysis, and aerial surveillance flight path modeling.
Tropical Conservation Science, 9(1):525–548, 2016.
[13] Somayeh Shojaee, Aida Mustapha, Fatimah Sidi, and Marzanah A Jabar. A study on classi-
fication learning algorithms to predict crime status. International Journal of Digital Content
Technology and its Applications, 7(9):361, 2013.
5You can also read