Time Series Modeling of Guinea Fowls Production in Kenya Using the ARIMA and ARFIMA Models
←
→
Page content transcription
If your browser does not render page correctly, please read the page content below
International Journal of Data Science and Analysis
2021; 7(1): 1-7
http://www.sciencepublishinggroup.com/j/ijdsa
doi: 10.11648/j.ijdsa.20210701.11
ISSN: 2575-1883 (Print); ISSN: 2575-1891 (Online)

Time Series Modeling of Guinea Fowls Production in Kenya
Using the ARIMA and ARFIMA Models
Cecilia Mbithe Titus*, Anthony Wanjoya, Thomas Mageto
Department of Statistics and Actuarial Science, Jomo Kenyatta University of Agriculture and Technology, Nairobi, Kenya

Email address:
*
    Corresponding author

To cite this article:
Cecilia Mbithe Titus, Anthony Wanjoya, Thomas Mageto. Time Series Modeling of Guinea Fowls Production in Kenya Using the ARIMA and
ARFIMA Models. International Journal of Data Science and Analysis. Vol. 7, No. 1, 2021, pp. 1-7. doi: 10.11648/j.ijdsa.20210701.11

Received: January 26, 2021; Accepted: February 6, 2021; Published: February 10, 2021

Abstract: Commercial farming of Guinea Fowls is at its infant stages and is generating a lot of interest for farmers in Kenya.
This, coupled with an increased demand for poultry products in the Kenyan market in the recent past, calls for the rearing of
the guinea fowls which are birds reared for meat and partly for eggs. In order to have an efficient production of poultry
products for this type of poultry farming, there is need for an efficient modeling using sound statistical methodologies. It’s in
this regard that the study modeled Guinea Fowl production in Kenya using the Univariate Auto-Regressive Integrated Moving
Average (ARIMA) and the Auto-Regressive Fractional Integrated Moving Average (ARFIMA) models. Yearly guinea fowl
production data for the period of 2010 to 2019 obtained from Food and Agricultural Organization (FAO-Kenya) was used in
the study in which the Augmented Dickey Fuller (ADF) test was used to check for stationarity while the Hurst Exponent was
used to test the long-memory property of the series. The ARIMA and ARFIMA models gave a better fit to the data and were
used to forecast Guinea Fowl Weights. Fitted model forecast were evaluated via the Random Mean Squared Error (RMSE) in
which the ARFIMA model was found to give a better forecast of the Guinea Fowl weights compared to the ARIMA model.

Keywords: Poultry Farming, Auto-Regression, Fractional Integration, Long-Memory, Augmented Dickey Fuller (ADF) Test,
                  Random Mean Squared Error (RMSE)

                                                                      are not feasible.
1. Introduction                                                          Most of the birds reared in this communities are on free
   Food security is becoming a major concern in Kenya due             range production systems since not only are they affordable
to the rapid urbanization and the ever growing population of          to these farming communities but also have fitting benefit
her citizens. To address this there is need to develop sound          into the cultural and social-economic lives of the associated
agricultural policies aimed at improving the agricultural             rural farming communities. To help understand the
output while at the same time preserving the environment.             mechanization required so as to improve the poultry farming
Poultry farming is considered as one of those sectors that            output with regard to feed diversification, this study had a
need to the modernized so as to maximize output and help              look at the rearing of guinea fowls in Kenya.
curb the food insecurity problem. This is due to the fact that           Commercial farming of guinea fowls is at its infant stages
there has been an increased demand for poultry meat in the            in Kenya and this type of farming is generating a lot of
recent past thus calling for the mechanization of the poultry         interest. They are raised mainly for their flesh and partly for
farming sector.                                                       eggs since their meat is tender and nutritious with a fine
   Rural poultry production over the years has been centered          flavor similar to other game birds. It is lean and rich in
on local chickens as a major contributor of protein                   essential fatty acids.
availability for most of the rural communities. It has also              It’s in this regard that this study evaluates Guinea Fowls
supported crop agriculture where sales of chickens are made           production in Kenya with respect to their weights subject to
to support rural farmers’ revenue input to crop production or         different poultry feeds. The ARIMA and ARFIMA models
as a cushion when revenues expected from crop production              were used in the study. The study thus aimed at identifying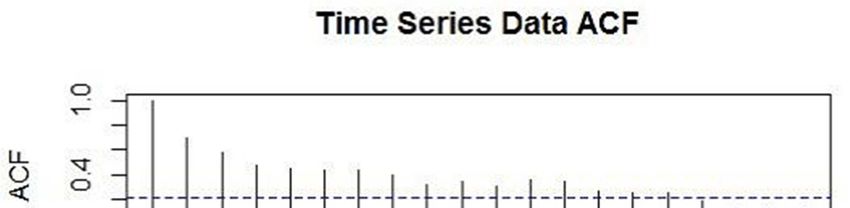
2                      Cecilia Mbithe Titus et al.: Time Series Modeling of Guinea Fowls Production in Kenya
                                                Using the ARIMA and ARFIMA Models

the order of ARIMA and ARFIMA models, estimate                     this study are organized as follows: chapter two for the
parameters of the models, make relevant forecasts and              literature review, chapter three for the study methodology,
compare the relative forecasting performance of the fitted         chapter four for the data analysis and chapter five for the
models so as to obtain the model that gives a better fit.          conclusions & recommendations.
1.1. Statement of the Problem
                                                                   2. Literature Review
   With an increased demand for poultry products there is
need for the market players to respond by ensuring there is an     2.1. Introduction
adequate supply of the same products since an increased               This chapter was established with the intention of studying
poultry weight translates to an increased poultry mean             previous works on poultry modeling so as to get appropriate
production [4]. There has been extensive statistical research      theories and experiential proves to substantiate the study.
in poultry farming aimed at establishing the relationship that
exist between body weight and different poultry feeds. This        2.2. Literature Review
statistical modeling of poultry production has allowed
farmers and researchers to describe and understand biological         In the modeling of poultry production, Sankar [1] used the
processes and prioritize the aims of production research from      auto-regressive (AR), moving average (MA) and the
identifying the study components to evaluating the effect on       auto-regressive integrated moving average (ARIMA) to
the response variables.                                            select an appropriate stochastic model for egg production
   This study sought to model the weight of guinea fowls           while Shakeel et al [9] modeled and forecasted Beef, Mutton,
subject to different types of poultry feeds namely;                Poultry meat and total meat production using the them time
Horse-bean, Linseed, Soybean, Sunflower, Meat-meal and             series ARIMA models.
Casein using the Auto-Regressive Integrated Moving                    Gale & Arnade [2] used the generalized Leontif functional
Average (ARIMA) stochastic models in comparison to the             form of the marginal cost to model the effect of rising
Auto-Regressive Fractional Integrated Moving Average               chicken feeds and labor costs on chicken price while Ahmad
(ARFIMA) model. This was aimed at identifying the best             [3] studied egg production forecasting using the general
stochastic (ARIMA/ARFIMA) model for modeling of guinea             regression neural network in comparison to the linear
fowl production where the guinea fowls were clustered into         regression predictions and the Gompertz nonlinear model.
six groups and each group subjected exclusively to one of the         This was as with Raji et al [10] who estimated model
feeds and the mean weight of the clusters recorded at              parameters of the Japanese quail growth curve using the
different times.                                                   Gompertz model and Semara et al [13] who compared some
                                                                   non-linear functions for describing broiler growth curves of
1.2. Objectives                                                    Cobb500 strain using the Gompertz model.
                                                                      Hanus et al, Yakubu et al, Nosike et al, Abiyu and
1.2.1. General Objective                                           Dzungwe et al used the linear and multiple linear regression
  The general objective of this study was to model the             models to study the effect of poultry linear body
Guinea Fowls production in Kenya using the Auto-                   measurements on poultry body weight, an application to
Regressive Integrated Moving Average (ARIMA & ARFIMA)              chicken and guinea fowl production [4-7, 15].
models.                                                               Luis et al [8] used the distributed-delay model to predict
1.2.2. Specific Objectives                                         egg production in laying hens while Isife et al [11] had a
   This study was guided by the following specific                 design and simulated study of an automated poultry feed
objectives;                                                        mixing machine using the virtual multipoint Near Infrared
   To model guinea fowl production for different poultry           Spec-troscopy (NIRS) analysis with its accompanying sensor
feeds using the Auto- Regressive Integrated Moving Average         probes.
(ARIMA & ARFIMA) models.                                              Ahmad [12] modeled poultry growth using Neural
   To estimate the model parameters of the fitted stochastic       Networks and simulated data and Abdul et al [14] had a
models (ARIMA & ARFIMA) and use them to forecast the               relative economic value estimation of Guinea Fowl
Guinea Fowl production.                                            production traits using the partial budgeting technique.
   To perform the model adequacy tests of the fitted time
series models (ARIMA & ARFIMA) in modeling the Guinea              3. Methodology
Fowl production.
                                                                   3.1. Introduction
1.3. Outline of the Study
                                                                      This chapter discusses the ARIMA and ARFIMA models
   This study was centered on the use of the Auto-Regressive       used in the modeling of Guinea Fowls production in Kenya.
Integrated Moving Average methodologies (ARIMA &                   A mention of the data, model diagnostics and the fitted model
ARFIMA) to model the weights of guinea fowls at different          forecasts are also given.
times for different poultry feeds. The subsequent sections of
                                                                   3.2. Data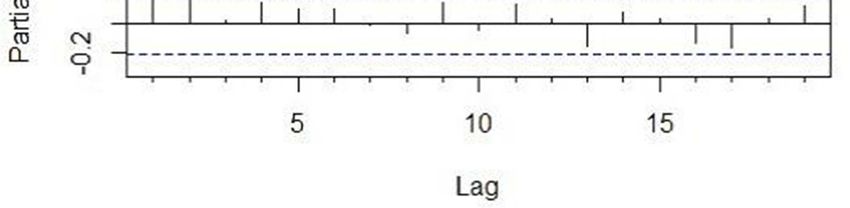
International Journal of Data Science and Analysis 2021; 7(1): 1-7                                     3

   The data for the study included monthly number of guinea               model. The general expression of the ARFIMA process * is
fowls produced and their weight with regard to the different              defined by the equation;
poultry feeds fed to them. This were be obtained from the
Food Agricultural Organization (FAO) Kenya. This was for                                 Φ(.)* = Θ(.)(1 − .)%0 3                             (5)
the period 2010 to 2019.                                                     Where Φ(.) = 1 − Φ . − ⋯ − Φ6 .- and Θ(.) = 1 +
                                                                          Θ . + ⋯ + Θ2 .2 are the AR and MA terms respectively.
3.3. Time Series Modeling
                                                                             B is the backward shift operator and (1 − .)%0 is the
   This involved the fitting of the time series models to the             fractional differencing operator given by the binomial
data. This study used the Box-Jenkins procedure to achieve                expression;
this and is defined as; model identification, model estimation,                                                   8( 90)
model verification, test for the white noise and then                                 (1 − .)%0 = ∑< =                        . = ∑< = ; .   (6)
                                                                                                                 8( 9 )8(:)
forecasting of the fitted models. The Auto-Regressive
Integrated     Moving     Average      (ARIMA)       and    the           3.4. Parameter Estimation
Auto-Regressive Fractional Integrated Moving Average
                                                                            For the Integrated Time Series models, we define a special
(ARFIMA) models were used in the modeling of the Guinea                   case of the models in which Θ(.) = Φ(.) = 1 with a
Fowl Production.                                                          spectral density given as;
3.3.1. Stationarity Test                                                                                    @A C                %B0
   Prior to the fitting of the Auto-Regressive models to the                                    >(?) =        D E1     − 3 %FG E             (7)
                                                                                                            BC %C
Guinea Fowls Production data, the data was tested for
stationarity using the Augmented Dickey-Fuller (ADF) test.                   Parameter estimation was via the maximum likelihood
By letting     to be the coefficient of the lagged dependent              estimation technique and the associated log-likelihood was
variable (Guinea Fowl Weights), the test statistic is given as;           given as;
                                                                                                 C                                 C T(G)
                             =                                    (1)         H(Ω) ≈ −         LD%C logP2R>(?)S 4? + D%C      4?V            (8)
                                                                                          KC                             U(G)

                                                                                                 |YZ [ \]Z |A
3.3.2. Long Memory Test                                                   where W(?) = ∑^                       is the periodogram.
                                                                                                     BC^
   The Hurst Exponent produced by re-scaled range analysis
was used to test for the long memory in the series. This was               3.5. Order Determination and Model Diagnostics
by first estimating the range (R) for a given period ( ) of the
series as;                                                                   Order determination for the fitted models was via the AIC
                                                                          & BIC information criterion. Goodness of fit tests for the
           = max ∑           −        − max ∑           −         (2)     fitted models was via the Ljung Box-Test, Standardized
                                                                          Residuals, Random Mean Squared Error and the analysis of
where is the overall mean of the series. Letting  to be the               residual auto-correlation functions (ACFs) and partial
standard deviation of , we have the Hurst exponent as;                    auto-correlation functions (PACFs).
                              "
                             ! # %&'( )
                                 $#
                         =                                        (3)     4. Results and Discussions
                                 &'(

  When 0 < H < 1 there exists a long-memory structure in the              4.1. Introduction
series.
                                                                             This chapter is established on the premises of giving a data
3.3.3. The Auto-Regressive Integrated Moving Average                      analysis for the Auto- Regressive Integrated Moving Average
       Models                                                             (ARIMA) and Auto- Regressive Fractional Integrated
  In order to model the time series data (Guinea Fowl                     Moving Average (ARFIMA) Models in modeling poultry
Weights Production Data), the ARIMA and ARFIMA models                     feed effect on Guinea fowl production in Kenya.
were fit to the data.
                                                                          4.2. Exploratory Data Analysis
  The general expression of the ARIMA process * is
defined by the equation;                                                     To aid in the preliminary exploration of the data, a total of
                                                                          87 observations on the weights of Guinea Fowls was used in
                  1 − Φ- . ∇0 * = 1 − Θ2 . 3                      (4)
                                                                          the study. Newly hatched Guinea Fowls were randomly
  Where 1 − Φ- . ∇0 * = 3 is the Auto-Regressive                          allocated into six groups and each group given a different
component (AR) and * = 1 − Θ2 . ∇0 3 is the                               feed supplements (horse-bean, linseed, soybean, sunflower,
                                                                          meat meal and casein) in which their weights after Four
Moving-Average (MA) component.
                                                                          weeks were recorded in grams.
  In the case of the integration parameter 4 being fractional
and greater than zero, the ARIMA model exhibits a long                    4.2.1. Descriptive Statistics of the Data
memory process and is thus referred to as the ARFIMA                        Table 1 gave the descriptive statistics of the Guinea Fowl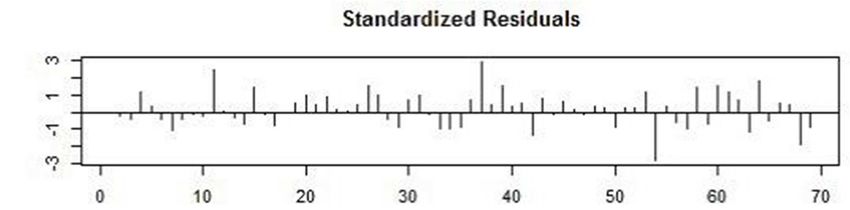
4                           Cecilia Mbithe Titus et al.: Time Series Modeling of Guinea Fowls Production in Kenya
                                                     Using the ARIMA and ARFIMA Models

weights in which the mean weight was estimated at 286.6
grams with a median of 295 grams. The maximum and
minimum weights were 439 grams and 108 grams
respectively. The first and third quartiles were 219.5 grams
and 364.0 grams respectively.
   The mean Guinea Fowl weights were smaller than the
median weights which gave an indication of majority of the
weights being to the right of the mean value. This was
attributed to the continuous increase in weights by the
Guinea Fowls over time as confirmed by a higher 3`0
Quartile compared to the 1a Quartile of the Guinea Fowl
Weights.

          Table 1. Guinea Fowl Weights Descriptive Statistics.

Min        bcd Q          Med           Mean         efg Q       Max
108.0      219.5          295.0         286.6        364.0       439.0

4.2.2. Stationarity Test
   In order to identify the presence of stationarity in the
Guinea Fowl production data, the time plot and the
Dickey-Fuller test were used. Table 2 gave the Dickey-Fuller                     Figure 1. ACF and PACF of the Guinea Fowl Weights.
test.
                                                                         4.3. ARIMA Modeling
                Table 2. Dickey-Fuller Test for Stationarity.
                                                                            Since the study proved the Guinea Fowls Production data
Dickey-Fuller             Lag-Order                  P-Value
                                                                         to be a non-stationanary series that becomes stationary after
-4.1521                   4                          0.01
                                                                         first difference, the ARIMA models were fit to the data. On
                                                                         fitting the ARIMA model to the data, the following feasible
   The Dickey-Fuller p-value was small at a -4.1524 test
                                                                         tentative models were compared; ARIMA (0, 1, 1), ARIMA
statistic and an additional lag of 4. This gave an indication of
                                                                         (1, 1, 1), ARIMA (0, 1, 2), ARIMA (1, 1, 0), ARIMA (1, 1, 2)
the presence of stationarity in the data after a first difference
                                                                         and ARIMA (0, 1, 0). Table 3 gave the fitted ARIMA models
thus ascertained the fitting of the integrated time series
                                                                         to the Guinea Fowl Weights data and their corresponding
models to the data.
                                                                         AIC/BIC.
4.2.3. Test for Correlation                                                 The ARIMA (1, 1, 1) had the lowest AIC/BIC values
   The auto-correlation and partial auto-correlation functions           followed by ARIMA (0, 1, 2), ARIMA (1, 1, 2), ARIMA (0, 1,
of the Guinea Fowl Weights Data were given as in Figure 1.               1), ARIMA (1, 1, 0) and lastly the ARIMA (0, 1, 0) had the
The auto-correlation function was used to show how                       highest AIC/BIC values. This made the ARIMA (1, 1, 1) best
correlated weights are with each other based on how many                 model for modeling Guinea Fowl Production data since it
steps they were separated by.                                            had the lowest AIC and BIC values of 763.6626 and
   For the Guinea Fowl production data, the auto-correlation             770.2211 respectively.
functions (ACFs) crossed the blue dashed line which gave an
                                                                                     Table 3. AIC & BIC of Fitted ARIMA Models.
indication of the presence of correlation among the Guinea
Fowl Weights. The ACFs had a slow exponential decay                      ARIMA MODEL           BIC                     AIC
which was evident as their magnitude became smaller with                 ARIMA (0, 1, 1)       770.2686                765.8296
                                                                         ARIMA (1, 1, 1)       770.2211                763.6626
increase in the time lag giving a further indication of the
                                                                         ARIMA (0, 1, 2)       770.0949                764.2363
presence of non-stationarity in the data.                                ARIMA (1, 1, 0)       777.3611                772.9221
   The partial auto-correlation functions (PACFs) were                   ARIMA (1, 1, 2)       769.5397                765.6616
used to show the degree of association between the Guinea                ARIMA (0, 1, 0)       782.0691                779.8496
Fowl weights and time while adjusting the effect of the
poultry feeds. From Figure 1, the PACFs showed a                            Table 4 gave the parameter estimation of the ARIMA (1, 1,
specific pattern which did not repeat thus a conclusion of               1) model of order one with its corresponding coefficients and
the absence of seasonality in the data. This suggested that              standard error. The auto-regressive component of the model
ARIMA and ARFIMA models would be appropriate for                         was estimated at 0.2940 with a standard error of 0.1393 while
the series.                                                              the moving average component of the model was estimated
                                                                         at -0.8701 with a standard error of 0.0636. The variation in
                                                                         the fitted model was estimated at 4188 with a log-likelihood
                                                                         of -379.9. This were the parameter estimates of the model
                                                                         with the smallest AIC after the first difference.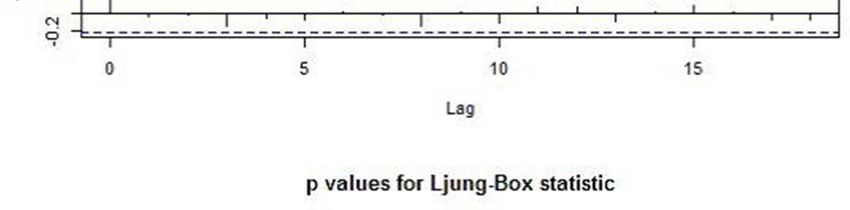
International Journal of Data Science and Analysis 2021; 7(1): 1-7 5
Table 4. Fitted ARIMA Model Coefficients. was adequate and good in the modeling of Guinea Fowl
AR (1) MA (1) Production Time Series data.
Coefficient 0.2940 -0.8701
Std Error 0.1393 0.0636
4.4. ARFIMA Modeling
In order to model the long-memory component of the
Guinea Fowl Production Time Series, the ARFIMA models
were fit to the data. Since this series becomes stationary after
the first difference, the ARFIMA (1, 1, 1) model was fit to
the data and its model coefficients given as in Table 5.
Table 5. Fitted ARFIMA Model Coefficients.
Estimate Std. Error Z-Value Pr(>|z|)
Phi 0.9993 6.33h 10%j 1.58 h 10n 2.22 h 10% n
Theta 0.9186 7.81 h 10%B 11.7670 2.22 h 10% n
H 0.7223 0.1353 5.3396 9.31 h 10%q
Set. Mean 1000 NA NA NA
The moving average component of the model was
estimated at 0.9993 while that of the auto-regressive
component was estimated at 0.9186. The Hurst-Exponent
was estimated at 0.7223 which gave an indication of the
presence of the long-memory property in the data thus Figure 2. Guinea Fowl Weights Diagnostic Plot.
necessitating the need of fitting the ARFIMA models to the
data. The set mean of the Guinea Fowls weights was at 1000 Figure 3 gave a histogram of the fitted model residuals
grams. which gave an indication of the residuals being normally
distributed. The normality distribution of the fitted model
4.5. Fitted Model Diagnostics
residuals also gave an indication of a better fit of the ARIMA
In order to check on the goodness of fit of the fitted (1, 1, 1) in the modeling of Guinea Fowl Weight Production
ARIMA (0, 1, 1) model in the modeling of Guinea Fowls Data.
Weights data, the fitted model residuals were analyzed. The
standardized residuals, ACF of residuals and the Ljung Box
P-Values were used to aid in the model residual analyses.
To test for auto-correlations in the residuals, Table 6 gave a
summary of the Ljung Statistic. The Ljung Statistic p-value
was more than 0.5 which gave an indication of the absence of
auto-correlations in the residuals. The residuals were thus not
distinguishable from a white noise series hence the notion
that the ARIMA (1, 1, 1) fitted the Guinea Fowl Weights data
well.
Table 6. The Ljung Statistic.
X-Squared Df P-Value
0.090744 1 0.7632
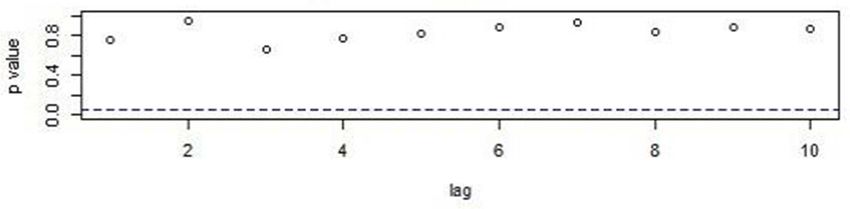
Figure 2 gave the fitted model diagnostic plots for residual
ACF and PACF of the fitted ARIMA (1, 1, 1) model. The
model verification was concerned with checking the residuals
of the fitted model to see if they contained any systematic
pattern which still could be removed to improve the chosen
ARIMA. This has been done through examining the Figure 3. Histogram of Residuals.
autocorrelation and partial auto-correlation of the residuals.
Figures 2 and 3 graphs gave an indication that the fitted
The plots showed that there were no serial correlation
model captured the data well (it accounted for all the
observed in the residuals of the series and were within the
available information) and therefore can be used to predict
tolerance line in the p-value plot with a mean close to zero.
future Guinea Fowl Weights.
The ACF of the residuals do not exceed a significant bound
from lag 1 to the end thus the indication that the fitted model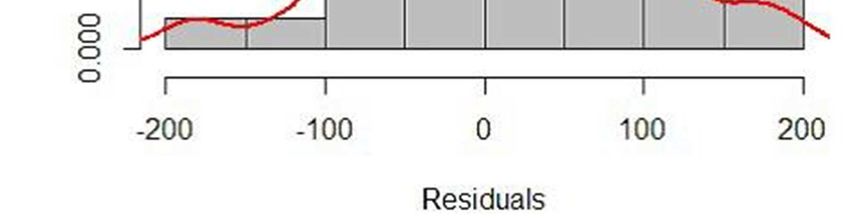
6 Cecilia Mbithe Titus et al.: Time Series Modeling of Guinea Fowls Production in Kenya
Using the ARIMA and ARFIMA Models
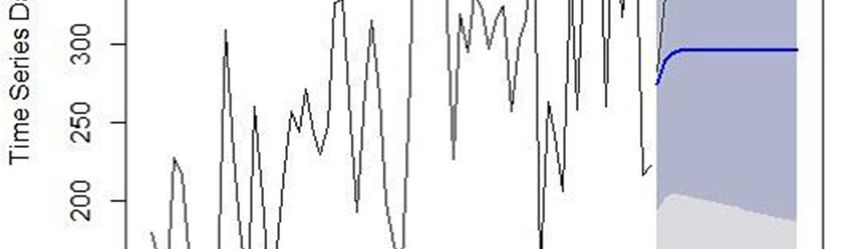
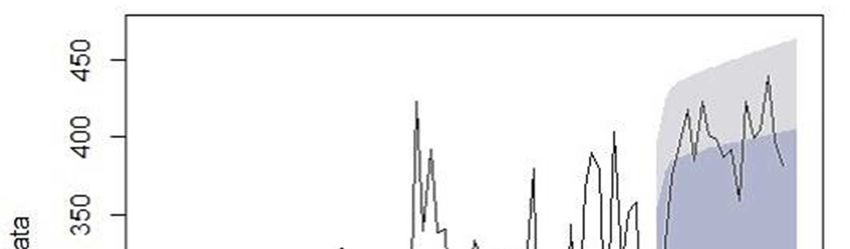
4.6. Guinea Fowls Weight Forecasting In order to identify a more parsimonious model between
the two fitted models, we finally compare the forecast values
The fitted ARIMA (1, 1, 1) and ARFIMA (1, 1, 1) were of ARFIMA (1, 1, 1) and ARIMA (1, 1, 1) with the observed
used to forecast future Guinea Fowl Weights over time. values. To evaluate their performance, the Root Mean
Figures 4 and 5 gave a visualization of the Guinea Fowl Squared Error (RMSE) was used. The ARIMA model had an
Weight Forecast for the fitted models. The training range data RMSE of 0.6268 while the ARFIMA model had an RMSE of
was used to do model forecasting. The model forecast was at 0.4868. From this results the RMSE value of ARFIMA was
the beginning of the forecast range and is given by the smaller than the RMSE value of ARIMA model thus the
straight line. The confidence intervals for the training range conclusion that ARFIMA model is a much better model than
data and the model forecast are also provided. the ARIMA model in the modeling of Guinea Fowl
production data.
5. Conclusions and Recommendations
5.1. Introduction
This is the final chapter of the study and it gives the
conclusion and recommendations of the study with regard to
the modeling of Guinea Fowls Weights Production data.
5.2. Conclusion
In the modeling of Guinea Fowl Production data, the study
gave an application of the integrated ARIMA and ARFIMA
models in which both models fitted the data perfectly well.
Even though both models gave a better fit to the data,
forecasts obtained using the ARFIMA model were closer to
the actual values than forecasts obtained using ARIMA
Figure 4. ARIMA Guinea Fowl Weights Forecasted Plot.
model as evidenced by the Root Mean Squared Error
(RMSE). The ARFIMA model had a lower RMSE which
showed that it gave better forecasts than the ARIMA model.
This gave the conclusion that in the modeling of Guinea
Fowls Weights over time, the ARFIMA model is a better
model than the ARIMA model.
This is as with Sankar [1] and Shakeel et al [9] who
stipulated the need for a time series analysis of poultry
production so as to capture historical traits that influence the
production of poultry products. On the need to capture the
long memory property of a time series, Raji et al [10],
Semara et al [13] and Ahmad [12] recommended the use of a
long process to model the same which gave a motivation for
the study. This in turn helped model the long-term
correlations of the poultry production data using the
Auto-Regressive Fractional Integrated Moving Average
models.
In conclusion, Guinea Fowl production weights have a
positive increase over time. Hence, little more effort would
be required by poultry farmers in order to meet up with
increasing demand for the products due to increase in
Figure 5. ARFIMA Guinea Fowl Weights Forecasted Plot. population. Moreover, the Autoregressive Integrated Moving
Average (ARIMA AND ARFIMA) time series models are
The fitted model forecasts were estimated at 95% effective tools in examining Guinea Fowl production weights
confidence intervals. Since the constant c was not equal to 0 and should be employed at regular intervals to monitor the
and d was equal to 1, the long term forecast followed a production rate.
straight line as in Figures 4 and 5. From the model forecasts,
the prediction intervals increased in size within the forecast 5.3. Recommendations
horizon. Forecast calculations assumed that the residuals are
This study gave an application of modeling Guinea
uncorrelated and normally distributed.
Fowl Weights using the Integrated and the Fractionally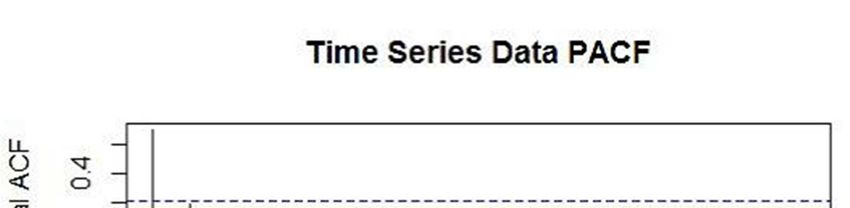
International Journal of Data Science and Analysis 2021; 7(1): 1-7                                   7

Integrated Time Series models in the modeling of Guinea                 [6]   Nosike, R. J., Okoro, V. M. O. & Ukwu, H. O. (2016).
Fowl Production data. The study further acknowledges                          Statistical Modelling of Body Weight and Linear Body
                                                                              Measurements in Nigerian Indigenous Chicken. Journal of
the need to expound on this work by future researching                        Agriculture and Veterinary Science, 7 (1); 27-30.
on the multivariate modeling of the long-memory models
for simulated data and incorporating their Bayesian                     [7]   Abiyu, T. (2019). Statistical Modelling of Indigenous Chicken
estimates.                                                                    with Body Weight and Linear Body Measurements in Bench
                                                                              Maji Zone, South Western Ethiopia. International Journal of
                                                                              Environmental Sciences and Natural Resources, 22 (2). doi:
Acknowledgements                                                              10.19080/IJESNR.2019.22.556083.

   I thank God for giving me the perseverance and endurance             [8]   Luis, G. V., Mario, C. M., Daniel, R. & Jose, M. C. (2013).
                                                                              Using the distributed-delay model to predict egg production in
to go through my research project. I would like to                            laying hens. Rev Colomb Cienc Pecu, 2013 (26); 270-279.
acknowledge with gratitude, my supervisors, Dr. Thomas
Mageto and Dr. Anthony Wanjoya. Thank you so much for                   [9]   Shakeel, N. & Masood, A. K. (2014). Modeling and
putting up with me during this process, reading my many                       Forecasting of Beef, Mutton, Poultry Meat and Total Meat
                                                                              Production of Pakistan for Year 2020 by using Time Series
drafts and still encouraging me up to this far. Special thanks                ARIMA Models. European Scientific Journal, 3 (special
to my fellow colleagues, Evan Kithure and Lucy Pembe for                      issue).
fueling my writing and being generous with some points in
my study. I extend my deepest and warmest appreciation to               [10] Raji, A. O., Alade, N. K. & Duwa, H. (2014). Estimation of
                                                                             Model Parameters of the Japanese Quail Growth Curve using
my husband, Nick and children, Sackey and Gideon for their                   Gompertz Model. Arch. Zootec. 63 (243); 429-435.
encouragement to complete my study.
                                                                        [11] Isife, J. K., Ukwani, C. & Sani, G. (2019). Design and
                                                                             Simulation of an Automated Poultry Feed Mixing Machine
                                                                             Using Process Controller. Global Scientific Journals, 7 (1);
References                                                                   537-602.
[1]   Sankar, T. J. (2014). Design of a Stochastic Forecasting Model    [12] Ahmad, H. A. (2019). Poultry Growth Modeling using Neural
      for Egg Production. International Journal of Innovative                Networks and Simulated data. Journal of Applied Poultry
      Science, Engineering & Technology, S1 (6).                             Research, 18; 440-446. doi: 10.3382/japr.2008- 00064.
[2]   GALE, F. & Arnade, C. (2015). Effects of Rising Feed and          [13] Semara, L., Mouffok, C. & Belkasmi, F. (2019). Comparison
      Labor Costs on China’s Chicken Price. International Food and           of some Non-Linear Functions for Describing Broiler Growth
      Agribusiness Management Review, 18 (A).                                Curves of Cobb500 Strain. Poultry Science Journal, 7 (1);
                                                                             51-61. doi: 10.22069/psj.2019.15965.1386.
[3]   Ahmad, H. A. (2012). Egg production forecasting:
      Determining efficient modeling approaches. Journal of             [14] Abdul, S. M., Bonsu, F. R. K., Abunyuwah, I. & Serekye, A. Y.
      Applied Poultry and Research, 20 (4); 463–473. doi:                    (2020). Relative Economic Value Estimates of Guinea Fowls
      10.3382/japr.2010-00266.                                               (Numida meleagris) Production Traits. World Journal of
                                                                             Advanced Research and Reviews, 7 (1); 273-281. doi:
[4]   Hanus, A., Hanusoval, E., Oravcova, M. & Hrncar, C. (2017).            10.30574/wjarr.2020.7.1.0265.
      Factors affecting growth in Oravka chicken breed. Slovak J.
      Anim. Sci., 50 (3); 112–117.                                      [15] Dzungwe, J. T., Gwaza, D. S. & Egahi, J. O. (2018). Statistical
                                                                             Modeling of Body Weight and Body Linear Measurements of
[5]   Yakubu, A., Oluremi, O. A. & Ibrahim, Z. N. (2018).                    the French Broiler Guinea Fowl in the Humid Tropics of
      Modelling egg production in Sasso dual-purpose birds using             Nigeria. Poultry, Fisheries and Wildlife Sciences, 6 (2); 1-4.
      linear, quadratic, artificial neural network and classification        doi: 10.4172/2375-446X. 1000197.
      regression tree methods in the tropics. Livestock Research for
      Rural Development 30 (10).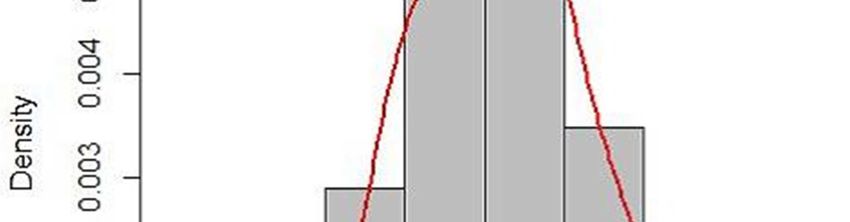
You can also read