Secondary Care National Therapeutic Indicators 2018/19 - Effective ...
←
→
Page content transcription
If your browser does not render page correctly, please read the page content below
Secondary Care National Therapeutic
        Indicators 2018/19

                                 1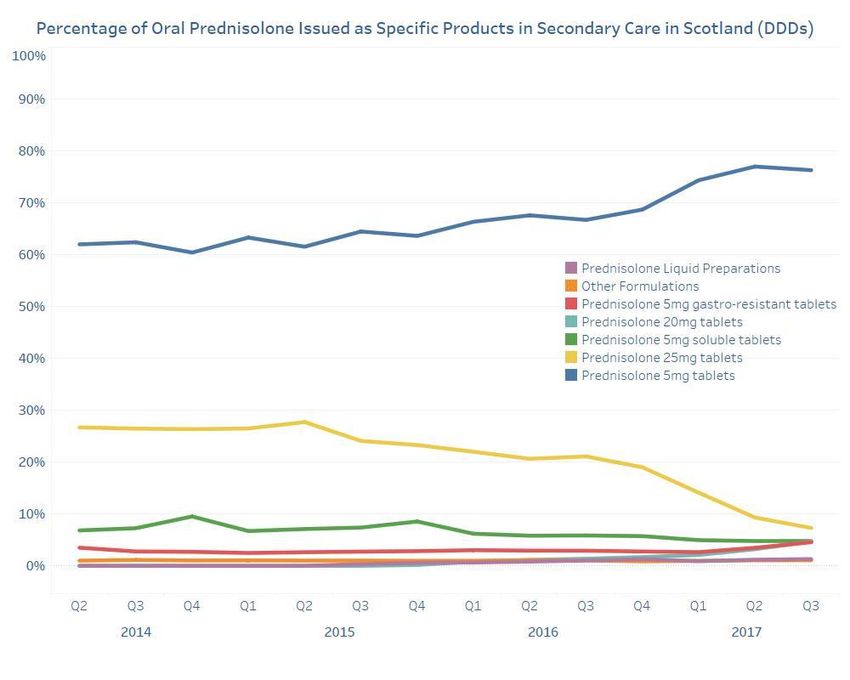
Foreword

The use of prescription data to improve the quality, safety and efficiency of prescribing is
well established in NHS Scotland. National Therapeutic Indicators (NTIs) were first
introduced in 2012 using the Prescription Information System (PRISMS), a record of all
claimed dispensing by community pharmacies. These NTIs are associated with demonstrable
success in patient safety and medicines management. The Hospital Medicines Utilisation
Database (HMUD) is a national dataset of medicines supplied within Secondary Care. We are
pleased to present this first set of Secondary Care NTIs.

These indicators use prescribing data to provide a measure of activity in specified
therapeutic areas, and a comparison across hospitals and Boards in Scotland: they are made
available to Boards and clinicians for use in quality improvement initiatives. They are
consistent with a number of national strategic aims, including those of Realistic Medicine
and the Scottish Antimicrobial Prescribing Group. The delivery of this data complements
that already available for Primary Care, and provides Boards with further opportunities to
improve in both sectors as well as facilitating work on the primary/secondary care interface.

These first indicators will be added to over the coming year, in collaboration with a range of
groups and individuals, and in particular with the National Acute Pharmacy Services Group.
We will aim to broaden the range of indicators available in secondary care. As use of these
indicators becomes established, they will be incorporated into a truly national set of
indicators which includes indicators for both primary and secondary care, and encourages
the development of indicators that are relevant to all parts of the NHS in Scotland.

Funding has been provided to Boards to support the implementation of Hospital Electronic
Prescribing and Medicines Administration (HEPMA). When fully implemented, HEPMA will
greatly increase the richness of prescribing data in secondary care, giving a better and more
precise understanding of medicines use in different disease states and the potential to be
linked with patient outcomes. A considerable amount of work will be required to deliver
this, but NHS National Services Scotland are already engaging with Boards using HEPMA and
other stakeholders to explore how this can best be achieved.

Best Wishes

David Pfleger                                   Simon Hurding
Director of Pharmacy, NHS Grampian              Clinical Lead, Therapeutics Branch

                                                                                             2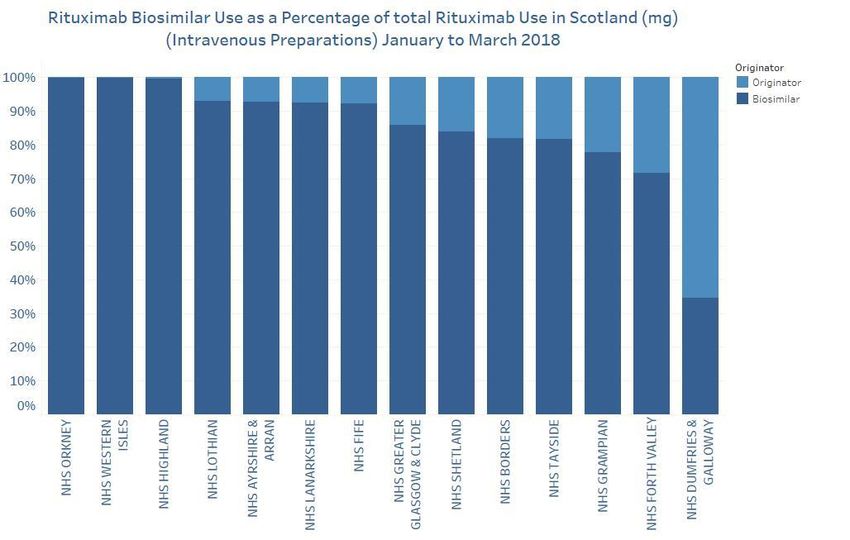
Key Contributors

The following have contributed to the development of this report:
Lead Author: Alban Clareburt, Lead Clinician, Hospital Medicines Utilisation Database
(HMUD), NHS National Services Scotland

Scott Garden, Chief Pharmacist, NHS Fife Acute Services Division: Chair National Acute
Pharmacy Services Group
Melinda Cuthbert, Associate Director of Pharmacy, NHS Lothian
Janice Watt, Lead Pharmacist Acute Services, NHS Greater Glasgow and Clyde
Alpana Mair, Head of Effective Prescribing and Therapeutics, Scottish Government
Simon Hurding, Clinical Lead, Therapeutics Branch, Scottish Government
Sean MacBride-Stewart, Lead for Medicines Management Resources, NHS Greater Glasgow
and Clyde
Marion Bennie, Chief Pharmacist, Public Health and Intelligence, National Services Scotland
Jason Cormack, Programme Lead, Therapeutics Branch, Scottish Government
Graeme Bryson, Lead Pharmacist (South Sector), NHS Greater Glasgow and Clyde
Heather Harrison, Senior Prescribing Advisor, NHS Greater Glasgow and Clyde
Brian Kennon, National Lead for Diabetes, NHS Greater Glasgow and Clyde
Miles Fisher, Consultant Physician, NHS Greater Glasgow and Clyde
Jill Nowell, Head of the Prescribing Support Unit, NHS Tayside
Susan Arnott, GP/ Lead Clinician Diabetes MCN, NHS Lanarkshire

With thanks to:
Colin Daly, Senior Information Analyst, NHS National Services Scotland
Ross Murdoch, Information Analyst, NHS National Services Scotland
Gavin MacColl, Principal Information Analyst, NHS National Services Scotland
Barry Melia, Senior Pharmacist, NHS National Services Scotland
Stuart McTaggart, Principal Pharmacist, NHS National Services Scotland
Graeme Paulley, Information Analyst, NHS National Services Scotland
NHS Scotland National Acute Pharmacy Services Group
NHS Scotland Directors of Pharmacy Group
Charles Flach, William Urquhart and the SCI Diabetes team
William Malcolm and the Scottish Antimicrobial Prescribing Group
Laura McIver and Effective Prescribing Programme Biologics Subgroup

                                                                                              3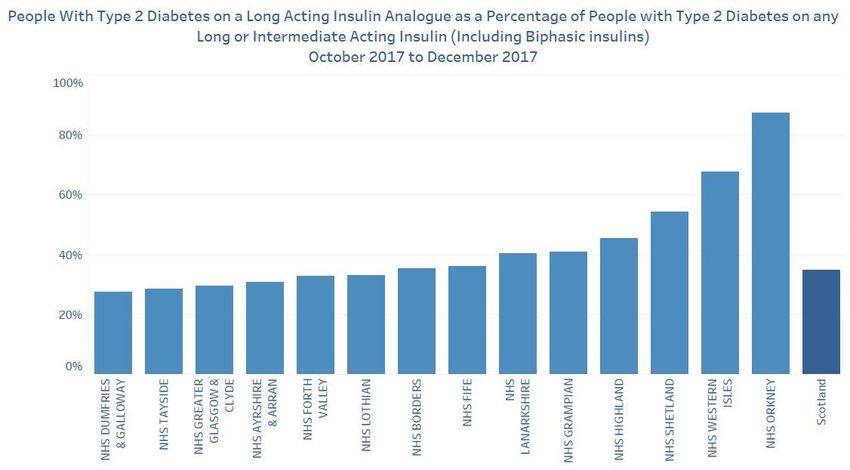
Contents
Foreword .................................................................................................................................... 2
Introduction ............................................................................................................................... 5
Biosimilars .................................................................................................................................. 7
   Background and evidence ...................................................................................................... 7
   Cost and savings ..................................................................................................................... 8
   Data - Infliximab ..................................................................................................................... 9
   Data - Etanercept ................................................................................................................. 10
   Data - Rituximab .................................................................................................................. 11
Antibiotics ................................................................................................................................ 12
   Data - Total antibiotic use in acute hospitals....................................................................... 13
   Data - Carbapenem .............................................................................................................. 14
   Data - Piperacillin with Tazobactam .................................................................................... 15
Insulin ....................................................................................................................................... 15
   Background and evidence .................................................................................................... 16
   Cost and savings ................................................................................................................... 16
   Data - Insulin ........................................................................................................................ 17
Prednisolone ............................................................................................................................ 18
   Background and evidence .................................................................................................... 18
   Cost and savings ................................................................................................................... 19
   Data - Prednisolone ............................................................................................................. 20

                                                                                                                                                4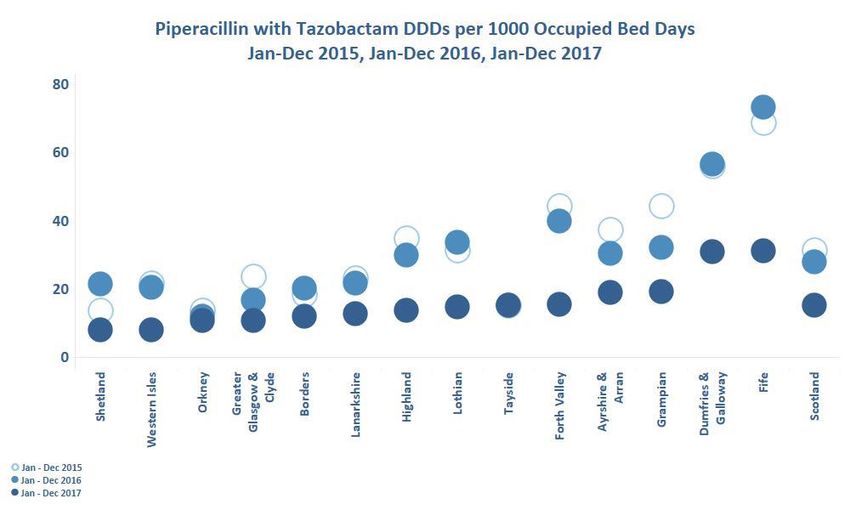
Introduction
In April 2012 the first set of National Therapeutic Indicators (NTIs) were introduced,
identifying areas of variation where there was an opportunity to improve the quality of
prescribing in primary care. NTIs and Additional Prescribing Measures (APMs) use
prescription dispensing information to provide a measure of prescribing activity in specified
therapeutic areas, and a comparison across Boards and GP practices within the Boards.
This is the first attempt to publish secondary care indicators for Scotland. This use of
secondary care medicines utilisation data to assess variation in the use of medicines
between hospitals is a recent innovation; these indicators should be regarded as early
developmental work.
With the increased robustness and reporting capabilities of the Hospital Medicines
Utilisation Database (HMUD), there is an opportunity for use of this data in secondary care
to support and drive improvements in the quality of prescribing in this sector. HMUD
provides measures of medicines supply (cost, quantity and DDDs)1 at a hospital level, and
allows comparison between hospitals and Boards across Scotland.
Additionally, there is potential to combine information from primary and secondary care
datasets, to create whole system reports that can be used to provide intelligence relating to
both primary and secondary care. NHS staff can access utilisation data relevant to their
position by applying via the user access system.
There are three broad methods in which current data may be used to assess secondary care
medicines use:
Secondary care data may be extracted from HMUD to provide a Board level
comparison of medicines utilisation across Scotland.
Primary care data may be used to determine if there is significant variation in the use
of medicines that are strongly influenced by secondary care activity.
Primary and secondary care utilisation data may be combined to report on the total
use of medicines.
These early hospital indicators are based on work developed by the All Wales Medicines
Strategy Group, which first published secondary care prescribing indicators for Wales in
2016. Ideas have also been incorporated from the Hospital Pharmacy and Medicines
Optimisation Project in England. Previous NTIs and APMs, the interim report of Lord Carter
of Coles, and the HMUD development project have also influenced this report.
1
DDDs – defined daily doses have been developed by the WHO to account for the strength and quantity of
each medicinal product supplied to allow direct comparison between organisations/countries
(https://www.whocc.no/ddd)
5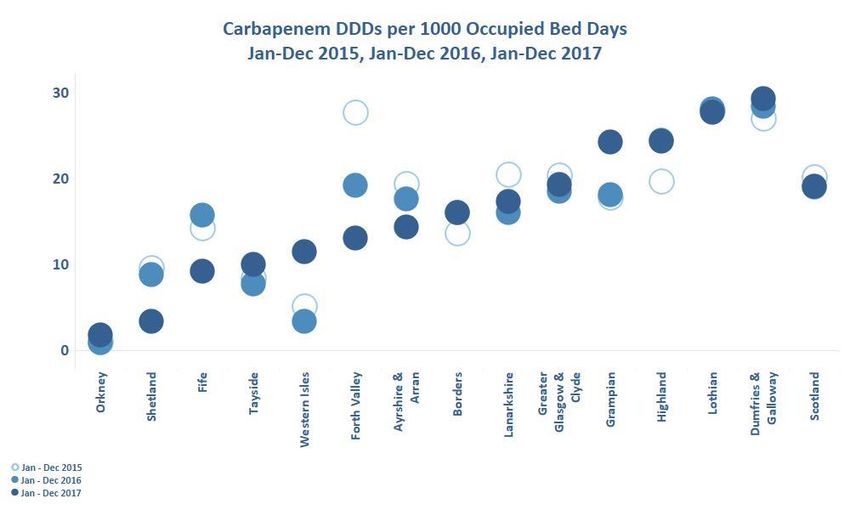
The following indicators are recommended by the National Acute Pharmacy Services Group and
the Therapeutics Branch:
1. Biosimilars
      A. Biosimilar infliximab as a proportion of total infliximab use
      B. Biosimilar etanercept 50mg as proportion of all etanercept 50mg use
      C. Biosimilar rituximab as a proportion of all rituximab use (excludes subcutaneous
          preparations)

2. Antibiotics
      A. Total antibiotic use (DDDs) per 1000 occupied bed days
      B. Carbapenem use (DDDs) per 1000 occupied bed days
      C. Piperacillin / and tazobactam use (DDDs) per 1000 occupied bed days

3. Insulin
       A. Long-acting insulin analogues expressed as a percentage of all long acting insulin
           prescribed

4. Corticosteroids
      A. Prednisolone 5mg plain tablets as a proportion of all prednisolone oral
          preparations

                                                                                             6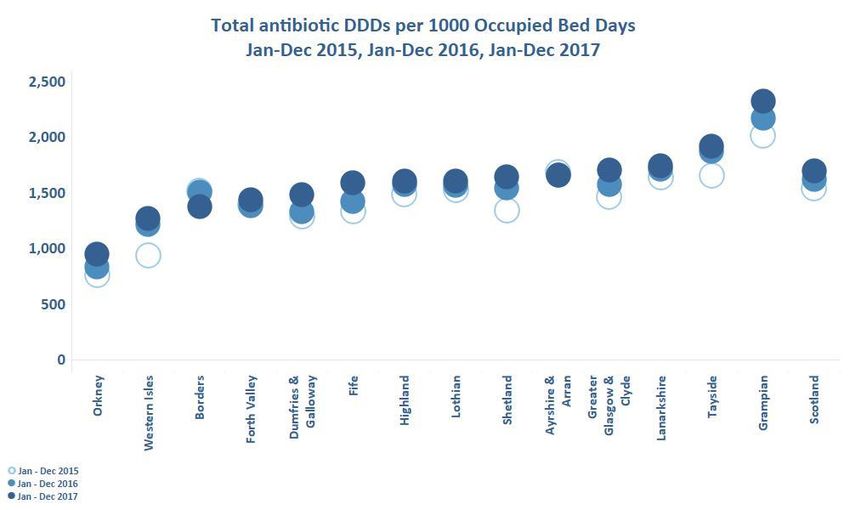
Biosimilars

Background and evidence

Biological medicines are medicines that are made by, or derived from, a biological source,
such as a bacterium, yeast or blood. They can consist of relatively simple molecules, such as
human insulin or erythropoietin, or complex molecules such as monoclonal antibodies.

A biosimilar medicine is a biological medicine that is similar to another biological medicine
which has already been made available. The exact structure of biosimilar medicines will vary
depending on the manufacturing process. This is true for modifications to the
manufacturing process of originator products, as it is for the development of biosimilar
medicines. As biosimilar medicines are not the same molecule as the originator product, the
standard approach to licensing of a generic medicine, where the medicine must
demonstrate bioequivalence (that is the amount of the generic medicine that enters the
systemic circulation must not differ significantly when given at the same dosage under
similar conditions), is not sufficient for biosimilar medicines. For licensing in the European
Union, the manufacturer of the biosimilar medicine must demonstrate that the medicine is
similar to the original reference product, and does not have any meaningful differences
from the original reference product in terms of quality, safety or efficacy.i

The continuing development of biological medicines, including biosimilar medicines, creates
increased choice for patients and clinicians, increased commercial competition and
decreases the cost of treatment. Biological medicines account for a significant expenditure
within the NHS (approximately £174 million was spent on biological agents in NHS Scotland
in 2016/2017).ii A number of these medicines have lost or will lose their patent protection
within the coming years.

The Scottish Medicines Consortium has stated that the managed introduction of biosimilar
medicines into clinical practice in NHS Scotland is desirable.iii Two inhibitors of tumour
necrosis factor alpha (infliximab and etanercept) are now available as biosimilar
preparations, and a biosimilar of the anti-lymphocyte monoclonal antibody rituximab was
introduced in the first half of 2017.

                                                                                             7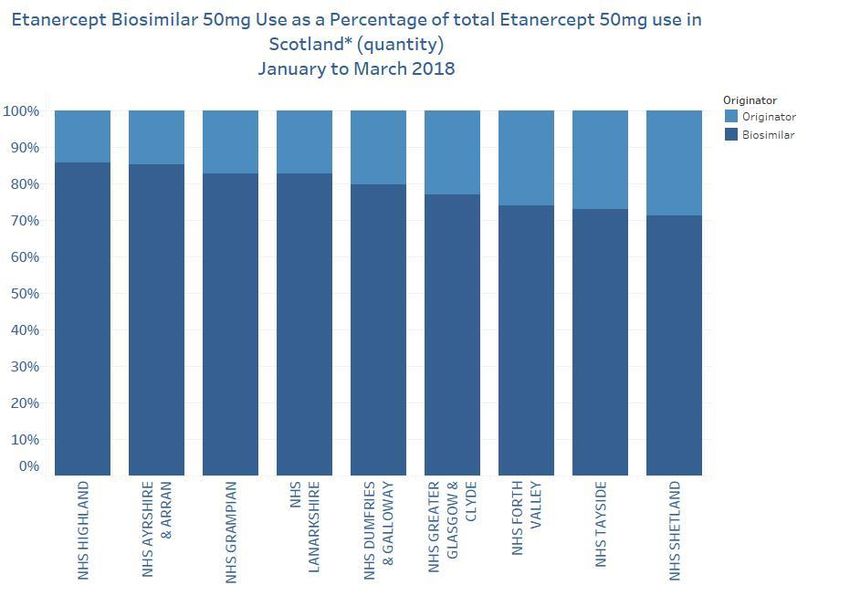
Cost and savings

The total spend across Scotland in the 2016/17 financial year was over £10 million for
infliximab and over £14 million for etanercept. In January 2017, 84.5% of all infliximab was
issued as a biosimilar product. By December 2017 this figure had increased to over 94%. In
2017, expenditure of £4.6 million was avoided by the use of biosimilar infliximab (figure 1).

In January 2017, 44% of all etanercept 50mg was issued as the biosimilar product. By
December 2017, over 84% of etanercept 50mg used in Scotland were biosimilar
preparations. In the 12 months to December 2017, a cost of £2.25 million was avoided by
the use of biosimilar etanercept (figure 2).

In March 2017 biosimilar rituximab became available to the NHS. Rituximab exists as
intravenous and subcutaneous formulations, although due to a licence extension for the
subcutaneous product, biosimilar rituximab is only currently available in the intravenous
formulation. In the 2016/17 financial year almost £14 million was spent on rituximab in NHS
Scotland, of which almost £11 million was on the intravenous preparation. The percentage
of intravenous rituximab issued as biosimilar preparations has risen from 0.5% in April 2017
to 74% by December 2017. Over this period expenditure of over £0.8 million was avoided by
the use of biosimilar rituximab (figure 3).

The use of biosimilar medicines in place of the reference biological medicine is associated
with considerable cost savings. The appropriate use of biosimilars will drive greater
competition and release cost efficiencies to support the treatment of an increasing number
of patients and increase the uptake of new and innovative medicines.2

2
 As Boards are actively working to improve biosimilar use, the percentage of medicines supplied as biosimilars is rapidly
changing. To address this, the biosimilar reports in this document use the most recent three months in HMUD (January to
March 2018). Other reports in this document are for the calendar year 2017

                                                                                                                            8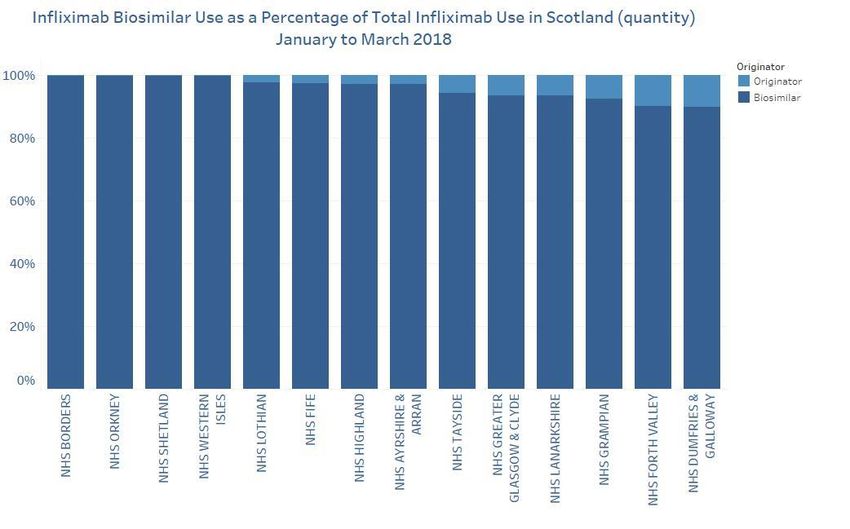
Data - Infliximab

Figure 1: Infliximab

Quantity (number of vials) of 100mg infliximab mapped as biosimilar products (Inflectra® or Remsima®) as a
percentage of the total number of infliximab 100mg vials. Infliximab is only available as one formulation
(100mg vials). Data source: HMUD

Table 1: Infliximab
 Health Board Name                                  Quantity         Biosimilar       Percentage
                                                    Originator       Quantity          issued as
                                                                                       Biosimilar
 NHS AYRSHIRE & ARRAN                                    14              492              97%
 NHS BORDERS                                              0              113              100%
 NHS DUMFRIES & GALLOWAY                                 33              297              90%
 NHS FIFE                                                12              447              97%
 NHS FORTH VALLEY                                        75              685              90%
 NHS GRAMPIAN                                            81              993              92%
 NHS GREATER GLASGOW & CLYDE                            312             4608              94%
 NHS HIGHLAND                                            33             1179              97%
 NHS LANARKSHIRE                                         65              926              93%
 NHS LOTHIAN                                             67             2941              98%
 NHS ORKNEY                                               0                6              100%
 NHS SHETLAND                                             0               46              100%
 NHS TAYSIDE                                             56              924              94%
 NHS WESTERN ISLES                                        0                8              100%
 Scotland                                               748             13663             95%

Boards can view their own potential savings by viewing the HMUD Biosimilar Infliximab report

                                                                                                             9
Data - Etanercept
Figure 2: Etanercept 50mg
Quantity (number of syringes or pens) of 50mg etanercept mapped as biosimilar product (Benepali®) as a
percentage of the total quantity of etanercept issued. Data source: HMUD
*Some Boards do not capture homecare issues in their HMUD monthly data submissions. As etanercept is
almost exclusively issued via homecare this report is unable to assess etanercept use in the following Boards:
NHS Borders; NHS Lothian; NHS Western Isles; NHS Fife; NHS Orkney.
Table 2: Etanercept 50mg
Health Board Name Quantity Biosimilar Percentage
Originator Quantity issued as
Biosimilar
NHS AYRSHIRE & ARRAN 452 2597 85%
NHS BORDERS no data no data no data
NHS DUMFRIES & GALLOWAY 188 740 80%
NHS FIFE no data no data no data
NHS FORTH VALLEY 452 1288 74%
NHS GRAMPIAN 800 3861 83%
NHS GREATER GLASGOW & CLYDE 1858 6225 77%
NHS HIGHLAND 328 1980 86%
NHS LANARKSHIRE 816 3896 83%
NHS LOTHIAN no data no data no data
NHS ORKNEY no data no data no data
NHS SHETLAND 112 276 71%
NHS TAYSIDE 832 2248 73%
NHS WESTERN ISLES no data no data no data
Scotland 5838 23111 80%
Boards can view their own potential savings by viewing the HMUD Biosimilar Etanercept report 3
3
HMUD users will need to be logged in to follow this link
10Data - Rituximab
Figure 3: Intravenous Rituximab
Quantity (number of milligrams) of intravenous rituximab mapped as biosimilar product (Truxima®) as a
percentage of the total quantity of intravenous rituximab. Data source: HMUD
Table 3: Intravenous Rituximab
Health Board Name Quantity Quantity Percentage
Originator Biosimilar issued as
Biosimilar
NHS AYRSHIRE & ARRAN 6000 75400 93%
NHS BORDERS 9600 43900 82%
NHS DUMFRIES & GALLOWAY 39900 21000 34%
NHS FIFE 5500 64900 92%
NHS FORTH VALLEY 14200 35700 72%
NHS GRAMPIAN 59301 206000 78%
NHS GREATER GLASGOW & CLYDE 40900 249900 86%
NHS HIGHLAND 300 63700 100%
NHS LANARKSHIRE 11600 144400 93%
NHS LOTHIAN 12000 157600 93%
NHS ORKNEY 0 7900 100%
NHS SHETLAND 1200 6300 84%
NHS TAYSIDE 12500 55500 82%
NHS WESTERN ISLES 0 9000 100%
Scotland 213001 1141200 84%
Boards can view their own potential savings by viewing the HMUD Biosimilar Rituximab report 4
4
HMUD users will need to be logged in to follow this link
11Antibiotics
After consultation with Scottish Government, the Scottish Antimicrobial Prescribing Group
has agreed three national hospital antibiotic prescribing quality indicators. These indicators
are intended to support reduction in unnecessary hospital antibiotic use (including very
broad spectrum antibiotic use). The indicators and associated targets are for acute hospitals
to achieve ≥1% reduction in total antibiotic use expressed as DDDs per 1,000 occupied bed
days (OBDs) (figure 4) and ≥1% reductions in piperacillin-tazobactam (figure 5) and
carbapenem (figure 6) use (DDDs/1,000 OBDs) from the baseline of January to December
2015.
Carbapenems and piperacillin-tazobactam are very broad spectrum antibiotics. These are
given as injections or infusion and are only available in hospitals. They are reserved for the
most unwell patients, or patients with infections that cannot be treated with any other
antibiotics. The development of resistance to these agents is concerning as there are very
few other antibiotics that are likely to be effective. It is hoped that by limiting the use of
these very broad spectrum antibiotics the development of resistance may be slowed.
These antibiotics are included on the list of alert antimicrobials for Scotland. Antimicrobials
on this list undergo special monitoring within hospitals, and are usually prescribed in
consultation with a microbiologist or specialist in infectious diseases.
Many more patients receive antimicrobial therapy in primary care settings, under the care
of their GP, than receive antimicrobials in hospital. Many patients requiring inpatient
treatment do not respond to first line antibiotic treatment, or present with very severe
infections requiring immediate and aggressive treatment with antibiotics. Consequently the
antibiotics used in hospitals tend to be more expensive than those in primary care,
particularly when intravenous treatment is needed. Although approximately 18% of all
antibiotics (number of DDDs issued in 2017) are used in secondary care, this accounts for
44% of spending on antimicrobials. This does not take into account the additional costs in
terms of staff and peripheral equipment required to administer intravenous therapy.
Reports have been set up to enable antimicrobial management teams to monitor antibiotic
use against these targets. These indicators are designed so trends in antibiotic use within
hospitals can be monitored and compared to use in 2015 and to their target.
During the course of 2017, there was a significant supply problem with piperacillin-
tazobactam, resulting in notable restrictions placed on its use. This will have contributed to
the reduction in DDDs seen in the most recent period.
12Data - Total antibiotic use in acute hospitals
Figure 4: Total antibiotic use in acute hospitals
Number of DDDs issued from section 5.1 of the Legacy British National Formulary (BNF) (excluding sub-
sections 5.1.9 and 5.1.10 but including streptomycin) per 1,000 occupied bed days. Source: SAPG Antimicrobial
Use Dashboard
Table 4: Total antibiotic use in acute hospitals
Health board DDDs per 1000 Occupied Bed Days Percentage change in use:
Jan- Dec 2015 Jan- Dec 2016 Jan- Dec 2017 2017 compared with 2015
NHS Ayrshire & Arran 1689 1660 1659 -1.76%
NHS Borders 1516 1504 1378 -9.10%
NHS Dumfries & Galloway 1287 1332 1486 15.40%
NHS Fife 1335 1422 1587 18.83%
NHS Forth Valley 1393 1381 1438 3.19%
NHS Grampian 2016 2173 2323 15.23%
NHS Greater Glasgow & Clyde 1462 1574 1706 16.70%
NHS Highland 1487 1571 1602 7.76%
NHS Lanarkshire 1640 1709 1746 6.48%
NHS Lothian 1522 1568 1602 5.25%
NHS Orkney 762 835 944 23.99%
NHS Shetland 1344 1541 1647 22.55%
NHS Tayside 1658 1877 1923 15.98%
NHS Western Isles 933 1215 1267 35.81%
Scotland 1540 1618 1694 10.03%
13Data - Carbapenem
Figure 5: Carbapenem use in acute hospitals
Number of DDDS issued where drug substance is: doripenem or ertapenem or imipenem + cilastatin or
meropenem per 1,000 occupied bed days. Source: SAPG Antimicrobial Use Dashboard
Table 5: Carbapenem use in acute hospitals
Health board DDDs per 1000 Occupied Bed Days Percentage change in use:
Jan- Dec 2015 Jan- Dec 2016 Jan- Dec 2017 2017 compared with 2015
NHS Ayrshire & Arran 19 18 14 -25.84%
NHS Borders 14 16 16 17.89%
NHS Dumfries & Galloway 27 29 29 8.61%
NHS Fife 14 16 9 -35.04%
NHS Forth Valley 28 19 13 -52.86%
NHS Grampian 18 18 24 36.95%
NHS Greater Glasgow & Clyde 20 19 19 -4.99%
NHS Highland 20 25 24 24.02%
NHS Lanarkshire 20 16 17 -15.08%
NHS Lothian 28 28 28 -0.24%
NHS Orkney 1 1 2 90.12%
NHS Shetland 10 9 3 -64.53%
NHS Tayside 8 8 10 19.39%
NHS Western Isles 5 3 12 126.67%
Scotland 20 19 19 -4.88%
14Data - Piperacillin with Tazobactam
Figure 6: Piperacillin with Tazobactam use in acute hospitals
Number of DDDs issued where drug substance is: piperacillin + tazobactam per 1,000 occupied bed days.
Source: SAPG Antimicrobial Use Dashboard
Table 6: Piperacillin with tazobactam use in acute hospitals
Health board DDDs per 1000 Occupied Bed Days Percentage change in use:
Jan- Dec 2015 Jan- Dec 2016 Jan- Dec 2017 2017 compared with 2015
NHS Ayrshire & Arran 37 30 19 -48.84%
NHS Borders 18 20 12 -34.94%
NHS Dumfries & Galloway 56 57 31 -44.76%
NHS Fife 69 73 31 -54.59%
NHS Forth Valley 44 40 15 -65.05%
NHS Grampian 44 32 19 -56.60%
NHS Greater Glasgow & Clyde 24 17 11 -54.59%
NHS Highland 35 30 14 -60.78%
NHS Lanarkshire 23 22 13 -45.04%
NHS Lothian 31 34 15 -53.15%
NHS Orkney 14 12 11 -21.89%
NHS Shetland 14 21 8 -42.35%
NHS Tayside 15 15 15 0.29%
NHS Western Isles 22 20 8 -63.04%
Scotland 31 28 15 -51.64%
Insulin
15Background and evidence
The Scottish Intercollegiate Guidelines Network (SIGN) guidance on pharmacological
management of glycaemic control in people with type 2 diabetes recommends that when
oral agents no longer provide effective glucose control, injectable therapy can be
introduced. Where the body mass index is less than 30 this should be with insulin. Human
isophane insulin is recommended as the first choice regimen. Long-acting insulin analogues
should not be considered unless the patient experiences recurrent episodes of
hypoglycaemia or requires assistance with insulin injection.iv For most people with type 2
diabetes, long-acting insulin analogues offer no significant benefit over human isophane
insulin, and are more expensive. The rates of symptomatic and nocturnal hypoglycaemia are
lower for analogue insulins, but at an incremental cost per quality adjusted life year of
around £300,000.v
SIGN recommends a long-acting insulin analogue as an option for basal insulin therapy for
adults with type 1 diabetes mellitus.vi As prescribing data cannot reliably differentiate
between long-acting insulin analogues prescribed for type 1 and type 2 diabetes, SCI
Diabetes data has been use to prepare this indicator.
In 2017, over £21 million was spent on intermediate and long acting insulins in
NHSScotland.vii Of this £11 million was spent on long acting insulin analogues. The majority
of insulin prescribing is initiated by a specialist clinician within secondary care and therefore
review of hospital prescribing practice will affect the primary care prescribing trend.
Prescribing will usually continue in the primary care setting and it is therefore important to
consider data for both primary and secondary care. Further guidance can be found in
Quality Prescribing for Diabetes: A Guide for Improvement.
Cost and savings
Across Scotland 35% of people with type 2 diabetes who use either a long or intermediate
acting insulin, use a long acting insulin analogue (figure 7). If this figure could be reduced so
that just one in four (25%) of these people used a long acting insulin analogue, and replace
their insulin treatment with the most commonly used isophane insulin, it is estimated that a
cost of £580,000 per year could be avoided.
16Data - Insulin
Figure 7: Insulin
Data for this indicator was obtained from the SCI diabetes database. SCI diabetes records the diagnosis for all
patients, and this allowed analysis of just the population with type 2 diabetes. People with type 2 diabetes on
a long or intermediate acting insulin were identified if they had received a prescription in the last year.
Table 7: Insulin
Health Board Name Number of people Number and (%)
with type 2 of people with
diabetes on ANY type 2 diabetes
long or on a long or
intermediate intermediate
insulin (including acting ANALOGUE
biphasic insulins) insulin
Ayrshire & Arran 2646 814 (31)
Borders 868 306 (35)
Dumfries & Galloway 1100 303 (28)
Fife 2596 936 (36)
Forth Valley 1654 541 (33)
Grampian 2902 1187 (41)
Greater Glasgow and Clyde 5937 1753 (30)
Highland 2164 984 (45)
Lanarkshire 3722 1504 (40)
Lothian 5105 1691 (33)
Orkney 176 154 (88)
Shetland 153 83 (54)
Tayside 3025 865 (29)
Western Isles 211 143 (68)
SCOTLAND 32259 11264 (35)
17Prednisolone
Background and evidence
Prednisolone is a corticosteroid used to reduce inflammation in a wide range of conditions.
In June 2015, the interim Review of Operational Productivity in NHS Providers highlighted
that considerable savings could be made by reducing the use of costly soluble prednisolone
preparations. Oral prednisolone is available as a number of different preparations. The most
cost effective way to administer prednisolone is as 5mg plain tablets. Tablets of other
strengths, soluble tablets and liquids are considerably more costly (approximately eighty
times the price for an equivalent dose of some formulations).viii
A review of utilisation in Scotland indicated that additional saving could be achieved by
examining all solid dose prednisolone preparations issued. Since 2015 the proportion of
solid oral prednisolone issued as 5 mg plain tablets has increased from 64% to 78% (figure
8).ix In 2017, this has avoided over £160,000 in expenditure by reductions in the use of more
costly 25mg tablets and 5mg soluble tablets. However this saving opportunity has been
offset by the introduction of new preparations, mainly 20mg tablets and prednisolone
liquids. The net saving in the year to December 2017 is a little over £88,000.
18Figure 8: Change in use of oral prednisolone
Number of DDDs issued as each preparation as a percentage of the total number of DDDs issued for all oral
prednisolone preparations. Data source: HMUD
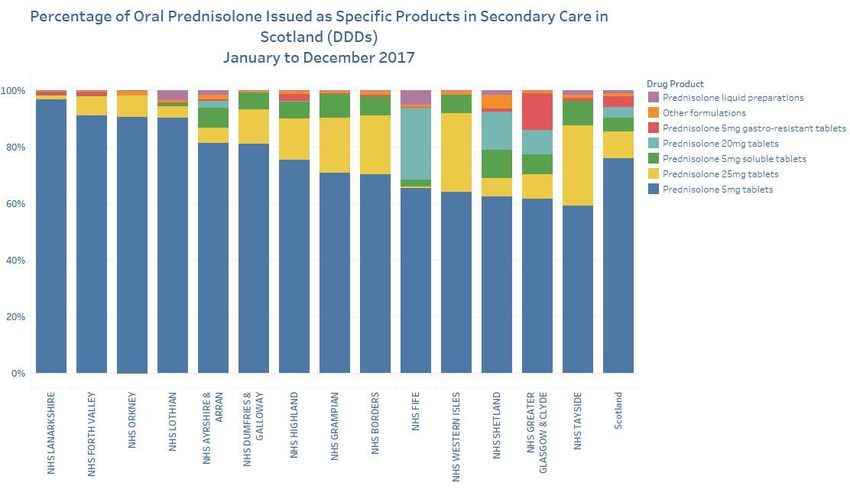
Despite this improvement, there remains a difference in the use of 5mg plain prednisolone
tablets between Boards (figure 9). The best performing Boards have further reduced their
use of more costly prednisolone preparations.
Cost and savings
It is estimated that if all Boards reduced their use of more costly prednisolone preparations
to that of the lower quartile of Boards additional annual savings of approximately £360,000
could be achieved. This would largely be due to reductions in the use of soluble
prednisolone tablets.
19Data - Prednisolone
Figure 9: Prednisolone
Number of DDDs issued of each preparation as a percentage of the total number of DDDs issued of all oral
prednisolone preparations, by Health Board. Data source: HMUD
20Table 8: Prednisolone
Health Board Name Liquid Other Prednisolone Prednisolone Prednisolone Prednisolone Prednisolone
Preparations Formulations 20mg tablets 25mg tablets 5mg gastro- 5mg soluble 5mg tablets
resistant tablets
tablets
NHS AYRSHIRE &
ARRAN 2% 2% 2% 5% 1% 7% 81%
NHS BORDERS 0% 2% 0% 21% 0% 7% 70%
NHS DUMFRIES &
GALLOWAY 0% 1% 0% 12% 0% 6% 81%
NHS FIFE 5% 1% 25% 0% 0% 3% 65%
NHS FORTH VALLEY 0% 1% 0% 7% 1% 0% 91%
NHS GRAMPIAN 0% 1% 0% 19% 0% 8% 71%
NHS GREATER
GLASGOW & CLYDE 0% 1% 9% 9% 13% 7% 62%
NHS HIGHLAND 0% 1% 0% 14% 2% 6% 75%
NHS LANARKSHIRE 0% 1% 0% 1% 1% 0% 97%
NHS LOTHIAN 4% 1% 0% 4% 0% 1% 90%
NHS ORKNEY 0% 2% 0% 8% 0% 0% 90%
NHS SHETLAND 2% 5% 14% 6% 1% 10% 62%
NHS TAYSIDE 2% 1% 0% 28% 1% 9% 59%
NHS WESTERN ISLES 0% 2% 0% 28% 0% 7% 64%
Scotland 1% 1% 4% 9% 4% 5% 76%
Boards can view their own potential savings by viewing the HMUD Prednisolone Predicted Savings report 5
5
HMUD users will need to be logged in to follow this link
21Table of References
iHealthcare Improvement Scotland. Biosimilar Medicines: A National Prescribing
Framework. 2018. Available here. Accessed May 2018
ii Hospital Medicines Utilisation Database (HMUD) search using terms *mab and *cept
iii
Biosimilar Medicines. Scottish Medicines Consortium May 2015. Available here. Accessed
August 2017
iv
Scottish Intercollegiate Guidelines Network. Clinical SIGN 154. Pharmacological
management of glycaemic control in people with type 2 diabetes. 2017. Available here.
Accessed May 2018
vHorvath K et al. Cochrane Database Syst Rev 2007, issue2. Art
No.:CD005613.DOI:10.1002/14651858
vi
Scottish Intercollegiate Guidelines Network. SIGN 116. Management of Diabetes. 2017.
Available here. Accessed February 2018
vii ISD 2017
viii BNF 2017
ix HMUD 2017
22You can also read