Exploratory graph analysis of the network data of the Ethereum blockchain version 1; peer review: awaiting peer review
←
→
Page content transcription
If your browser does not render page correctly, please read the page content below
F1000Research 2021, 10:908 Last updated: 07 OCT 2021

RESEARCH ARTICLE

Exploratory graph analysis of the network data of the
Ethereum blockchain [version 1; peer review: awaiting peer
review]
Timothy Tzen Vun Yap                  1,   Ting Fong Ho1, Hu Ng                 1,   Vik Tor Goh          2

1Faculty of Computing and Informatics, Multimedia University, Cyberjaya, Selangor, 63100, Malaysia
2Faculty of Engineering, Multimedia University, Cyberjaya, Selangor, 63100, Malaysia

v1   First published: 09 Sep 2021, 10:908                                       Open Peer Review
     https://doi.org/10.12688/f1000research.73141.1
     Latest published: 09 Sep 2021, 10:908
     https://doi.org/10.12688/f1000research.73141.1                             Reviewer Status AWAITING PEER REVIEW

                                                                                Any reports and responses or comments on the

Abstract                                                                        article can be found at the end of the article.
Background: This research uses exploratory graph analysis to analyze
the transaction data of the Ethereum network. This is achieved
through network visualization and mathematical and statistical
modelling of the network data.
Methods: The dataset used in this study was extracted from the
Ethereum in the BigQuery public dataset, specifically selected
transactions in July 2019. The transactions were firstly modelled as
network graphs and then visualized using the Kamada-Kawai and
force-directed graphs layouts. Further modelling was explored with
classical random graph and network block, with emphasis on network
cohesion, hierarchical clustering and community membership.
Results: Looking at the network visualization and hierarchical
clustering of the data, the network shows 170 clusters, the largest
having 135 members. Through random graph modelling the optimum
number of clusters is shown to be 95. Referring to the generated
dendrograms, notable large transactions center around the DRINK
token, the Maximine Exchange, the Upbit2 Exchange and the IDEX
Exchange, identified through public disclosure of their Ethereum
addresses. The network graphs tend to go towards the DRINK smart
contract and the Maximine Exchange, indicating deposit actions, while
it is the opposite for the IDEX Exchange. Further analysis also shows a
different number of communities than the expected number. Falling
short of the expected 170 clusters, the model is not able to capture
additional mechanism that may be present at the density and social
interaction distribution level of the network. On the other hand,
network block modelling shows only four major clusters out of the 170
expected clusters, an indication that the model is not able to capture
the network sufficiently.
Conclusions: The study was able to capture and model the
interconnectedness of the system with its notion of elements, in this
case, the transactions on the network.

                                                                                                                          Page 1 of 14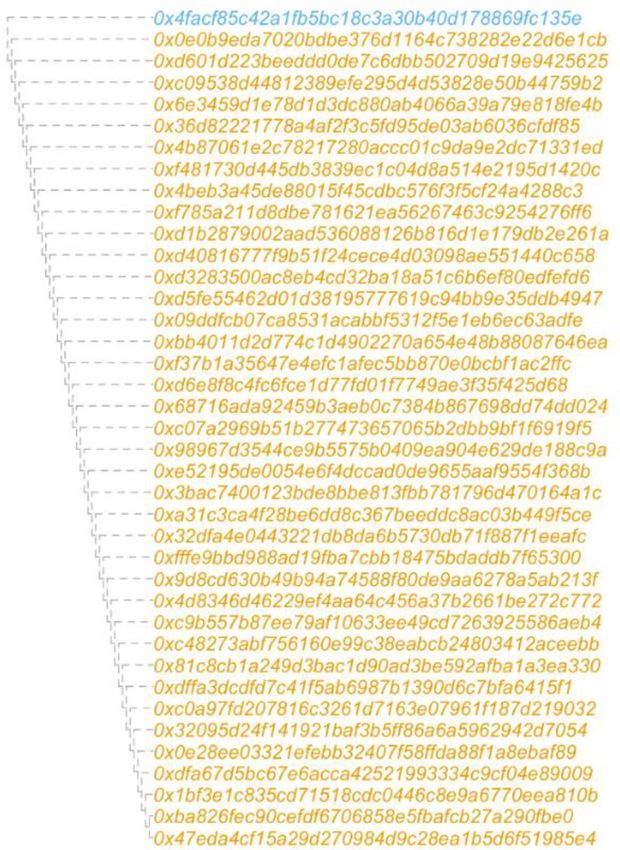
F1000Research 2021, 10:908 Last updated: 07 OCT 2021

Keywords
Ethereum, graph analysis, blockchain, network modelling

                 This article is included in the Research Synergy
                 Foundation gateway.

 Corresponding author: Timothy Tzen Vun Yap (timothy@mmu.edu.my)
 Author roles: Yap TTV: Conceptualization, Funding Acquisition, Investigation, Methodology, Project Administration, Supervision,
 Validation, Writing – Review & Editing; Ho TF: Data Curation, Investigation, Resources, Visualization, Writing – Original Draft Preparation;
 Ng H: Conceptualization, Investigation, Project Administration, Supervision, Validation, Writing – Review & Editing; Goh VT:
 Conceptualization, Resources, Validation, Writing – Review & Editing
 Competing interests: No competing interests were disclosed.
 Grant information: This work was supported by the Ministry of Higher Education, Malaysia, under the Fundamental Research Grant
 Scheme with grant number FRGS/1/2018/ICT02/MMU/03/6.
 The funders had no role in study design, data collection and analysis, decision to publish, or preparation of the manuscript.
 Copyright: © 2021 Yap TTV et al. This is an open access article distributed under the terms of the Creative Commons Attribution License,
 which permits unrestricted use, distribution, and reproduction in any medium, provided the original work is properly cited.
 How to cite this article: Yap TTV, Ho TF, Ng H and Goh VT. Exploratory graph analysis of the network data of the Ethereum
 blockchain [version 1; peer review: awaiting peer review] F1000Research 2021, 10:908
 https://doi.org/10.12688/f1000research.73141.1
 First published: 09 Sep 2021, 10:908 https://doi.org/10.12688/f1000research.73141.1

                                                                                                                                    Page 2 of 14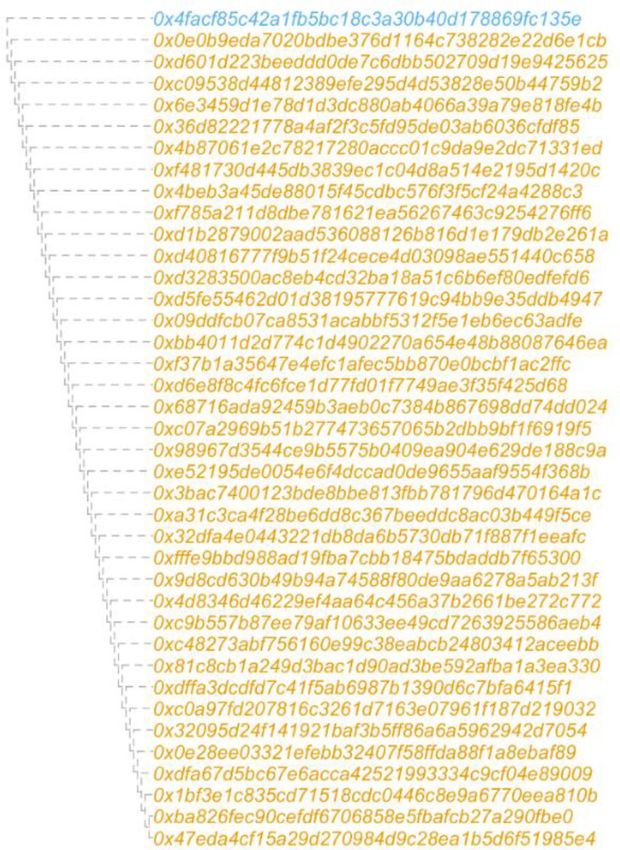
F1000Research 2021, 10:908 Last updated: 07 OCT 2021

Introduction
A blockchain is a distributed and replicated data structure in which a linked chain of digital information known as a
block, is stored as a public database or ledger. Each of the blocks in the chain may contain zero or more records of
transactions or exchanges. If another exchange happens on the network, a copy of the transaction is added to the record
of every member on the network.1

Blockchain has several characteristics that make it so compelling. Firstly, blockchain is immutable. It cannot be
corrupted, changed, or altered.2 A blockchain is also decentralized if it is a public one. There is no governing authority
overseeing the network. In addition, information on the blockchain is cryptographically hashed, thus preserving privacy
and integrity of the data that is stored.2 Ethereum is an open-source blockchain, known for its decentralized smart contract
platform. It is programmable and allows for the fabrication and distribution of decentralized applications (DApps).3

This research investigates the transaction data of the Ethereum network, through a graph analysis approach. This is
achieved through network visualization and mathematical and statistical modelling of the network data. The work
presented here provides a targeted analysis of the Ethereum network, capturing the interconnectedness of the system with
its notion of elements, in this case, the transactions on the network.

Related works
Small-world models were proposed by Watts et al.4 These creators were interested in the way that numerous networks
in the genuine work show significant levels of clustering, yet with the little distance between most vertices. They
recommended rather starting with a network graph with a cross-section structure, and afterward arbitrarily 'reworking' a
little the level of the edges. Assuming we have many N vertices that are instigated on an intermittent style, each of the
vertex joins its neighbors to their respective side.4

Barabási et al. proposed a preferential attachment model for modeling networks.5 The more associated a vertex is, the
more probable it is to get new connections. A vertex with a further extent has a more grounded capacity to get joins added
to the network.6

Exponential random graph models (ERGMs) have relations to generalized linear models. However, the appropriate
specification and fitting of exponential random graph models can be more unobtrusive than that of a standard generalized
linear model. Furthermore, a significant part of the standard inferential foundation accessible for generalized linear
models, based upon asymptotic approximations to fitting chi-square distributions, is not in the consideration for
exponential random graph models.7

Stochastic block models (SBM) are a class of models in the statistical data analysis of the network or graph data, and they
can be utilized to find or comprehend the structure and the latent of a network graph for clustering. This model will in
general deliver a graph containing networks, subsets described by being associated with edge densities.7

Methodology
Dataset

The dataset of transaction records of Ethereum was taken from the BigQuery public dataset (Ethereum in BigQuery).8
The attributes from_address and to_address will be used as nodes (vertices) and the relationship between them will be the
edges of the nodes in this study. The attributes and their descriptions are shown in Table 1. In this exploratory study, only
arbitrarily selected 1000 contiguous rows of transactions in July 2019 are considered.15

Software for analysis

The analysis is performed in R version 4.0.2, utilising the igraph R package for network analysis. The source code used
can be found at Zenodo.16

Network graph

A graph G ¼ ðV,EÞ is a set of E of links (edges), a set V of nodes (vertices), and where components of E are unordered
pairs fu,vg of distinct vertices u, v ∈ V . The number of vertices N v ¼ jV jand the number of edges N e ¼ jV j are also called
the order and size of the graph G, respectively.7

                                                                                                                              Page 3 of 14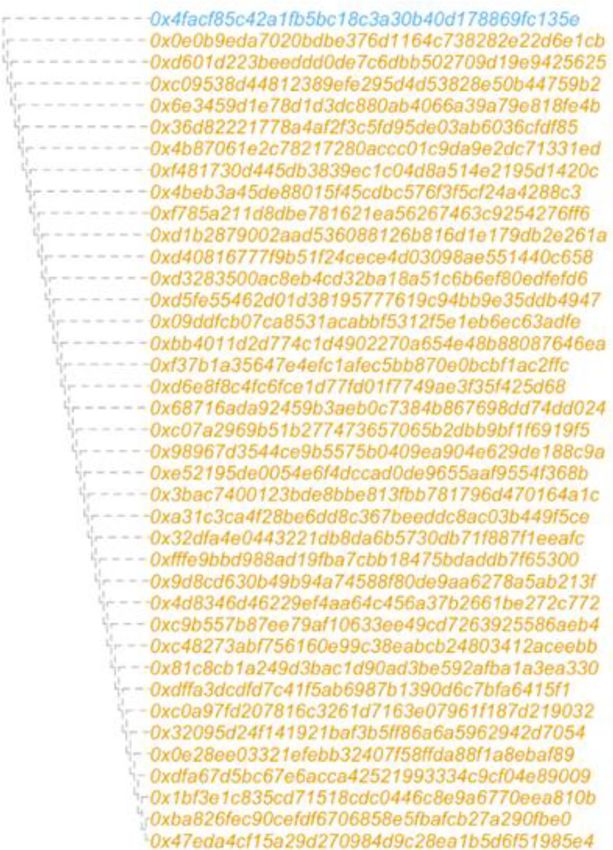
F1000Research 2021, 10:908 Last updated: 07 OCT 2021

Table 1. Attributes and description of the dataset (Ethereum in BigQuery).

 Attributes                            Descriptions
 hash                                  Hash of the transaction
 nonce                                 The number of transactions made by the sender prior to this one
 transaction_index                     Integer of the transactions index position in the block
 from_address                          Address of the sender
 to_address                            Address of the receiver. Null when it’s a contract creation transaction
 value                                 Value transferred in Wei
 gas                                   Gas provided by the sender
 gas_price                             Gas price provided by the sender in Wei
 input                                 The data sent along with the transaction
 receipt_cumulative_gas_used           The total amount of gas used when this transaction was executed in the block

Visualizing the network

To visualize a large network having over 1000 vertex and edge attributes, few methods exist. Kamada, et al. proposed a
technique to draw general graphs.9 This technique tends to be broadly utilized in the network structures that are managed
by the system. The mathematical displacement between the node in the drawing can be identified by graph-theoretic
displacement. The spring algorithm proposed by Kamada, et al. has good properties such as symmetric drawings, edge
crossing with a relatively small number of edges, and isomorphic graphs with almost congruent drawings.9

The DrL method provides two-dimensional visualizations of exceptionally huge theoretical chart structures.10 The graph
is drawn employing a force-directed algorithm based on recreated strengthening. This clustering is utilized to create a
coarsened graph (less vertex) which is at that point redrawn. This handle is rehashed until an adequately small graph is
produced.10

Charactering network cohesion

One way to deal with characterizing the network cohesion of a specific network graph is through the identification of
the subgraph of interest. The standard case is that of finished subgraphs and henceforth are subgroups of vertices that
are completely strong, as in all vertices inside the subgroup are associated by edges. Large groups of subgraphs are
considered rare in practice because they need the required network graph itself to be dense.7

dⅇnðH Þ ¼ jV H jðjjVEHHj1
                        j
                           Þ∕2 is the general formula of the density of a subgraph H ¼ ðV H ,E H Þ, that the recurrence of
acknowledged edges is comparative with possible edges, in an undirected graph G which has no self-loops and various
edges. In the situation that if G is a directed graph, jV H jðjV H j  1Þ will be replaced with the denominator of the equation
above. The value of zero and one in denðH Þ is to justify how near the subgraph H is to be becoming a clique in the
network.7

In graph clustering, the relative frequency also can be one of the methods to defining a cluster. The standard use of the
term clustering coefficient normally means the quantity clT ðGÞ ¼ 3ττ 3ΔððGGÞÞ , where τ Δ ðGÞ is the number of triangles in the
graph G, and τ 3 ðGÞ is the number of connected triples. The value of clT ðGÞ is the transitivity of the graph and is also
referred to as the fraction of transitive triples A graph G is fully connected if each node is reachable from all other nodes,
and that a graph’s connected component is a maximally connected subgraph.7

Hierarchical clustering

Various methods have been proposed for clustering, varying in essentially by the way they assess the nature of the
proposed clustering and quality of the enhancement brought about by the algorithms.11 These strategies adopt a greedy
strategy to looking through the states of all potential partitions C, through altering progressive applicant partitions
iteratively.

One of the most popular measures is modularity.10 Let C ¼ fC 1 ,…, Ck g as a given candidate partition and define f ij ¼
f ij ðCÞ to be the fraction of edges in the original network that connect vertices in C1 with vertices in C j . The modularity of
                                                                                                                                Page 4 of 14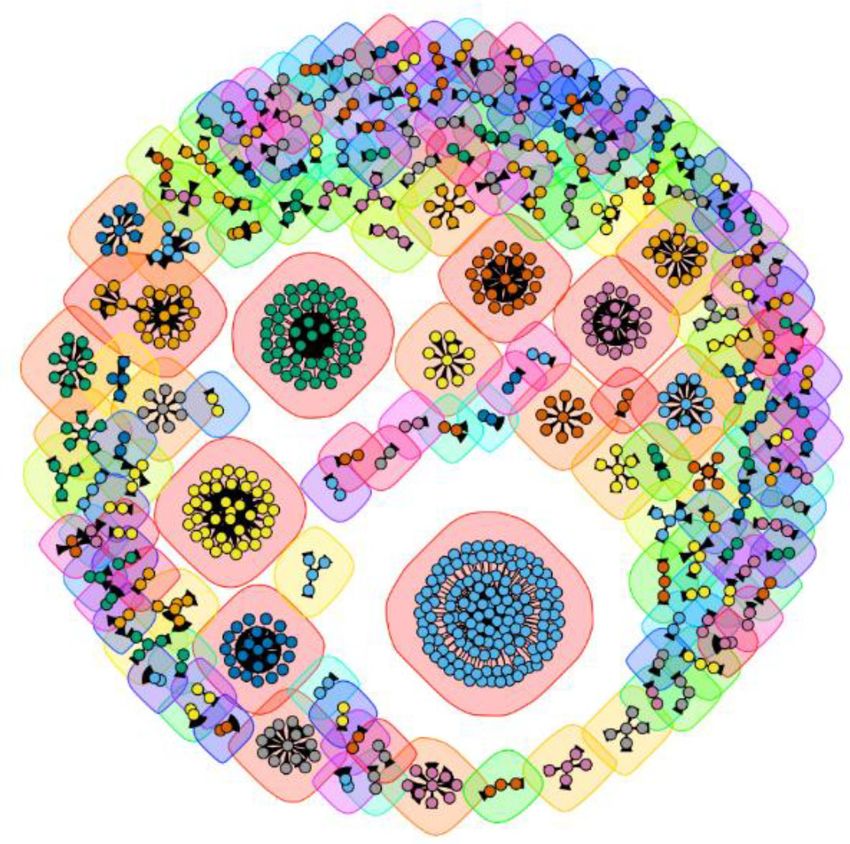
F1000Research 2021, 10:908 Last updated: 07 OCT 2021
Pk 2
C is the value modðCÞ ¼ k¼1 f kk ðCÞ f ∗kk , where f ∗kk is the expected value of f kk under some model of random
edge assignment.10
Classical random graph modelling
Graph modelling refers to a collection ℙθ ðGÞ, G ∈ g : θ ∈ ω , where g is a collection of possible graphs, ℙθ is a
probability distribution on g, and θ is a vector of parameters, ranging over possible values in ω. A collection g and a
uniform probability ℙðÞ over g is usually used to refer to a random graph model.7 Erdos et al. established a series of the
seminal paper on the classical theory of random graph models.8 Erdos et al.’s model specifies a collection of gN v ,N e of all
!1
N
graph G ¼ ðV, EÞ with jV j ¼ N v and jEj ¼ N e , and assigns probability ℙðGÞ ¼ to each G ∈ gNv ,N e , where
Ne
!
Nv
N¼ is the total number of distinct vertex pairs.8
2
Network block models
In a random graph, G, let G ¼ ðV,E Þ. The graph can be categorized into one of Q classes. Each element of the block model
for a particular graph can be specified as each element of the adjacency matrix Y, labelled as q and r of vertices i and j,
respectively, with a probability of Bernoulli random variable. Snijders, et al. introduced a parametric limit of the form.13
Results and discussions
The network graph (Figure 1) shows a total number of 170 clusters among 1000 rows of data. The top three clusters inside
the network graph consist of the size of 135 vertices, followed by 55 vertices, and 39 vertices. There are 103 clusters
having a pair of vertices, that is the smallest cluster size in this network.
The Kamada-Kawai layout uses a combination of spring model and the technique local minimization of global energy.15
The graph is shown in Figure 2.
Clauset proposed a fast and greedy approach to optimization through an agglomerative type of hierarchical clustering
algorithm.11 Figure 3 shows the outputs from the clustering, while Figure 4 shows the dendogram from the clustering.
The clusters are the same as the ones shown from the network graph (Figure 1). There are also many two-member
communities in this network, which may indicate disposable addresses after single use.
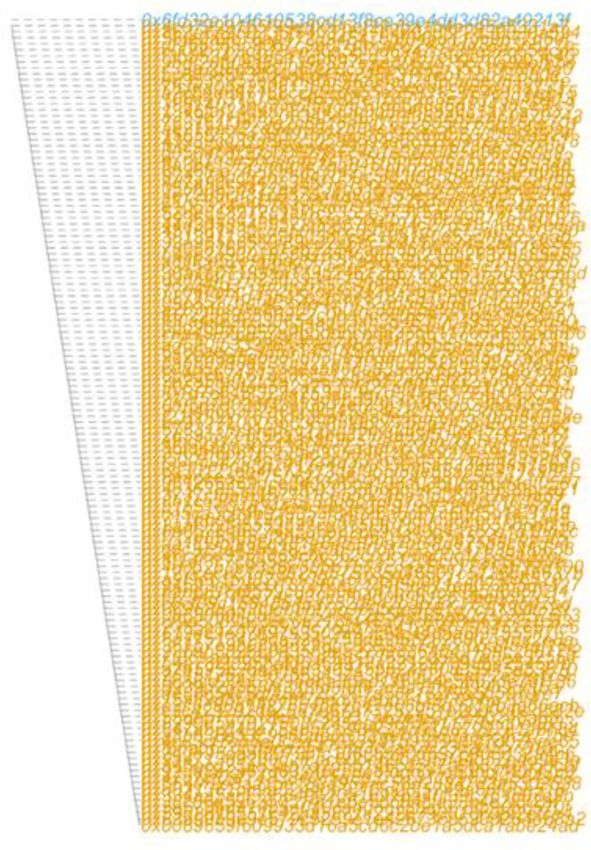
Looking into the clusters, Figures 5 and 6 show the membership of the largest cluster, with 135 addresses. We notice that
all the addresses point toward address 0x0089659f609933d16a5cd6c2be1a5dca1abe24ad. Looking at the Ethereum
blockchain Explorer, Etherscan,14 the address belongs to the DrinkChain (DRINK) token.
Figure 1. Network graph.
Page 5 of 14
F1000Research 2021, 10:908 Last updated: 07 OCT 2021

Figure 2. Kamada-Kawai graph.

Figure 3. Output of hierarchical clustering.

Figures 7 and 8 show the membership of the second-largest cluster which contains a total number of 55 addresses.
Members of the clusters point toward the address 0x8e766f57f7d16ca50b4a0b90b88f6468a09b0439.

This address belongs to the token, Maximine Coin (MXM).

Figures 9 and 10 show a cluster with 39 addresses, they all point to the address 0xBA826fEc90CEFdf6706858E5F-
baFcb27A290Fbe0.

This address belongs to Upbit2, a digital asset exchange in South Korea. This cluster is most probably showing
withdrawals as the network graphs are pointing out from the center.

                                                                                                                 Page 6 of 14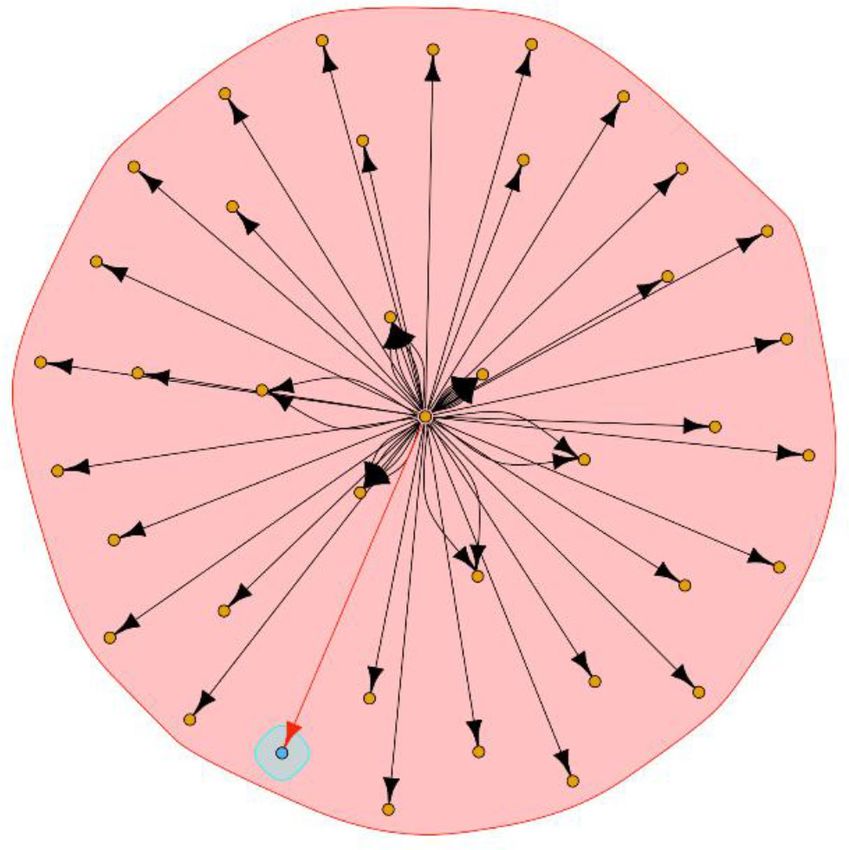
F1000Research 2021, 10:908 Last updated: 07 OCT 2021

Figure 4. Dendogram from the hierarchical clustering.

Figure 5. DrinkChain cluster.

Figures 11 and 12 show a cluster with 20 addresses, they all point to the address 0x2a0c0DBEcC7E4D658f48E01e3
fA353F44050c208.

This address belongs to IDEX, a decentralized exchange.

From hierarchical clustering, it is shown there are 170 communities.

To examine this further, network modelling was considered. In this case, two assumptions were made. The first one, the
same order of vertex and size, 800 and 1000 respectively, was maintained. The second is the same as the first, but with a
fixed degree of sequence.

In random graph modelling, Monte Carlo methods were used to generate approximations quickly over 1000 trials. For
each of the trials, community detection was employed. Figure 13 shows the number of communities. It is shown
both assumptions detected 24 and 95 communities, respectively. This is nowhere close to the actual 170 number of
communities. There could be additional mechanism at work which complicate the density and the social interaction
distribution in modeling the network.

                                                                                                                        Page 7 of 14
F1000Research 2021, 10:908 Last updated: 07 OCT 2021

Figure 6. Dendogram of the DrinkChain cluster.

Figure 7. Maximine Coin cluster.

                                                                                         Page 8 of 14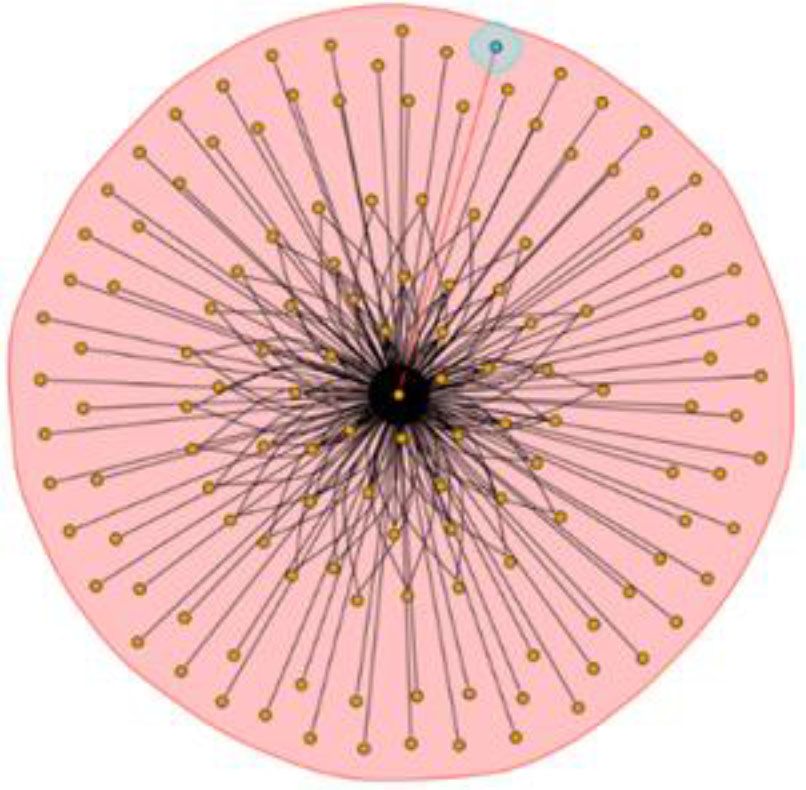
F1000Research 2021, 10:908 Last updated: 07 OCT 2021

Figure 8. Dendogram of the Maximine Coin cluster.

Figure 9. Upbit2 Coin cluster.

                                                                                            Page 9 of 14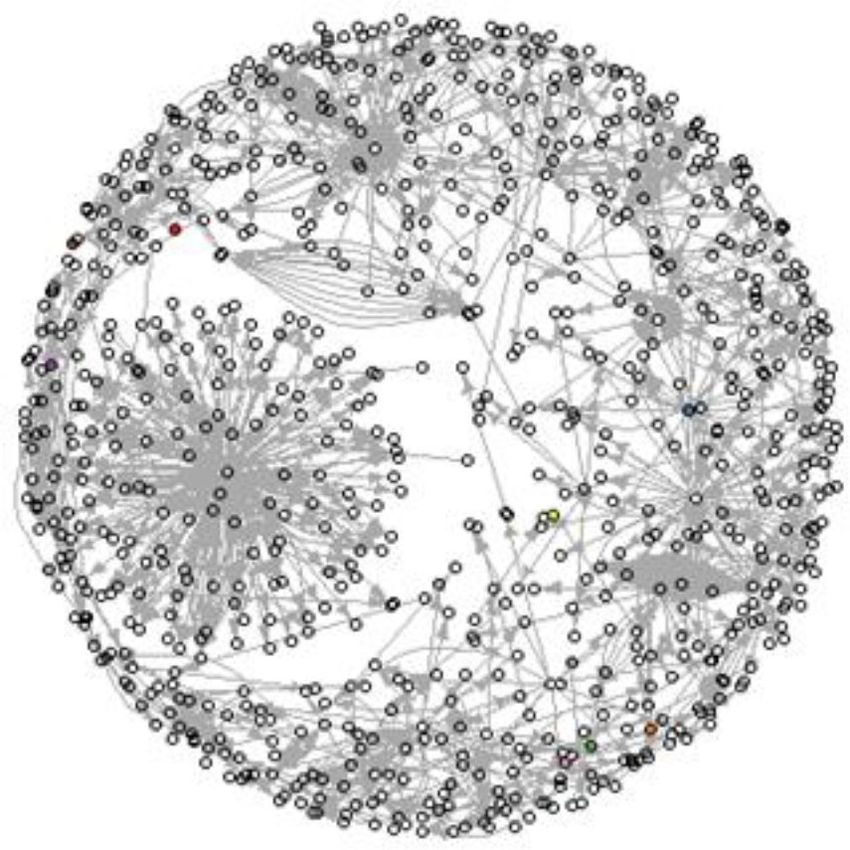
F1000Research 2021, 10:908 Last updated: 07 OCT 2021

Figure 10. Dendogram of the Upbit2 cluster.

Figure 11. IDEX cluster.

                                                                                     Page 10 of 14
F1000Research 2021, 10:908 Last updated: 07 OCT 2021
Figure 12. Dendogram of the IDEX cluster.
Figure 13. Relative frequency vs number of communities.
Page 11 of 14F1000Research 2021, 10:908 Last updated: 07 OCT 2021
Figure 14. Integrated conditional likelihood (ICL) vs classes.
Figure 15. Reorganized adjacency matrix.
Figure 16. Summary of class connection probabilities.
Page 12 of 14F1000Research 2021, 10:908 Last updated: 07 OCT 2021
Figure 14 shows the integrated conditional likelihood (ICL), with its corresponding classes Q. It is shown that the fitted
model has 4 classes, which suggests a suitable latitude of 4 for this model.
To investigate further, we estimated the posterior probability of each of the class members. We noticed that the evidence
for the class membership assignment shows a very strong relationship between vertices with a maximum posterior
probability of 99%. From the reorganized adjacency matrix (Figure 15), 0.57894737 and 0.38596491 will be the larger
proportions and the rest the smaller class proportions.
Figure 16 shows the visual summary of the class connection probabilities and the concordance of the 4 classes. Falling
short of the expected 170 clusters, the modelling effort was not able to capture additional mechanism that may be present
at the density and social interaction distribution level of the network.
Conclusions
The paper presented a targeted analysis of the Ethereum network, capturing the interconnectedness of the system with its
notion of elements, in this case, the transactions on the network. The study takes into account only selected transactions in
July 2019, which may not be generally representative of the Ethereum network. This will be addressed in future work.
Data availability
Underlying data
Zenodo: Extracted Ethereum transactions for July 2019 from the Ethereum in BigQuery public dataset. https://doi.
org/10.5281/zenodo.5263166.15
Data are available under the terms of the Creative Commons Attribution 4.0 International license (CC-BY 4.0).
Extended data
Analysis code available from: https://github.com/tzenvun/exploratory-network-eth.
Archived analysis code as at time of publication: https://doi.org/10.5281/zenodo.5336085.16
License: GNU General Public License v3.0.
References
1. Reiff N: 2020, February 1. 10. Martin SB: Dr.L: Distributed Recursive (Graph) Layout. Computer
Reference Source software. 2007.
2. Anwar H: 6 key blockchain features you need to know about. 11. Clauset A: Finding local community structure in networks.
101blockchians. 2018, May 24. Physical review E. 2005; 72(2): 026132.
Reference Source PubMed Abstract|Publisher Full Text
3. Frankenfield J: Ethereum. 2020, June 27; Retrieved from 12. Erdos P, Rényi A: On the evolution of random graphs. Publ. Math.
Investopedia. Inst. Hung. Acad. Sci.1960; 5(1): 17–60.
Reference Source Publisher Full Text
4. Watts DJ: Collective dynamics of 'small-world' networks. 1998; 13. Snijders TA, Pattison PE, Robins GL, et al. : New specifications for
440–442. exponential random graph models. Sociological Methodol. 2006;
5. Barabási AL, Albert R: Emergence of scaling in random networks. 36(1): 99–153.
science. 1999; 286(5439), 509–512. Publisher Full Text
Publisher Full Text 14. Etherscan: 2021, June 28. Retrieved from Etherscan.
6. Jain AK, Murty MN, Flynn PJ: Data clustering: a review. ACM Reference Source
computing surveys (CSUR). 1999; 31(3): 264–323. 15. Yap, Timothy TV, Ho: Extracted Ethereum transactions for July
Publisher Full Text 2019 from the Ethereum in BigQuery public dataset [Data set].
7. Kolaczyk ED, Csárdi G: Statistical analysis of network data with R. Zenodo. 2021.
New York: Springer; 2014. Publisher Full Text
8. Google Cloud: 2021, June 28; Retrieved from Ethereum in BigQuery - 16. tzenvun: tzenvun/exploratory-network-eth: First release
a Public Dataset for smart contract analytics. (v1.0.0). Zenodo. 2021.
Reference Source Publisher Full Text
9. Kamada T, Kawai S: An algorithm for drawing general undirected
graphs. Information processing. 1989.
Page 13 of 14F1000Research 2021, 10:908 Last updated: 07 OCT 2021
The benefits of publishing with F1000Research:
• Your article is published within days, with no editorial bias
• You can publish traditional articles, null/negative results, case reports, data notes and more
• The peer review process is transparent and collaborative
• Your article is indexed in PubMed after passing peer review
• Dedicated customer support at every stage
For pre-submission enquiries, contact research@f1000.com
Page 14 of 14You can also read