Analysts' Ideas of the Week - Last Week's Pick Was Up 51% www.researchfrc.com - Baystreet.ca
←
→
Page content transcription
If your browser does not render page correctly, please read the page content below

Analysts' Ideas of the Week
      Last Week’s Pick Was Up 51%

             May 25, 2021
        www.researchfrc.com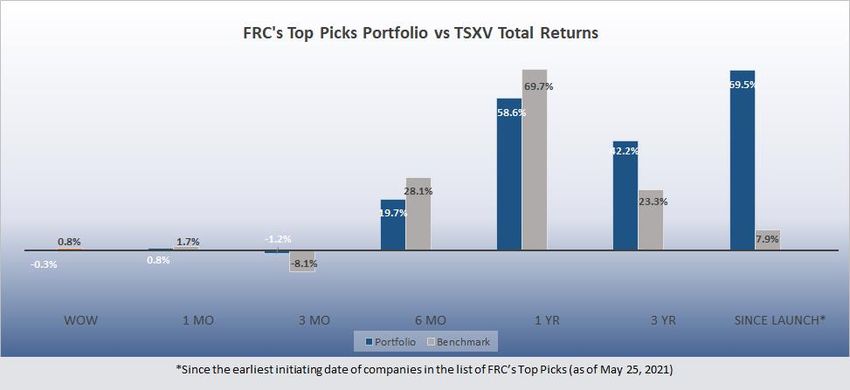
Page 2

                                     Reddit Discussed Stocks
Our pick last week, Aerpio Pharmaceuticals, Inc. (NASDAQ: ARPO), went from
$1.66 on last Monday’s closing, to $2.50 by Friday (up 51%). We note that the
Electric Vehicle (EVs) sector remains the most actively discussed among retail investors,
followed by crypto and cannabis sectors. This week, we are observing strong retail
sentiment around Pieris Pharmaceuticals (NASDAQ: PIRS). Key parameters used may
include – a) total number of mentions, b) percentage change in the number of mentions,
c) stock sentiment, d) stock price trend, and e) market capitalization.
      May 25, 2021
      Company                                        Ticker Sector
      Pieris Pharmaceuticals, Inc.                   PIRS Biotechnology
                                                  Source: FRC

                                             FRC Top Picks

The following table shows last week’s top five performers among our Top Picks,
including one gaming/betting company, one cannabis, and three junior resource
companies (two gold and one lithium). The top performer, Elys Game (NASDAQ:
ELYS), was up 15% WoW, due to stronger than expected Q1 results. Our reports
on ELYS can be viewed here.

                                   Top Five Performers Last Week

                                                  Source: FRC

Companies in our list are up 69.5% on average since we initiated coverage vs
7.9% for the benchmark (TSXV).

   ©2021 Fundamental Research Corp. “17+ Years of Bringing Undiscovered Investment Opportunities to the Forefront”
                    Click here to view FRC’s complete list of top picks
      PLEASE READ THE IMPORTANT DISCLOSURES AT THE BACK OF THIS REPORT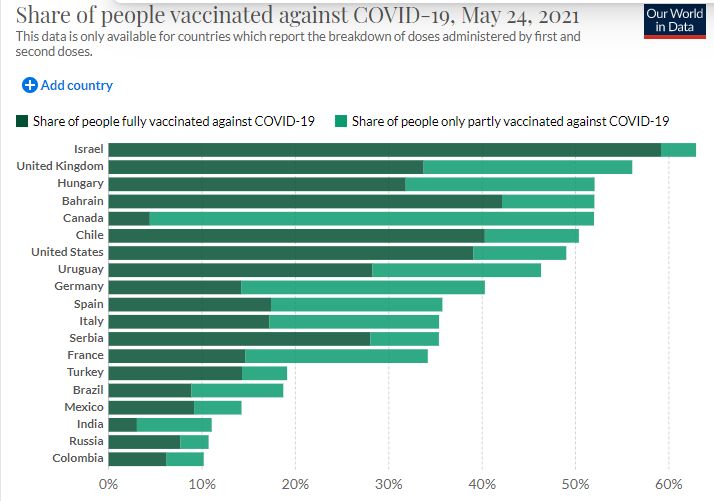
Page 3

                                         Performance by Sector

                                                  Source: FRC

Our complete list of top picks (updated weekly) can be viewed here.

                                  Weekly Mining Commentary

All of the seven global equity indices we track were up WoW.

   ©2021 Fundamental Research Corp. “17+ Years of Bringing Undiscovered Investment Opportunities to the Forefront”
                    Click here to view FRC’s complete list of top picks
      PLEASE READ THE IMPORTANT DISCLOSURES AT THE BACK OF THIS REPORT
Page 4
Copper and nickel prices retreated again. LME inventory levels of copper were up
13% WoW. Gold prices were up 3.3%, and hit US$1,900/oz today.
Source: MarketWatch
©2021 Fundamental Research Corp. “17+ Years of Bringing Undiscovered Investment Opportunities to the Forefront”
Click here to view FRC’s complete list of top picks
PLEASE READ THE IMPORTANT DISCLOSURES AT THE BACK OF THIS REPORTPage 5
Valuations of gold producers were up 3% WoW; base metal producers were down
5% due to lower copper and nickel prices.
©2021 Fundamental Research Corp. “17+ Years of Bringing Undiscovered Investment Opportunities to the Forefront”
Click here to view FRC’s complete list of top picks
PLEASE READ THE IMPORTANT DISCLOSURES AT THE BACK OF THIS REPORTPage 6
©2021 Fundamental Research Corp. “17+ Years of Bringing Undiscovered Investment Opportunities to the Forefront”
Click here to view FRC’s complete list of top picks
PLEASE READ THE IMPORTANT DISCLOSURES AT THE BACK OF THIS REPORTPage 7
Source: S&P Capital IQ & FRC
For two weeks in a row, all of the top 15 hardest hit nations reported flat or WoW
declines in new COVID-19 cases.
©2021 Fundamental Research Corp. “17+ Years of Bringing Undiscovered Investment Opportunities to the Forefront”
Click here to view FRC’s complete list of top picks
PLEASE READ THE IMPORTANT DISCLOSURES AT THE BACK OF THIS REPORTPage 8
Source: https://www.worldometers.info/coronavirus/
We continue to be surprised by the rapid vaccination rates in Canada. 52.0% of
Canada’s population has received at lease one dose vs 45.1% at the same time last
week. This compares to 49.0% in U.S. (up from 47.1%) and 56.1% in the U.K. (up from
53.9%). Health Canada has stated that restrictions could be lifted when 75% have
at least one dose, and 20% have their second dose. At current rates, we suspect
this could happen by August 2021.
©2021 Fundamental Research Corp. “17+ Years of Bringing Undiscovered Investment Opportunities to the Forefront”
Click here to view FRC’s complete list of top picks
PLEASE READ THE IMPORTANT DISCLOSURES AT THE BACK OF THIS REPORTPage 9
Source: https://www.worldometers.info/coronavirus/
We are maintaining our price forecasts.
In the following section, we review companies that announced key developments in the
past week.
©2021 Fundamental Research Corp. “17+ Years of Bringing Undiscovered Investment Opportunities to the Forefront”
Click here to view FRC’s complete list of top picks
PLEASE READ THE IMPORTANT DISCLOSURES AT THE BACK OF THIS REPORTPage 10
Mining / Exploration
Company Ticker Current Share FRC Fair Value Date of PR:
Name: Symbol Price: Estimate:
Corvus Gold Inc. TSX: KOR $3.60 $3.75 May 18, 2021
PR Content FRC Opinion
Received additional positive results from Positive – A maiden resource estimate on
the Mother Lode and the Lynnda Strip Lynnda Strip, and an updated resource
gold discoveries in Nevada: estimate on Mother Lode are expected later
this year. A recently completed PEA on the
➢ 185m @ 0.82 g/t, including 14.6m @ NB project had returned an ATNPV5% of
3.4 g/t from the Lynnda Strip US$452M, with an AT-IRR of 47%, using
➢ 14.5m @ 6.48 g/t from Mother Lode US$1,500/oz gold. Corvus’ MCAP is
C$460M, implying that the market is not
only discounting NB’s value, but also
assigning zero value to Mother Lode and
Lynnda Strip.
Company Ticker Current Share FRC Fair Value Date of PR:
Name: Symbol Price: Estimate:
Lomiko Metals TSXV: LMR $0.13 $0.27 May 18, 2021
Inc.
PR Content FRC Opinion
Closing the first tranche ($1.16M) of a Positive – LMR is planning to complete an
previously announced $1.45M flow- updated resource estimate, and a PEA, on
through financing. its La Loutre graphite (Quebec) project this
year.
Company Ticker Current Share FRC Fair Value Date of PR:
Name: Symbol Price: Estimate:
Renforth CSE: RFR $0.095 $0.12 May 18, 2021
Resources Inc.
PR Content FRC Opinion
Released additional drill results from Positive – These results are from areas
Parbec: 4.59 g/t gold over 18.75 m, outside the open-pit designed for the 2020
including 8.73 g/t over 7.15 m. resource estimate. We are expecting an
updated resource estimate in June/July.
©2021 Fundamental Research Corp. “17+ Years of Bringing Undiscovered Investment Opportunities to the Forefront”
Click here to view FRC’s complete list of top picks
PLEASE READ THE IMPORTANT DISCLOSURES AT THE BACK OF THIS REPORTPage 11
Company Ticker Current Share FRC Fair Value Date of PR:
Name: Symbol Price: Estimate:
Monarch Mining TSX: GBAR $0.85 $1.68 May 18, 2021
Corporation May 20, 2021
PR Content FRC Opinion
Completed 26 holes/5,286 m of resource Positive – We are pleased with the
expansion drilling at its Croinor gold program as the results returned high-grade
property. Key results included: 24.70 g/t values over short intercepts, and lower-
over 0.6 m, 17.70 g/t over 1.2 m, 1.79 g/t grade values over long intercepts. As the
over 21.0 m, 2.32 g/t Au over 9.6 m and program was focused on resource
16.9 g/t Au over 0.4 m. expansion, we believe this program has
increased Croinor’s resource estimate.
GBAR’s program at the Beaufor mine gold
project has also been returning encouraging
values. The company is planning to re-
commence production at the Beaufor mine
next year.
Company Ticker Current Share FRC Fair Value Date of PR:
Name: Symbol Price: Estimate:
American TSXV: AMY $0.92 $1.27 May 21, 2021
Manganese Inc.
PR Content FRC Opinion
Preparing for a drill program at its Rocher Neutral – This program will provide
Deboule copper-gold property (historic additional newsflow for the company.
producer) in B.C. The company also Management is focused on advancing their
announced that it will not follow through lithium-ion battery cathode recycling
with its plans to spin-out its assets in B.C. process to commercialization. AMY’s share
price is down 66% from its highs in
February 2021. We are reinstating our
previous fair value estimate of $1.27 per
share, which is based on a 6 tpd processing
plant.
©2021 Fundamental Research Corp. “17+ Years of Bringing Undiscovered Investment Opportunities to the Forefront”
Click here to view FRC’s complete list of top picks
PLEASE READ THE IMPORTANT DISCLOSURES AT THE BACK OF THIS REPORTPage 12
Company Ticker Current Share FRC Fair Value Date of PR:
Name: Symbol Price: Estimate:
Voyageur TSXV: VM $0.155 $0.39 May 18, 2021
Pharmaceuticals
Ltd.
PR Content FRC Opinion
Received Health Canada approval for its Positive - The company is preparing for
fifth product. commercialization. U.S. FDA applications
are also in process. VM holds barium and
iodine projects, and is developing a
business to manufacture and market
contrast agents (made with barium and/or
iodine compounds) used for radiology digital
imaging.
Company Ticker Current Share FRC Fair Value Date of PR:
Name: Symbol Price: Estimate:
Vista Gold Corp. NYSE: VGZ US$1.09 US$1.93 May 19, 2021
PR Content FRC Opinion
Announced results of two more holes of Positive – These two, and prior holes,
an ongoing drill program (2,400 m) at the indicate expansion potential outside the
100% owned Mt. Todd gold project in existing resource. A 2019 PFS had returned
Northern Territory, Australia. an AT-NPV5% of US$1.13B, based on
US$1,500 per oz gold. Vista’s current
• 42 meters @ 0.80 gpt, including 12 enterprise value is just US$107M.
meters @ 1.46 gpt
• 29 meters @ 2.65 gpt, including 0.31
meters @ 161.80 gpt
©2021 Fundamental Research Corp. “17+ Years of Bringing Undiscovered Investment Opportunities to the Forefront”
Click here to view FRC’s complete list of top picks
PLEASE READ THE IMPORTANT DISCLOSURES AT THE BACK OF THIS REPORTPage 13
Company Ticker Current Share FRC Fair Value Date of PR:
Name: Symbol Price: Estimate:
K9 Gold Corp. TSXV: KNC $0.55 $0.65 May 19, 2021
May 20, 2021
PR Content FRC Opinion
An IP survey at Stony Lake confirmed Positive - Shares are up 70% since we
multiple previously identified airborne initiated coverage on February 25, 2021.
geophysical anomalies, and new targets Stony Lake lies along a 27 km trend
for ground follow-up. between Marathon Gold’s (TSX: MOZ)
Valentine Lake project and Sokoman
Minerals’ (TSXV: SIC) Moosehead project,
and on a parallel structure to New Found
Gold’s (TSXV: NFG) Queensway project.
Stony Lake has not been systematically
tested. The company is planning to
commence a drill program next month.
Company Ticker Current Share FRC Fair Value Date of PR:
Name: Symbol Price: Estimate:
Bayhorse Silver TSXV: BHS $0.24 $0.67 May 20, 2021
Inc.
PR Content FRC Opinion
Preliminary drilling at the Bayhorse Silver Positive – These high grade values
Mine, Oregon returned: (outside the existing resource) are
promising. The company has an off-take
➢ 12.4 opt over 4 ft, agreement for 300 tonnes of silver/copper
➢ 7.1 opt over 4.2 ft concentrate production from the Bayhorse
➢ 4.69 opt over 2 ft Silver Mine. The current drill program will
allow BHS to block out high-grade materials
for the offtake agreement, and potentially
expand the current resource estimate.
©2021 Fundamental Research Corp. “17+ Years of Bringing Undiscovered Investment Opportunities to the Forefront”
Click here to view FRC’s complete list of top picks
PLEASE READ THE IMPORTANT DISCLOSURES AT THE BACK OF THIS REPORTPage 14
Company Ticker Current Share FRC Fair Value Date of PR:
Name: Symbol Price: Estimate:
Kootenay Silver TSXV: KTN $0.31 $0.60 May 25, 2021
Inc.
PR Content FRC Opinion
Released results from an ongoing drill Positive - Results from Columba continue
program at its Columba silver project: 809 to confirm the project’s potential for a high-
gpt silver over 2.63 meters, within 354 gpt grade resource. Columba is turning out to
silver over 9 meters. be KTN’s flagship asset.
Company Ticker Current Share FRC Fair Value Date of PR:
Name: Symbol Price: Estimate:
Wealth Minerals TSXV: WML $0.345 N/A May 25, 2021
Ltd
PR Content FRC Opinion
Arranged another $3.9M investment; the Positive – WML has yet to announce their
company had recently closed a $5M plans for these funds. Considering that the
private placement. company has raised $8M in such a short
time period, we believe management is
gearing up for an aggressive exploration
program, and/or M&A.
Company Ticker Current Share FRC Fair Value Date of PR:
Name: Symbol Price: Estimate:
Nexus Gold TSXV: NXS $0.065 NA May 25, 2021
Corp
PR Content FRC Opinion
Commenced a follow up drill program Neutral – NXS’s previous drill program had
(2,000 m/12-15 holes) at its 100% owned returned high-grade values such as 4.83 gpt
Dakouli 2 gold concession in Burkina over 20 m, including 14.51 gpt over 6m. In
Faso. addition, multiple holes had returned long
intercepts ofPage 15
Technology, Energy, and Special Situations
Company Ticker Current Share FRC Fair Value Date of PR:
Name: Symbol Price: Estimate:
Kontrol NEO: KNR $2.08 $6.71 May 25, 2021
Technologies
Corp.
PR Content FRC Opinion
Announced BioCloud’s first real-time Positive - Highly encouraging development;
COVID-19 detection, outside of a management expects $10M in sales from
laboratory setting. The detection was BioCloud this year. We are maintaining our
reported in one of its ongoing pilot revenue estimate of $34M for the year.
programs in Middle East.
Company Ticker Current Share FRC Fair Value Date of PR:
Name: Symbol Price: Estimate:
NEXE TSXV: NEXE $1.42 $2.65 May 19 & 20,
Innovations Inc. 2021
PR Content FRC Opinion
Announced that it has installed the Positive – We are pleased to see the
necessary equipment for launching its company moving forward with its Nespresso
fully compostable Nespresso-compatible pods, per our expected timeline. The
pods in Q3-2021. Management noted superfoods collaboration will give the pods
plans to increase production capacity to more market exposure. We are maintaining
50M (current capacity undisclosed). The our outlook.
company also announced a deal with
Rritual Superfoods Inc. (CSE: RSF) to
collaborate on its superfoods products.
©2021 Fundamental Research Corp. “17+ Years of Bringing Undiscovered Investment Opportunities to the Forefront”
Click here to view FRC’s complete list of top picks
PLEASE READ THE IMPORTANT DISCLOSURES AT THE BACK OF THIS REPORTPage 16
Company Ticker Current Share FRC Fair Value Date of PR:
Name: Symbol Price: Estimate:
Diginex Limited NASDAQ: $5.74 $24.70 May 24, 2021
EQOS
PR Content FRC Opinion
On May 20, 2021, the company had Positive – We are pleased to see Diginex
record daily spot and derivative trading posting strong trading volumes for back-to-
volume of over $200M. In the 30 days back months. For 2021, we estimating $17B
ended May 20th, trading volume reached in trading volume, and $10.2M in revenue
$2.9B, up 45% from the 30 days ended (unchanged).
May 4, 2021. We note that trading
volumes on crypto exchanges were high
from May 19 to May 21, due to a 30%
drop in bitcoin prices.
Company Ticker Current Share FRC Fair Value Date of PR:
Name: Symbol Price: Estimate:
Hello Pal CSE: HP $1.23 $2.67 May 25, 2021
International Inc.
PR Content FRC Opinion
Announced that it has closed the Neutral – Our fair value estimate does not
previously announced acquisition of include the crypto mining business. Once
mining rigs dedicated to mining Dogecoin management discloses additional details on
(DOGE) and Litecoin (LTC). The its business model, we will assign a fair
acquisition terms include a payment of value on this new initiative. Our revenue
$1.5M in cash, and $2.25M in common estimates for 2021 and 2022 are $15.41M
shares. and $51.84M, respectively (unchanged).
©2021 Fundamental Research Corp. “17+ Years of Bringing Undiscovered Investment Opportunities to the Forefront”
Click here to view FRC’s complete list of top picks
PLEASE READ THE IMPORTANT DISCLOSURES AT THE BACK OF THIS REPORTPage 17
Cannabis
Company Ticker Current Share FRC Fair Value Date of PR:
Name: Symbol Price: Estimate:
Pure Extracts CSE: PULL $0.27 $0.90 May 20, 2021
Technologies
Corp.
PR Content FRC Opinion
Announced a white label agreement for Positive – We are pleased to see the
its extraction services. company able to generate B2B demand for
its flagship extraction services. Its wholesale
extraction and white label services account
for 84% of our revenue estimate of $1.99M
in 2021. We are maintaining our outlook.
Weekly Cannabis Commentary
Cannabis Industry Performance
May 21, 2021
U.S. Companies YTD 1-Week 1-Year
Curaleaf Holdings Inc. 18% 0% 143%
Trulieve Cannabis Corp. 20% -2% 201%
Green Thumb Industries Inc. 13% -5% 198%
Cresco Labs Inc. 11% -7% 143%
Canadian Companies YTD 1-Week 1-Year
Aurora Cannabis Inc. -15% 10% -62%
Canopy Growth Corp. -12% 0% 9%
Cronos Group Inc. 1% 2% 4%
Tilray Inc. 81% 9% 58%
HEXO Corp. 50% -4% 141%
Organigram Holdings Inc. 94% 12% 50%
The Supreme Cannabis Co., Inc. 91% 5% 9%
Canadian Average 41% 5% 30%
U.S. Average 15% -3% 171%
Canadian MIN -15% -4% -62%
U.S. MIN 11% -7% 143%
Canadian MAX 94% 12% 141%
U.S. MAX 20% 0% 201%
Indices
Canadian YTD 1-Week 1-Year
HMMJ 16% 2% 26%
MCAN 13% 2% 19%
XCAN 10% 1% 7%
U.S. YTD 1-Week 1-Year
MSOS 8% -2% N/A*
*Launched on September 1, 2020 *Launched on September 1, 2020
Source: FRC
©2021 Fundamental Research Corp. “17+ Years of Bringing Undiscovered Investment Opportunities to the Forefront”
Click here to view FRC’s complete list of top picks
PLEASE READ THE IMPORTANT DISCLOSURES AT THE BACK OF THIS REPORTPage 18
There were no major developments in the industry last week. Recently released
Statistics Canada data showed declines in illicit cannabis’ market share, amid a
significant increase in the number of retail cannabis stores across the country. At the
end of 2020, legal cannabis’ market share was 56% vs 50% in Q3.
Source: Statistics Canada, Mjbijdaily.com
Valuation
As of May 21, 2021, the big four Canadian LPs are trading at a 122% premium (up
from 109% in the previous week) over their U.S. peers. We note that the premium
widens when there is positive sentiment in the cannabis sector.
©2021 Fundamental Research Corp. “17+ Years of Bringing Undiscovered Investment Opportunities to the Forefront”
Click here to view FRC’s complete list of top picks
PLEASE READ THE IMPORTANT DISCLOSURES AT THE BACK OF THIS REPORTPage 19
May 14, 2021 May 21, 2021
Canadian Companies Ticker TEV/Revenue TEV/EBITDA TEV/Revenue TEV/EBITDA
Aurora Cannabis Inc. TSX: ACB 6.1 NM 6.8 NM
Canopy Growth Corp. TSX: WEED 19.7 NM 19.6 NM
Cronos Group Inc. TSX: CRON 40.1 NM 41.0 NM
Tilray Inc. NASDAQ: TLRY 10.0 NM 10.8 NM
HEXO Corp. NYSE: HEXO 7.8 NM 7.4 NM
Organigram Holdings Inc. TSX: OGI 12.0 NM 13.5 NM
The Supreme Cannabis Co., Inc. TSX: FIRE 4.2 NM 4.7 NM
AVERAGE 14.3 NM 14.8 NM
MEDIAN 10.0 NM 10.8 NM
MINIMUM 4.2 NM 4.7 NM
MAXIMUM 40.1 NM 41.0 NM
U.S. Companies Ticker TEV/Revenue TEV/EBITDA TEV/Revenue TEV/EBITDA
Curaleaf Holdings Inc. OTC: CURLF 12.9 49.8 13.0 50.1
Trulieve Cannabis Corp. OTC TCNNF 7.9 17.26 8.2 17.97
Green Thumb Industries Inc. OTC: GTBIF 10.0 31.5 9.4 29.7
Cresco Labs Inc. OTC: CRLBF 8.8 35.16 8.3 33.07
AVERAGE 9.9 33.4 9.7 32.7
MEDIAN 9.4 33.3 8.8 31.4
MINIMUM 7.9 17.3 8.2 18.0
MAXIMUM 12.9 49.8 13.0 50.1
Canadian Big Four Average 23.3 23.8
WEED, APHA, TLRY, CRON Median 19.7 19.6
Implied Premium Over U.S. Big Four (Median) 109% 122%
Source: S&P Capital IQ, FRC
The following chart shows the average EV/R of the companies we track in both sectors:
Average EV/R (October 2019 – May 2021)
Source: S&P Capital IQ, FRC
©2021 Fundamental Research Corp. “17+ Years of Bringing Undiscovered Investment Opportunities to the Forefront”
Click here to view FRC’s complete list of top picks
PLEASE READ THE IMPORTANT DISCLOSURES AT THE BACK OF THIS REPORTPage 20
Canadian Retail Cannabis Pricing
Province (As of 2021/05/25) Average Price per Gram Average Price per Gram THC Average Price per Gram CBD # of Products Min. Price Max. Price
B.C. $ 9.78 $ 9.86 $ 8.42 227 $ 3.53 $ 15.71
Ontario $ 9.47 $ 9.64 $ 7.95 356 $ 3.66 $ 22.66
Quebec $ 9.38 $ 9.38 $ 9.30 259 $ 4.85 $ 21.68
Alberta $ 10.94 $ 10.93 $ 10.82 388 $ 3.52 $ 22.00
N.B. $ 9.45 $ 9.60 $ 7.58 223 $ 3.57 $ 16.28
P.E.I. $ 9.65 $ 9.67 $ 9.34 172 $ 2.20 $ 23.30
Newfoundland $ 10.02 $ 9.96 $ 10.36 161 $ 4.46 $ 15.40
Yukon $ 16.33 $ 16.92 $ 13.95 4 $ 13.68 $ 13.95
N.S. $ 10.11 $ 10.15 $ 9.66 194 $ 5.14 $ 42.85
Nunavut $ 13.15 $ 13.35 $ 12.41 32 $ 9.43 $ 17.91
Northwest Territories $ 14.68 $ 14.68 2 $ 12.08 $ 17.28
Manitoba $ 11.44 $ 11.37 $ 11.55 362 $ 4.87 $ 23.57
Saskatchewan $ 12.08 $ 12.08 $ 12.07 251 4.40 38.50
CANADA $ 11.27 $ 11.35 $ 10.28
Province (As of 2021/05/17) Average Price per Gram Average Price per Gram THC Average Price per Gram CBD # of Products Min. Price Max. Price
B.C. $ 9.79 $ 9.87 $ 8.42 226 $ 3.53 $ 15.71
Ontario $ 9.55 $ 9.77 $ 7.95 356 $ 3.66 $ 22.66
Quebec $ 9.38 $ 9.36 $ 9.44 254 $ 4.85 $ 21.68
Alberta $ 10.95 $ 10.95 $ 10.82 386 $ 3.52 $ 22.00
N.B. $ 9.42 $ 9.65 $ 7.58 220 $ 3.57 $ 16.28
P.E.I. $ 9.65 $ 9.67 $ 9.34 170 $ 2.20 $ 23.30
Newfoundland $ 10.02 $ 9.96 $ 10.36 161 $ 4.46 $ 15.40
Yukon $ 16.33 $ 16.92 $ 13.95 4 $ 13.68 $ 22.28
N.S. $ 10.12 $ 10.17 $ 9.66 193 $ 5.14 $ 42.85
Nunavut $ 13.15 $ 13.35 $ 12.41 32 $ 9.43 $ 17.91
Northwest Territories $ 14.68 $ 14.68 2 $ 12.08 $ 17.28
Manitoba $ 11.42 $ 11.37 $ 11.55 362 $ 4.87 $ 23.57
Saskatchewan $ 12.09 $ 12.09 $ 12.07 248 4.40 38.50
CANADA $ 11.27 $ 11.37 $ 10.30
Source: Online Provincial Cannabis Stores, FRC
The average retail price per gram stayed the same week-over-week at $11.27. The
chart below shows the Canadian retail dried cannabis flower pricing trend:
Canadian Retail Dried Cannabis Flower Pricing
Source: Online Provincial Cannabis Stores, FRC
Canadian Retail Cannabis Stores
As of May 25, 2021, there are 2,004 retail cannabis stores, a WoW increase of 49
stores across Canada, with 44 in Ontario, four in Manitoba, and one in B.C.
©2021 Fundamental Research Corp. “17+ Years of Bringing Undiscovered Investment Opportunities to the Forefront”
Click here to view FRC’s complete list of top picks
PLEASE READ THE IMPORTANT DISCLOSURES AT THE BACK OF THIS REPORTPage 21
Nationwide Store Count
May-3-2021 May-10-2021 May-17-2021 May-25-2021
Geographic Region Store Count Store Count Store Count Store Count Population Population / Store
Alberta 618 623 623 623 4,428,247 7,108
B.C. 333 338 340 341 5,120,184 15,015
Manitoba 80 80 80 84 1,379,121 16,418
N.B. 20 20 20 20 780,890 39,045
N.S. 25 25 25 25 978,274 39,131
Newfoundland 30 30 30 30 520,437 17,348
Northwest Territories 6 6 6 6 44,982 7,497
Nunavut N/A N/A N/A N/A 39,486 N/A
Ontario 692 715 726 770 14,745,040 19,149
P.E.I. 4 4 4 4 158,717 39,679
Quebec 68 68 68 68 8,552,362 125,770
Saskatchewan 68 68 68 68 1,181,987 17,382
Yukon 5 5 5 5 41,293 8,259
CANADA 1,949 1,982 1,995 2,044 37,971,020 18,577
Source: Provincial Websites, FRC
©2021 Fundamental Research Corp. “17+ Years of Bringing Undiscovered Investment Opportunities to the Forefront”
Click here to view FRC’s complete list of top picks
PLEASE READ THE IMPORTANT DISCLOSURES AT THE BACK OF THIS REPORTPage 22
Weekly Psychedelic Commentary
Psychedelic Industry Performance
May 21, 2021
Company YTD 1-Week 1-Year
COMPASS Pathways plc -27% 1% N/A
Numinus Wellness Inc. -16% 0% N/A
Mind Medicine Inc. 11% -6% N/A
Seelos Therapeutics Inc. 109% -25% 220%
AVERAGE 19% -8% 220%
MIN -27% -25% 220%
MAX 109% 1% 220%
Index YTD 1-Week 1-Year
PSYK -17% -1% N/A*
Source: TMX Money, FRC
Over the past week, PSYK was down 1%.
©2021 Fundamental Research Corp. “17+ Years of Bringing Undiscovered Investment Opportunities to the Forefront”
Click here to view FRC’s complete list of top picks
PLEASE READ THE IMPORTANT DISCLOSURES AT THE BACK OF THIS REPORTPage 23
Disclaimers and Disclosure
The opinions expressed in this report are the true opinions of the analyst(s) about any companies and industries mentioned. Any
“forward looking statements” are our best estimates and opinions based upon information that is publicly available and that we
believe to be correct, but we have not independently verified with respect to truth or correctness. There is no guarantee that our
forecasts will materialize. Actual results will likely vary. Certain companies mentioned in pages 2, and 10-17 are covered by FRC
under an issuer paid model. FRC or companies with related management, and Analysts, may hold shares in some companies
mentioned in this report including Barrick, and HP. Distribution procedure: our reports are distributed first to our web-based
subscribers on the date shown on this report then made available to delayed access users through various other channels for a
limited time.
To subscribe for real-time access to research, visit https://www.researchfrc.com/website/subscribe for subscription options.
This report contains "forward looking" statements. Forward-looking statements regarding the Company, industry, and/or stock’s
performance inherently involve risks and uncertainties that could cause actual results to differ from such forward-looking statements.
Factors that would cause or contribute to such differences include, but are not limited to, continued acceptance of the Company's
products/services in the marketplace; acceptance in the marketplace of the Company's new product lines/services; competitive
factors; new product/service introductions by others; technological changes; dependence on suppliers; systematic market risks and
other risks discussed in the Company's periodic report filings, including interim reports, annual reports, and annual information forms
filed with the various securities regulators. By making these forward-looking statements, Fundamental Research Corp. and the
analyst/author of this report undertakes no obligation to update these statements for revisions or changes after the date of this
report.
Fundamental Research Corp DOES NOT MAKE ANY WARRANTIES, EXPRESSED OR IMPLIED, AS TO RESULTS TO BE
OBTAINED FROM USING THIS INFORMATION AND MAKES NO EXPRESS OR IMPLIED WARRANTIES OR FITNESS FOR A
PARTICULAR USE. ANYONE USING THIS REPORT ASSUMES FULL RESPONSIBILITY FOR WHATEVER RESULTS THEY
OBTAIN FROM WHATEVER USE THE INFORMATION WAS PUT TO. ALWAYS TALK TO YOUR FINANCIAL ADVISOR BEFORE
YOU INVEST. WHETHER A STOCK SHOULD BE INCLUDED IN A PORTFOLIO DEPENDS ON ONE’S RISK TOLERANCE,
OBJECTIVES, SITUATION, RETURN ON OTHER ASSETS, ETC. ONLY YOUR INVESTMENT ADVISOR WHO KNOWS YOUR
UNIQUE CIRCUMSTANCES CAN MAKE A PROPER RECOMMENDATION AS TO THE MERIT OF ANY PARTICULAR
SECURITY FOR INCLUSION IN YOUR PORTFOLIO. This REPORT is solely for informative purposes and is not a solicitation or an
offer to buy or sell any security. It is not intended as being a complete description of the company, industry, securities or
developments referred to in the material. Any forecasts contained in this report were independently prepared unless otherwise
stated, and HAVE NOT BEEN endorsed by the Management of the company which is the subject of this report. Additional
information is available upon request. THIS REPORT IS COPYRIGHT. YOU MAY NOT REDISTRIBUTE THIS REPORT WITHOUT
OUR PERMISSION. Please give proper credit, including citing Fundamental Research Corp and/or the analyst, when quoting
information from this report. The information contained in this report is intended to be viewed only in jurisdictions where it may be
legally viewed and is not intended for use by any person or entity in any jurisdiction where such use would be contrary to local
regulations or which would require any registration requirement within such jurisdiction.
©2021 Fundamental Research Corp. “17+ Years of Bringing Undiscovered Investment Opportunities to the Forefront”
Click here to view FRC’s complete list of top picks
PLEASE READ THE IMPORTANT DISCLOSURES AT THE BACK OF THIS REPORTYou can also read