Analysts' Ideas of the Week - These Two Factors to Impact Cannabis Stocks This Week - Baystreet.ca
←
→
Page content transcription
If your browser does not render page correctly, please read the page content below

Analysts' Ideas of the Week
These Two Factors to Impact Cannabis Stocks This Week

                    May 3, 2021
               www.researchfrc.com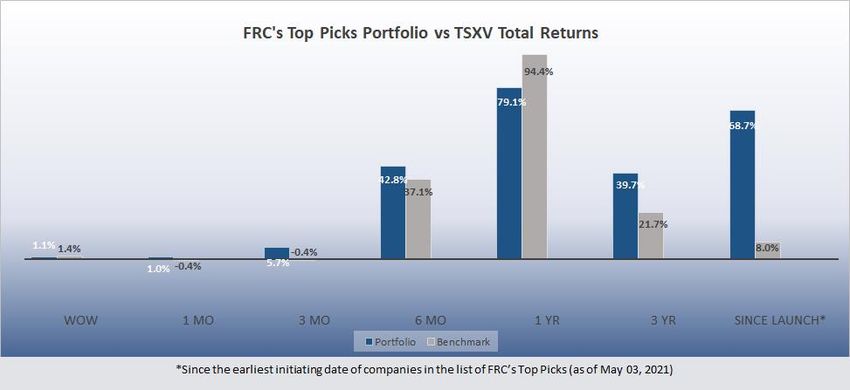
Page 2

                                             FRC Top Picks

The following table shows last week’s top five performers among our Top Picks,
including three junior resource companies (one copper and two electric vehicle metals),
and two technology companies. The top performer, Hello Pal (CSE: HP), was up 32%
WoW. Although HP’s flagship asset is its social media app, we believe its recent
initiatives in the crypto space have been attracting new investors. Our reports on HP
can be viewed here.

                                   Top Five Performers Last Week

                                                  Source: FRC

Our portfolio (equally weighted) outperformed the benchmark (TSXV) in five out
of seven time periods we track.

   ©2021 Fundamental Research Corp. “17+ Years of Bringing Undiscovered Investment Opportunities to the Forefront”
                    Click here to view FRC’s complete list of top picks
      PLEASE READ THE IMPORTANT DISCLOSURES AT THE BACK OF THIS REPORT
Page 3
Performance by Sector
Source: FRC
Our complete list of top picks (updated weekly) can be viewed here.
Reddit Discussed Stocks
Based on our review of multiple data points on retail platforms, we note that the Electric
Vehicle (EVs) sector remains the most actively discussed among retail investors,
followed by Cannabis and Crypto sectors. This week, we are observing strong retail
sentiment around Precipio, Inc. (NASDAQ: PRPO). Key parameters used may include –
a) total number of mentions, b) percentage change in the number of mentions, c) stock
sentiment, d) stock price trend, and e) market capitalization.
May 3, 2021
Company Ticker Sector
Precipio, Inc. PRPO Diagnostics & Research
Source: FRC
Weekly Mining Commentary
Global equity indices remained relatively flat last week.
©2021 Fundamental Research Corp. “17+ Years of Bringing Undiscovered Investment Opportunities to the Forefront”
Click here to view FRC’s complete list of top picks
PLEASE READ THE IMPORTANT DISCLOSURES AT THE BACK OF THIS REPORTPage 4
Among mainstream metals, nickel was the best performer, as inventory levels fell
sharply on the SHFE (Shanghai).
Source: MarketWatch
©2021 Fundamental Research Corp. “17+ Years of Bringing Undiscovered Investment Opportunities to the Forefront”
Click here to view FRC’s complete list of top picks
PLEASE READ THE IMPORTANT DISCLOSURES AT THE BACK OF THIS REPORTPage 5
Valuations of gold producers were down 5% WoW; base metal producers were
down 1%.
©2021 Fundamental Research Corp. “17+ Years of Bringing Undiscovered Investment Opportunities to the Forefront”
Click here to view FRC’s complete list of top picks
PLEASE READ THE IMPORTANT DISCLOSURES AT THE BACK OF THIS REPORTPage 6
©2021 Fundamental Research Corp. “17+ Years of Bringing Undiscovered Investment Opportunities to the Forefront”
Click here to view FRC’s complete list of top picks
PLEASE READ THE IMPORTANT DISCLOSURES AT THE BACK OF THIS REPORTPage 7
Source: S&P Capital IQ & FRC
Among the top 15 hardest hit nations, only India reported a WoW increase in new
COVID-19 cases last week. Five countries had reported increases in the prior week.
Only 9.2% of India’s population has received a dose of vaccine. At current rates, we
expect India to take 10 more months to vaccinate 50% of its population.
©2021 Fundamental Research Corp. “17+ Years of Bringing Undiscovered Investment Opportunities to the Forefront”
Click here to view FRC’s complete list of top picks
PLEASE READ THE IMPORTANT DISCLOSURES AT THE BACK OF THIS REPORTPage 8
Source: https://www.worldometers.info/coronavirus/
Highly vaccinated nations such as the U.S., the U.K., and Israel, continued to
report flat or declines in new cases. 44.0% of the U.S. population has received
vaccinations (at least one dose) vs 41.9% at the same time last week. This compares to
50.8% in the U.K. (up from 49.6%), and 33.6% in Canada (up from 29.2%).
Approximately 2,300 Canadians have contracted the virus two weeks after receiving
their first dose of vaccine, or 1.3% of new cases since the vaccine rollout began. We
believe this data clearly indicates the success of vaccines.
We continue to estimate that 50% of the U.S. population will be vaccinated by June. At
current rates, we estimate that Germany/France/Italy are expected to reach 50% by
July/August. South American countries are expected to hit 50% by October.
©2021 Fundamental Research Corp. “17+ Years of Bringing Undiscovered Investment Opportunities to the Forefront”
Click here to view FRC’s complete list of top picks
PLEASE READ THE IMPORTANT DISCLOSURES AT THE BACK OF THIS REPORTPage 9
Source: https://www.worldometers.info/coronavirus/
We are maintaining our metals price forecasts. As shown below, we expect gold and
nickel to outperform other metals in H2-2021.
In the following section, we review companies that announced key developments in the
past week.
©2021 Fundamental Research Corp. “17+ Years of Bringing Undiscovered Investment Opportunities to the Forefront”
Click here to view FRC’s complete list of top picks
PLEASE READ THE IMPORTANT DISCLOSURES AT THE BACK OF THIS REPORTPage 10
Mining / Exploration
Company Ticker Current Share FRC Fair Value Date of PR:
Name: Symbol Price: Estimate:
Los Andes TSXV: LA $10.50 $13.10 April 30, 2021
Copper Ltd.
PR Content FRC Opinion
Received unanimous approval from the Positive – This is a major development as
Regional Environmental Committee for the company can now proceed to complete
drilling (up to 350 holes) at the the required drilling for a PFS. Shortly after
Vizcachitas project (Chile). this approval, the company announced a
US$5M convertible debenture investment
from Queen’s Road Capital Investment
(TSXV: QRC). A PEA had returned an AT-
NPV8% of US$1.8B at US$3.00/lb copper.
LA’s current MCAP is C$300M.
Company Ticker Current Share FRC Fair Value Date of PR:
Name: Symbol Price: Estimate:
Tudor Gold TSXV: TUD $2.61 $5.29 April 27, 2021
Corp.
PR Content FRC Opinion
Partner, Teuton Resources (TSXV: TUO), Positive - Funds will be used for exploration
invested $9.6M by acquiring flow through at Treaty Creek, which borders Seabridge
and non-flow through shares of TUD. Gold’s (TSX: SEA) KSM property, and
Pretium’s (TSX: PVG) Brucejack property in
B.C.’s Golden Triangle. Treaty Creek has
one of the largest undeveloped gold
resource estimates in the Americas, with
19.4 Moz of AuEq in M&I, and 7.9 Moz of
AuEq in inferred. TUD is targeting to
complete an updated resource estimate in
early 2022.
©2021 Fundamental Research Corp. “17+ Years of Bringing Undiscovered Investment Opportunities to the Forefront”
Click here to view FRC’s complete list of top picks
PLEASE READ THE IMPORTANT DISCLOSURES AT THE BACK OF THIS REPORTPage 11
Company Ticker Current Share FRC Fair Value Date of PR:
Name: Symbol Price: Estimate:
Gold Springs TSX: GRC $0.11 $0.30 April 28, 2021
Resource Corp
PR Content FRC Opinion
Closed US$2M of a US$20M financing. Positive - The project has a M&I resource
Drilled 2,522 m (15 holes) of a planned of 610 Koz gold (0.53 gpt) and 10.8 Moz
10,000 m resource expansion drill silver (9.4 gpt), and an inferred resource of
program on its 100% owned Gold Springs 90 Koz gold (0.49 gpt) and 1.3 Moz silver (7
project on the Nevada-Utah border. gpt) on four of 32 identified targets on the
property. A PEA showed an AT-NPV10% of
US$111M, using US$1,450 per oz gold.
GRC’s MCAP is $27M.
Company Ticker Current Share FRC Fair Value Date of PR:
Name: Symbol Price: Estimate:
Monarch TSX: GBAR $0.88 $1.68 April 29, 2021
Mining
Corporation
PR Content FRC Opinion
Announced additional results from its Positive – These high grade results are
2020-2021/42,500 m drill program on its highly encouraging. Results of 34% of the
Beaufor Mine gold project (Québec). 275 planned holes have been released,
which includes several high-grade
➢ 187.0 g/t Au over 0.5 m, intercepts. The company is planning an
➢ 151.5 g/t Au over 0.5 m aggressive $7M resource expansion
➢ 147.5 g/t Au over 0.3 m program across three of its properties in
2021/2022, and to re-commence production
at the Beaufor mine in 2022.
Company Ticker Current Share FRC Fair Value Date of PR:
Name: Symbol Price: Estimate:
Renforth CSE: RFR $0.095 $0.12 April 29, 2021
Resources Inc.
PR Content FRC Opinion
Released additional results from a drill Positive - This bodes well for resource
program at Parbec. expansion. We are expecting an updated
➢ 1.71 g/t gold over 1.25m resource estimate in June/July.
➢ 1.23 g/t over 0.65m
➢ 1.27 g/t over 2.8m
➢ 3.89 g/t over 1.75m
➢ 1.54 g/t over 3.45m
©2021 Fundamental Research Corp. “17+ Years of Bringing Undiscovered Investment Opportunities to the Forefront”
Click here to view FRC’s complete list of top picks
PLEASE READ THE IMPORTANT DISCLOSURES AT THE BACK OF THIS REPORTPage 12
Company Ticker Current Share FRC Fair Value Date of PR:
Name: Symbol Price: Estimate:
Arizona Gold TSX: AZG $0.13 $0.48 April 27, 2021
Corp.
PR Content FRC Opinion
Announced additional drill results from an Positive – These high-grade results are
underground drill program at the 100% highly encouraging. The program continues
owned Copperstone gold project: to demonstrate continuity, and extension of
multiple zones. An updated resource is
• 10.8 m at 8.2 g/t Au, including 0.7 m at expected in Q2-2021. We are expecting a
49.1 g/t Au significant increase in both tonnage and
• 2.3 m at 10.6 g/t, including 0.8 m at ounces. AZG is preparing to commence
19.0 g/t production in Q4.
Company Ticker Current Share FRC Fair Value Date of PR:
Name: Symbol Price: Estimate:
Hannan TSXV: HAN $0.42 $0.57 April 28, 2021
Mentals Ltd.
PR Content FRC Opinion
JV partner, Japan Oil, Gas and Metals Positive – This is a vote of confidence from
National Corporation (JOGMEC) has JOGMEC on San Martin. JOGMEC can
confirmed that it will fund US$2M on the earn up to a 75% interest by spending up to
San Martin project (Peru) in the next 12 US$35M on a feasibility study. Our fair
months. value estimate does not account for any
upside from Hannan’s Peruvian assets, as
they are in early stages.
Company Ticker Current Share FRC Fair Value Date of PR:
Name: Symbol Price: Estimate:
Colibri TSXV: CBI $0.14 $0.17 April 27, 2021
Resources April 29, 2021
Corporation
PR Content FRC Opinion
Entered into a definitive deal with Silver Positive – Bringing in an option partner
Spruce Resources (TSXV: SSE), wherein allows CBI to focus on its flagship asset.
SSV will have an option to earn up to Diamante is an early-stage precious metal
50% of the Diamante gold-silver project. property located close to CBI’s El Mezquite
and Jackie projects in Sonora, Mexico.
©2021 Fundamental Research Corp. “17+ Years of Bringing Undiscovered Investment Opportunities to the Forefront”
Click here to view FRC’s complete list of top picks
PLEASE READ THE IMPORTANT DISCLOSURES AT THE BACK OF THIS REPORTPage 13
Company Ticker Current Share FRC Fair Value Date of PR:
Name: Symbol Price: Estimate:
Lomiko Metals TSXV: LMR $0.155 $0.27 April 27, 2021
Inc.
PR Content FRC Opinion
Entered into an option agreement with Positive – Bourier (Quebec) is a relatively
Critical Elements Lithium (TSXV: CRE), untested project, covering over 10,250 ha,
wherein LMR will have an option to prospective for lithium. This move offers
acquire up to a 70% interest in the LMR exposure to lithium. LMR is currently
Bourier project for 7.5M shares, $3.3M in working on an updated resource estimate
exploration expenses, and by completing on the La Loutre graphite project.
a NI 43-101 compliant resource.
Company Ticker Current Share FRC Fair Value Date of PR:
Name: Symbol Price: Estimate:
GR Silver TSXV: GRSL $0.62 $0.98 April 27,
Mining Ltd. 2021
May 3, 2021
PR Content FRC Opinion
Released additional results from the Positive – These results bode well for the
Plomosas silver project in Sinaloa: upcoming maiden resource estimates on
Plomosas and San Juan (expected in Q2).
• 2.0 m @ 954 g/t Ag, 1.3 g/t Au, 1.2 % Note that our fair value estimate is solely
Pb and 1.6 % Zn, including 1.0 m @ based on GRSL’s San Marcial silver project,
1,184 g/t Ag, 2.3 g/t Au, 1.3 % Pb and which has an indicated resource of 36 Moz,
0.9 % Zn and an inferred resource of 11 Moz. GRSL
• 1.1 m @ 781 g/t Ag, 0.2 g/t Au, 1.5 % is well funded via a recently completed
Pb and 0.3 % Zn $11.5M bought deal financing.
• 22.3 m @ 62 g/t Ag, 0.3 g/t Au, 0.6 %
Pb and 0.4 % Zn
©2021 Fundamental Research Corp. “17+ Years of Bringing Undiscovered Investment Opportunities to the Forefront”
Click here to view FRC’s complete list of top picks
PLEASE READ THE IMPORTANT DISCLOSURES AT THE BACK OF THIS REPORTPage 14
Company Ticker Current Share FRC Fair Value Date of PR:
Name: Symbol Price: Estimate:
Southern Silver TSXV: SSV $0.53 $1.06 April 27, 2021
Exploration
Corp
PR Content FRC Opinion
Additional results from an ongoing drill Positive - These results indicate higher
program on the Cerro Las Minitas project, chances for resource expansion. Note that
Durango, Mexico: the project already has a resource estimate
of 134 Moz AgEq indicated, and 138 Moz
• 8.6 metre averaging 261g/t Ag, 0.1g/t inferred. Our fair value estimate is
Au,7.0% Pb and 1.7% Zn, including a conservative as it does not account for any
5.1 metre averaging 324g/t Ag, 0.2g/t resource upside.
Au, 8.8% Pb and 2.4% Zn
• 7.1 metre averaging 161g/t Ag, 0.2g/t
Au, 3.1% Pb and 0.4% Zn
• 4.2 metre averaging 335g/t Ag, 0.2g/t
Au, 0.3% Cu, 5.3% Pb and 2.4% Zn,
including 1.4 metre averaging 636g/t
Ag, 0.4g/t Au, 0.5% Cu, 10.5% Pb and
2.8% Zn
Company Ticker Current Share FRC Fair Value Date of PR:
Name: Symbol Price: Estimate:
White Rock ASX: WRM A$0.44 A$6.00 May 3, 2021
Minerals Ltd
PR Content FRC Opinion
Entered into a definitive agreement with Positive – As WRM is fully focused on its
Thomson Resources Ltd (ASX: TMZ), assets in Alaska, we were pleased to see
wherein TMZ can earn up to 70% of this initiative to simultaneously advance Mt.
White Rock’s Mt Carrington gold-silver Carrington. Mt. Carrington has a resource
project (Australia). estimate of 341 Koz gold and 23.25 Moz
silver, and a completed PFS. WRM is
planning an aggressive 2021 exploration
program in Alaska, including 10,000 m of
drilling.
©2021 Fundamental Research Corp. “17+ Years of Bringing Undiscovered Investment Opportunities to the Forefront”
Click here to view FRC’s complete list of top picks
PLEASE READ THE IMPORTANT DISCLOSURES AT THE BACK OF THIS REPORTPage 15
Technology, Energy, and Special Situations
Company Ticker Current Share FRC Fair Value Date of PR:
Name: Symbol Price: Estimate:
Kontrol CSE: KNR $2.35 $6.78 April 28 & 29,
Technologies 2021
Corp.
PR Content FRC Opinion
Released its year-end financial results, Positive – We were pleased to see the
with $4.3M in revenue in Q4 (ended company beating our revenue estimate for
December 31, 2020), up 43% QoQ, and the year by 3%. On the earnings call,
16% YoY. Revenue for the year was management stated that the company is
$12.3M, down 15% YoY. working to bring a financing solution to
reduce the upfront cash outlay for its
potential customers. We will release an
update report on the latest financial results
shortly.
Cannabis
Company Ticker Current Share FRC Fair Value Date of PR:
Name: Symbol Price: Estimate:
Pure Extracts CSE: PULL $0.35 $0.90 April 28 & May
Technologies 3, 2021
Corp.
PR Content FRC Opinion
Provided a corporate update and stated Positive – We were pleased that the
that its gummy (launched in April) company's product is getting traction; we
product line is being well-received by look forward to getting more details about
customers (sales figures were sales. The tolling agreement indicates its
not disclosed). PULL also announced the extraction business is also getting
signing of a tolling agreement for 500 recognition by other players in the industry.
kg of CBD hemp biomass. We are maintaining our revenue estimates
of $1.99M in 2021, and $7.8M in 2022.
©2021 Fundamental Research Corp. “17+ Years of Bringing Undiscovered Investment Opportunities to the Forefront”
Click here to view FRC’s complete list of top picks
PLEASE READ THE IMPORTANT DISCLOSURES AT THE BACK OF THIS REPORTPage 16
Weekly Cannabis Commentary
Cannabis Industry Performance
April 30, 2021
U.S. Companies YTD 1-Week 1-Year
Curaleaf Holdings Inc. 15% 6% 199%
Trulieve Cannabis Corp. 28% 8% 300%
Green Thumb Industries Inc. 31% 14% 345%
Cresco Labs Inc. 30% 7% 228%
Canadian Companies YTD 1-Week 1-Year
Aphria Inc. 112% 7% 282%
Aurora Cannabis Inc. 2% 5% -11%
Canopy Growth Corp. 5% -3% 49%
Cronos Group Inc. 14% -3% 22%
Tilray Inc. 118% 7% 128%
HEXO Corp. 75% 15% 198%
Organigram Holdings Inc. 92% -2% 50%
The Supreme Cannabis Co., Inc. 124% -3% 32%
Canadian Average 68% 3% 94%
U.S. Average 26% 9% 268%
Canadian MIN 2% -3% -11%
U.S. MIN 15% 6% 199%
Canadian MAX 124% 15% 282%
U.S. MAX 31% 14% 345%
Indices
Canadian YTD 1-Week 1-Year
HMMJ 32% 0% 68%
MCAN 28% -3% 70%
XCAN 28% -17% 65%
U.S. YTD 1-Week 1-Year
MSOS 16% 7% N/A*
*Launched on September 1, 2020 *Launched on September 1, 2020
Source: FRC
Over the past week, a previously announced deal between Tilray (NASDAQ:
TLRY) and Aphria (TSX: APHA) was completed. Green Thumb Industries (OTCQX:
GTBIF) announced an acquisition to enter the Virginia market, following the
state's legalization of recreational marijuana last month. This week, we are expecting
downward pressure on the stock prices of Canadian cannabis companies, as
©2021 Fundamental Research Corp. “17+ Years of Bringing Undiscovered Investment Opportunities to the Forefront”
Click here to view FRC’s complete list of top picks
PLEASE READ THE IMPORTANT DISCLOSURES AT THE BACK OF THIS REPORTPage 17
Statistics Canada reported a MoM cannabis sales decline in February last week. Sales
had declined MoM in January as well. The consecutive MoM declining trend is
concerning, but we believe it could be due to seasonality, as the sector had a similar
decline in 2019.
November – February Cannabis Sales in Canada (2018-2021)
Source: Statistics Canada, FRC
We anticipate that a significant increase in short positions in Canadian cannabis
stocks will also likely push prices down this week. According to Bloomberg, short
positions in the Canadian cannabis sector rose from $346M to $3.14B, in the 30 days
ended April 29, 2021.
Valuation
As of April 30, 2021, the Canadian big four LPs are trading at a 78% premium
(down from 97% in previous week) over their U.S. peers.
©2021 Fundamental Research Corp. “17+ Years of Bringing Undiscovered Investment Opportunities to the Forefront”
Click here to view FRC’s complete list of top picks
PLEASE READ THE IMPORTANT DISCLOSURES AT THE BACK OF THIS REPORTPage 18
April 23, 2021 April 30, 2021
Canadian Companies Ticker TEV/Revenue TEV/EBITDA TEV/Revenue TEV/EBITDA
Aphria Inc. TSX: APHA 10.3 NM 11.0 NM
Aurora Cannabis Inc. TSX: ACB 7.6 NM 7.9 NM
Canopy Growth Corp. TSX: WEED 24.5 NM 23.7 NM
Cronos Group Inc. TSX: CRON 51.7 NM 49.9 NM
Tilray Inc. NASDAQ: TLRY 16.0 NM 17.2 NM
HEXO Corp. NYSE: HEXO 7.4 NM 8.7 NM
Organigram Holdings Inc. TSX: OGI 13.4 NM 13.3 NM
The Supreme Cannabis Co., Inc. TSX: FIRE 6.2 NM 6.1 NM
AVERAGE 17.2 NM 17.2 NM
MEDIAN 11.9 NM 12.1 NM
MINIMUM 6.2 NM 6.1 NM
MAXIMUM 51.7 NM 49.9 NM
U.S. Companies Ticker TEV/Revenue TEV/EBITDA TEV/Revenue TEV/EBITDA
Curaleaf Holdings Inc. OTC: CURLF 14.8 56.1 15.7 59.9
Trulieve Cannabis Corp. OTC TCNNF 9.3 19.55 10.1 21.28
Green Thumb Industries Inc. OTC: GTBIF 11.3 39.8 12.9 45.2
Cresco Labs Inc. OTC: CRLBF 8.7 34.86 9.6 38.35
AVERAGE 11.0 37.6 12.1 41.2
MEDIAN 10.3 37.3 11.5 41.8
MINIMUM 8.7 19.6 9.6 21.3
MAXIMUM 14.8 56.1 15.7 59.9
Canadian Big Four Average 25.6 25.4
WEED, APHA, TLRY, CRON Median 20.3 20.4
Implied Premium Over U.S. Big Four (Median) 97% 78%
Source: S&P Capital IQ, FRC
The following chart shows the average EV/R of the companies we track in both sectors:
Average EV/R (October 2019 – April 2021)
Source: S&P Capital IQ, FRC
©2021 Fundamental Research Corp. “17+ Years of Bringing Undiscovered Investment Opportunities to the Forefront”
Click here to view FRC’s complete list of top picks
PLEASE READ THE IMPORTANT DISCLOSURES AT THE BACK OF THIS REPORTPage 19
Canadian Retail Cannabis Pricing
Province (As of 2021/05/03) Average Price per Gram Average Price per Gram THC Average Price per Gram CBD # of Products Min. Price Max. Price
B.C. $ 9.78 $ 9.87 $ 8.42 220 $ 3.53 $ 15.71
Ontario $ 9.61 $ 9.80 $ 7.93 356 $ 3.66 $ 22.66
Quebec $ 9.38 $ 9.38 $ 9.44 250 $ 4.85 $ 21.68
Alberta $ 11.01 $ 11.01 $ 10.82 375 $ 3.52 $ 22.00
N.B. $ 9.49 $ 9.66 $ 7.49 216 $ 3.57 $ 16.28
P.E.I. $ 9.65 $ 9.67 $ 9.34 170 $ 2.20 $ 23.30
Newfoundland $ 10.02 $ 9.96 $ 10.36 161 $ 4.46 $ 15.40
Yukon $ 16.33 $ 16.92 $ 13.95 5 $ 13.68 $ 22.28
N.S. $ 10.17 $ 10.22 $ 9.66 193 $ 5.36 $ 42.85
Nunavut $ 13.15 $ 13.35 $ 12.41 32 $ 9.43 $ 17.91
Northwest Territories $ 14.68 $ 14.68 2 $ 12.08 $ 17.28
Manitoba $ 11.44 $ 11.37 $ 11.55 357 $ 4.87 $ 23.57
Saskatchewan $ 12.09 $ 12.09 $ 12.07 244 4.40 38.50
CANADA $ 11.29 $ 11.38 $ 10.29
Province (As of 2021/4/26) Average Price per Gram Average Price per Gram THC Average Price per Gram CBD # of Products Min. Price Max. Price
B.C. $ 9.78 $ 9.86 $ 8.42 219 $ 3.53 $ 15.71
Ontario $ 9.62 $ 9.81 $ 7.93 358 $ 3.66 $ 22.66
Quebec $ 9.39 $ 9.39 $ 9.44 246 $ 4.85 $ 21.68
Alberta $ 11.04 $ 11.05 $ 10.82 371 $ 3.52 $ 22.00
N.B. $ 9.56 $ 9.74 $ 7.49 209 $ 3.57 $ 16.28
P.E.I. $ 9.65 $ 9.67 $ 9.34 170 $ 2.20 $ 23.30
Newfoundland $ 10.02 $ 9.96 $ 10.36 161 $ 4.46 $ 15.40
Yukon $ 16.01 $ 16.42 $ 13.95 6 $ 13.68 $ 22.28
N.S. $ 10.15 $ 10.20 $ 9.64 189 $ 5.36 $ 42.85
Nunavut $ 13.15 $ 13.35 $ 12.41 32 $ 9.43 $ 17.91
Northwest Territories $ 14.68 $ 14.68 2 $ 12.08 $ 17.28
Manitoba $ 11.45 $ 11.38 $ 11.55 360 $ 4.87 $ 23.57
Saskatchewan $ 12.09 $ 12.09 $ 12.07 244 4.40 38.50
CANADA $ 11.28 $ 11.35 $ 10.28
Source: Online Provincial Cannabis Stores, FRC
The average retail price per gram increased week-over-week, from $11.28 to
$11.29. The chart below shows Canadian retail dried cannabis flower pricing since we
initiated price coverage.
Canadian Retail Dried Cannabis Flower Pricing
Source: Online Provincial Cannabis Stores, FRC
Canadian Retail Cannabis Stores
As of May 3, 2021, there are 1,949 retail cannabis stores, a week-over-week increase of
58 stores across Canada, with 40 in Ontario.
©2021 Fundamental Research Corp. “17+ Years of Bringing Undiscovered Investment Opportunities to the Forefront”
Click here to view FRC’s complete list of top picks
PLEASE READ THE IMPORTANT DISCLOSURES AT THE BACK OF THIS REPORTPage 20
Nationwide Store Count
April-12-2021 April-19-2021 April-26-2021 May-3-2021
Geographic Region Store Count Store Count Store Count Store Count Population Population / Store
Alberta 602 611 616 618 4,428,247 7,165
B.C. 330 331 331 333 5,120,184 15,376
Manitoba 73 73 73 80 1,379,121 17,239
N.B. 20 20 20 20 780,890 39,045
N.S. 24 24 24 25 978,274 39,131
Newfoundland 30 30 30 30 520,437 17,348
Northwest Territories 6 6 6 6 44,982 7,497
Nunavut N/A N/A N/A N/A 39,486 N/A
Ontario 600 622 652 692 14,745,040 21,308
P.E.I. 4 4 4 4 158,717 39,679
Quebec 67 68 68 68 8,552,362 125,770
Saskatchewan 69 62 62 68 1,181,987 17,382
Yukon 5 5 5 5 41,293 8,259
CANADA 1,830 1,856 1,891 1,949 37,971,020 19,482
Source: Provincial Websites, FRC
©2021 Fundamental Research Corp. “17+ Years of Bringing Undiscovered Investment Opportunities to the Forefront”
Click here to view FRC’s complete list of top picks
PLEASE READ THE IMPORTANT DISCLOSURES AT THE BACK OF THIS REPORTPage 21
Weekly Psychedelic Commentary
Psychedelic Industry Performance
April 30, 2021
Company YTD 1-Week 1-Year
COMPASS Pathways plc -27% -1% N/A
Numinus Wellness Inc. -5% -10% N/A
Mind Medicine Inc. 27% -19% N/A
Seelos Therapeutics Inc. 290% -5% 758%
AVERAGE 71% -9% 758%
MIN -27% -19% 758%
MAX 290% -1% 758%
Index YTD 1-Week 1-Year
PSYK -1% -6% N/A*
*Launched on January 27, 2021 *Launched on January 27, 2021
Source: TMX Money, FRC
Over the past week, PSYK was down 6%.
Disclaimers and Disclosure
©2021 Fundamental Research Corp. “17+ Years of Bringing Undiscovered Investment Opportunities to the Forefront”
Click here to view FRC’s complete list of top picks
PLEASE READ THE IMPORTANT DISCLOSURES AT THE BACK OF THIS REPORTPage 22
The opinions expressed in this report are the true opinions of the analyst(s) about any companies and industries mentioned. Any
“forward looking statements” are our best estimates and opinions based upon information that is publicly available and that we
believe to be correct, but we have not independently verified with respect to truth or correctness. There is no guarantee that our
forecasts will materialize. Actual results will likely vary. Certain companies mentioned in pages 2, and 10-15 are covered by FRC
under an issuer paid model. FRC or companies with related management, and Analysts, may hold shares in some companies
mentioned in this report including Barrick. Distribution procedure: our reports are distributed first to our web-based subscribers on
the date shown on this report then made available to delayed access users through various other channels for a limited time.
To subscribe for real-time access to research, visit https://www.researchfrc.com/website/subscribe for subscription options.
This report contains "forward looking" statements. Forward-looking statements regarding the Company, industry, and/or stock’s
performance inherently involve risks and uncertainties that could cause actual results to differ from such forward-looking statements.
Factors that would cause or contribute to such differences include, but are not limited to, continued acceptance of the Company's
products/services in the marketplace; acceptance in the marketplace of the Company's new product lines/services; competitive
factors; new product/service introductions by others; technological changes; dependence on suppliers; systematic market risks and
other risks discussed in the Company's periodic report filings, including interim reports, annual reports, and annual information forms
filed with the various securities regulators. By making these forward-looking statements, Fundamental Research Corp. and the
analyst/author of this report undertakes no obligation to update these statements for revisions or changes after the date of this
report.
Fundamental Research Corp DOES NOT MAKE ANY WARRANTIES, EXPRESSED OR IMPLIED, AS TO RESULTS TO BE
OBTAINED FROM USING THIS INFORMATION AND MAKES NO EXPRESS OR IMPLIED WARRANTIES OR FITNESS FOR A
PARTICULAR USE. ANYONE USING THIS REPORT ASSUMES FULL RESPONSIBILITY FOR WHATEVER RESULTS THEY
OBTAIN FROM WHATEVER USE THE INFORMATION WAS PUT TO. ALWAYS TALK TO YOUR FINANCIAL ADVISOR BEFORE
YOU INVEST. WHETHER A STOCK SHOULD BE INCLUDED IN A PORTFOLIO DEPENDS ON ONE’S RISK TOLERANCE,
OBJECTIVES, SITUATION, RETURN ON OTHER ASSETS, ETC. ONLY YOUR INVESTMENT ADVISOR WHO KNOWS YOUR
UNIQUE CIRCUMSTANCES CAN MAKE A PROPER RECOMMENDATION AS TO THE MERIT OF ANY PARTICULAR
SECURITY FOR INCLUSION IN YOUR PORTFOLIO. This REPORT is solely for informative purposes and is not a solicitation or an
offer to buy or sell any security. It is not intended as being a complete description of the company, industry, securities or
developments referred to in the material. Any forecasts contained in this report were independently prepared unless otherwise
stated, and HAVE NOT BEEN endorsed by the Management of the company which is the subject of this report. Additional
information is available upon request. THIS REPORT IS COPYRIGHT. YOU MAY NOT REDISTRIBUTE THIS REPORT WITHOUT
OUR PERMISSION. Please give proper credit, including citing Fundamental Research Corp and/or the analyst, when quoting
information from this report. The information contained in this report is intended to be viewed only in jurisdictions where it may be
legally viewed and is not intended for use by any person or entity in any jurisdiction where such use would be contrary to local
regulations or which would require any registration requirement within such jurisdiction.
©2021 Fundamental Research Corp. “17+ Years of Bringing Undiscovered Investment Opportunities to the Forefront”
Click here to view FRC’s complete list of top picks
PLEASE READ THE IMPORTANT DISCLOSURES AT THE BACK OF THIS REPORTYou can also read