My Voice National Student Report 2014 - Grades 6-12 A QISA Aspirations Research Center Study
←
→
Page content transcription
If your browser does not render page correctly, please read the page content below

My Voice
National
Student
Report
2014
Grades 6-12
A QISA Aspirations Research Center Study

       Quaglia
  Institute


  for
  Student
  Aspirations

My Voice National Student Report 2014

© 2014 Quaglia Institute for Student Aspirations
Aspirations Research Center

http://qisa.org
The Quaglia Institute for Student Aspirations (QISA) is an independent nonprofit organization
dedicated to studying, promoting, and putting into practice the conditions that foster student
aspirations in schools and learning communities around the world.

Acknowledgments

The My Voice National Student Report 2014 (Grades 6-12) was made possible through the
generous support of the Pearson Foundation.
The mission of My Voice, a Pearson Foundation initiative, is to help measure the perceptions of
everyone at school, elevate the impact of student voice and foster the changes that are vital for
students to realize academic, social and personal success.

qisa.org
My Voice National Student Report 2014
Contents
Executive Summary 2
My Voice National Student Report 2013 – 2014 (Grades 6-12) 5
Part I: Odds and Impact Analysis 6
Part II: 8 Conditions That Make a Difference™ 9
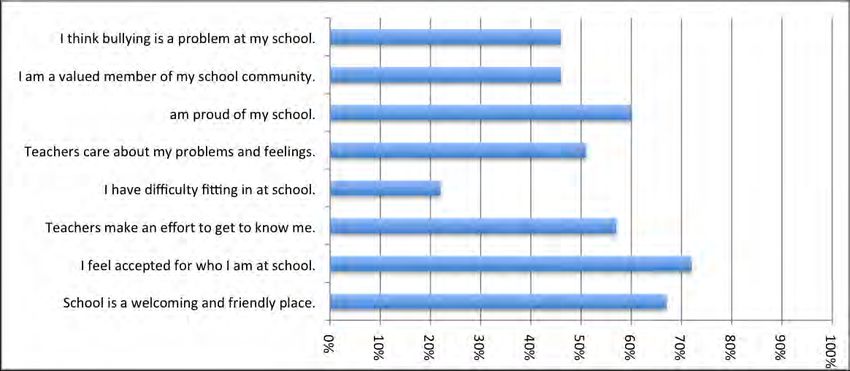
Condition 1: Belonging
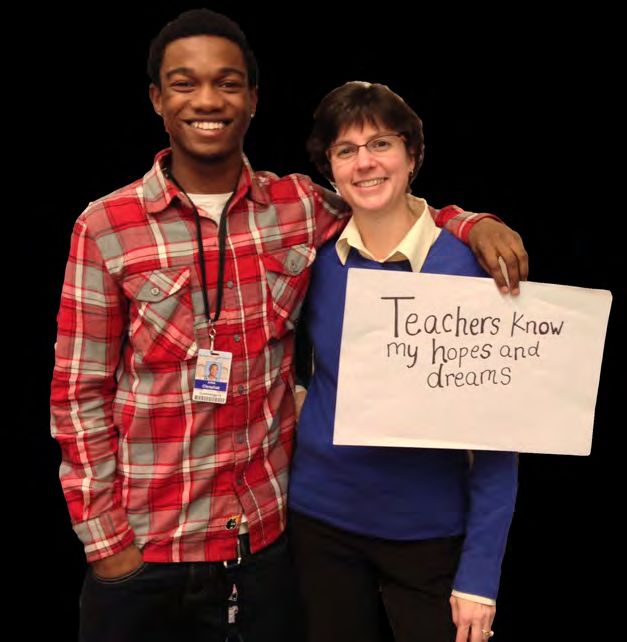
Condition 2: Heroes
Condition 3: Sense of Accomplishment
Condition 4: Fun & Excitement
Condition 5: Curiosity & Creativity
Condition 6: Spirit of Adventure
Condition 7: Leadership & Responsibility
Condition 8: Confidence to Take Action
Conclusion 15
Appendices:
A. Survey results by Condition 17
B. Odds Analysis Five Year Study 21
qisa.org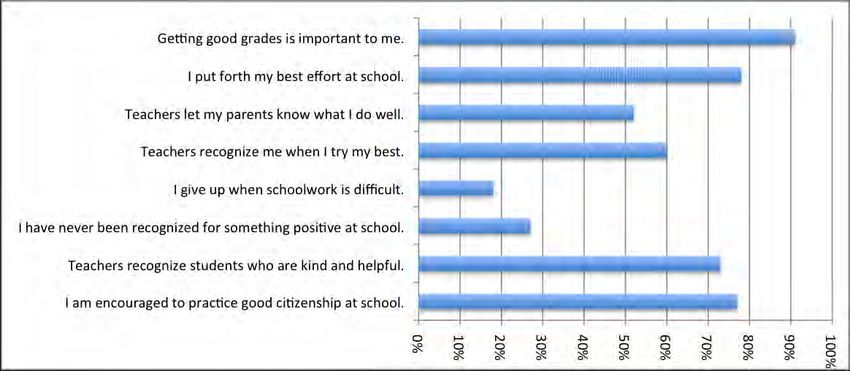
My Voice National Student Report 2014
EXECUTIVE SUMMARY
The underlying philosophy of the My Voice Survey and the Quaglia Institute for Student
Aspirations (QISA) is that students have something to teach us. The 2014 My Voice National
Student Report (Grades 6-12) reveals the voices of students from across the United States and
demonstrates the vital importance of listening to them.
Students who have aspirations have the ability to dream and set goals for the future while being
inspired in the present to reach those dreams. The presence of high aspirations is fostered by the
Quaglia Institute for Student Aspirations’ 3 Guiding Principles and the 8 Conditions that
operationalize those principles in a school environment:
Guiding
Principle
Associated
Conditions
Self-‐Worth
Belonging
Heroes
Sense
of
Accomplishment
Engagement
Fun
&
Excitement
Curiosity
&
Creativity
Spirit
of
Adventure
Purpose
Leadership
&
Responsibility
Confidence
to
Take
Action
These Conditions comprise an overarching framework that is critical for students’ success in
school. The My Voice Student Survey was developed to assess this framework.
For the present report, the My Voice Survey was completed by 66,314 students in grades 6-12,
during the 2013-2014 academic year, representing 234 schools from across the United States.
The gender breakdown is roughly even and the grade breakdowns show a steady decline from 7th
grade (18% or respondents) to 12th grade (10.5% of respondents). The sample was both racially
and socioeconomically diverse.
qisa.org 2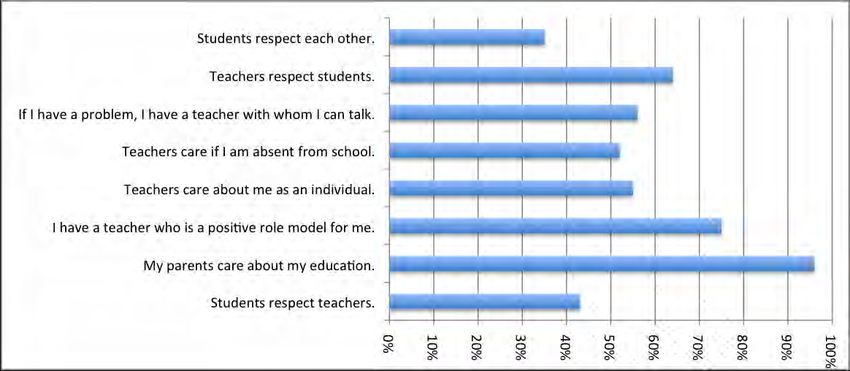
My Voice National Student Report 2014

Year Over Year
Previous My Voice National Reports have presented findings in light of the Aspirations
Framework outlined above. As last year's report indicated, a comparison of results by Condition
(found in Appendix A) to previous year's results by Condition reveals not much has changed in
our nation's schools--at least not in the eyes of students. The same is true of this year's report.
Prompted by this three-year constancy in the results, QISA conducted a further five-year analysis
of My Voice scales related to Self-Worth, Engagement, Purpose, Teacher Support, and Peer
Support (see Appendix B). Drawing on My Voice surveys in grades 6-12 for the past five
academic years, from students' point of view relatively little has changed in schools since 2009.
Educators must consider these results in light of the numerous initiatives (Common Core, P21,
new teacher evaluation systems, etc.) that have come into education during that same time.

Odds Analyses (Logistic Regression)
In order to better understand the significance and practical implications of the My Voice survey
data, the Quaglia Institute examined the data using a process called logistic regression analysis,
first employed in the 2012 – 2013 My Voice National Report, to assess and analyze data from
the 2013 – 2014 academic year. Logistic regression (sometimes referred to as “odds analysis”) is
a statistical tool used for predicting the outcome of a dependent variable, based on one or more
predictor (independent) variables. Logistic regression measures the strength of the relationship
between predictor variables and a single outcome variable.

For the purposes of this analysis, survey statements were grouped into five predictor variables
determined by statistical tests of scale reliability1 and aligned to the Aspirations Framework.
These predictor variables are Self Worth, Engagement, and Purpose; as well as Teacher Support
and Peer Support (which comprise many of the indicators associated with Belonging and
Heroes). The outcome variable used in this analysis is Academic Motivation. The purpose of
conducting the odds analysis is to determine to what degree each predictor variable influences
the outcome variable; that is, which of these predictor variables is most strongly related to
students’ perceptions of their own academic motivation. The result of these analyses is an "odds
ratio."

1
  Reliability tests allow for creation of scale variables based on the internal consistency of the items therein. That is, each predictor variable is made up of a
number of survey statements found to be strongly inter-correlated.

qisa.org                                                             3
My Voice National Student Report 2014

Odds Analyses: U.S. Students (Grades 6-12)
2013-14 My Voice Student Survey Data (controlling for race, gender, grade, and school)

       School Variables Affecting Student Academic Motivation

     Self-Worth                 5x

     Engagement 16x

     Purpose                    18x

     Teacher
                                8x
     Support
     Peer
     Support                    4x

Clearly, working on developing a sense of Purpose in school and helping students become more
engaged in school has a profound affect on their academic motivation. But even the "weaker"
effect sizes associated with Peer Support and Self-Worth will increase the likelihood that a
student is academically motivated four and five-fold respectively. There are, indeed, non-
academic means to academic ends.

qisa.org                                   4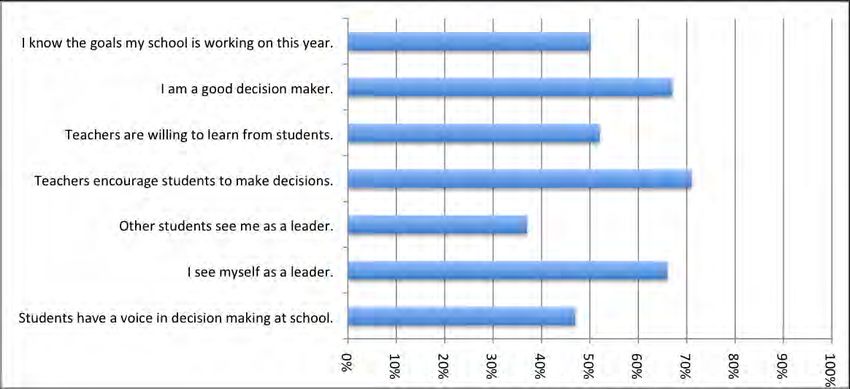
My Voice National Student Report 2014
MY VOICE 2013-2014
NATIONAL STUDENT REPORT
(GRADES 6-12)
The My Voice National Student Report (Grades 6-12) is organized around the 8 Conditions. In
each section, the Condition is defined and data on the survey statements about that Condition are
described.
The data are reported in percentages based on the combined number of students who responded
Strongly Agree or Agree to each statement. The results are then discussed in relation to key
aspects of the Condition.
Demographics
The My Voice Survey was completed by 66,314 students in grades 6-12 during the 2013-2014
academic year. Two hundred thirty-four schools, representing various sizes and socioeconomic
backgrounds, from nine states across the United States (Arizona, California, Indiana, Louisiana,
Massachusetts, Maine, Montana, Ohio, and Texas) were included. The gender breakdown was
roughly 50% male and 50% female. Grade level and race/ethnicity breakdowns were as follows:
Grade
of
Students
Racial
Heritage
of
Students
Grade
Count
Percent
6
10,667
16.1%
Racial
Heritage
Count
Percent
7
11,953
18.0%
White
Alone
39,176
59.1%
8
11,173
16.8%
Black/African-‐American
Alone
5,470
8.2%
9
9,494
14.3%
Hispanic/Latino
Alone
7,683
11.5%
10
8,390
12.7%
Asian
Alone
692
1.0%
11
7,400
11.2%
Native
Hawaiian
Alone
87
0.13%
12
6,972
10.5%
American
Indian
or
Alaska
Native
Alone
2,331
3.5%
Other
Pacific
Islander
Alone
164
0.25%
Gender
of
Students
Other
Race
Alone
1,699
2.6%
Gender
Count
Percent
Two
or
More
Races
8,649
13.0%
Male
33,118
49.9%
No
Race
Identified
363
.6%
Female
32,775
49.4%
qisa.org 5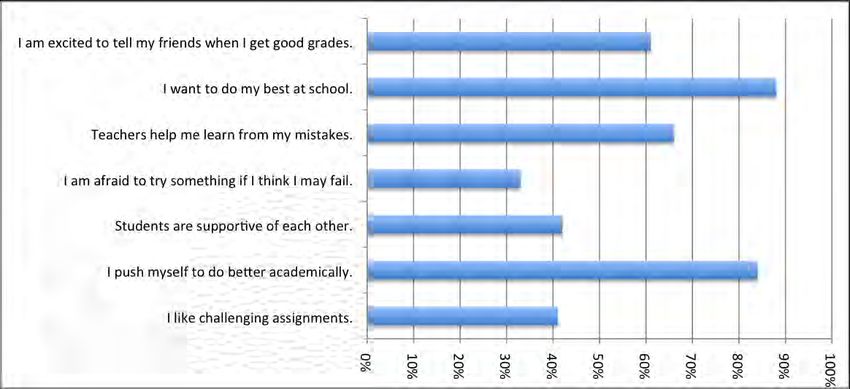
My Voice National Student Report 2014

PART I:
ODDS AND IMPACT ANALYSIS
In the following chart, the “Odds Ratio” reveals how likely it is that a predictor variable
positively impacts the outcome variable. For example, an odds ratio of sixteen (16) means that
students who agreed with the statements that make up that variable are 16 times more likely to be
academically motivated than those who did not agree with the statements. The following chart
depicts five school variables (self worth, engagement, purpose, teacher support, and peer
support). The indicators that comprise these scales are as follows:

Academic
  Motivation
  (outcome
  variable)

Getting good grades is important to me.               I push myself to do better academically.
I want to do my best at school.                       I put forth my best effort at school.


Self
  Worth

                                   Teacher
  Support

I feel accepted for who I am at school.               Teachers recognize students who are kind and helpful.
I have difficulty fitting in at school.*              Teachers recognize me when I try my best.
I am a valued member of my school                     Teachers let my parents/guardians know that I do well.
    community.                                        Teachers respect students.
Other students see me as a leader.                    Teachers help me learn from my mistakes.
I feel comfortable asking questions in class.         Teachers make an effort to get to know me.


                                               Teachers care about my problems and feelings.
Engagement

                                      Teachers believe in me and expect me to be successful.
School inspires me to learn.                          Teachers enjoy working with students.
I enjoy learning new things.                          Teachers make school an exciting place to learn.
I learn new things that are interesting               I have a teacher who is a positive role model for me.
    to me at school.                                  Teachers encourage students to make decisions.
I enjoy being at school.                              Teachers care about me as an individual.
Learning can be fun.                                  Teachers care if I am absent from school.
School is boring.*                                    If I have a problem, I have a teacher with whom I can talk.
My classes help me understand what is.
    going on in my everyday life.                     Peer
  Support
I enjoy participating in my classes.                  Students are supportive of each other.
                                                      Students respect each other.

Purpose

I am excited about my future.
I think it is important to set high goals.
School is preparing me well for my future.
What I learn in school will benefit my future.

* Indicates statements that are reverse-coded.


qisa.org                                                 6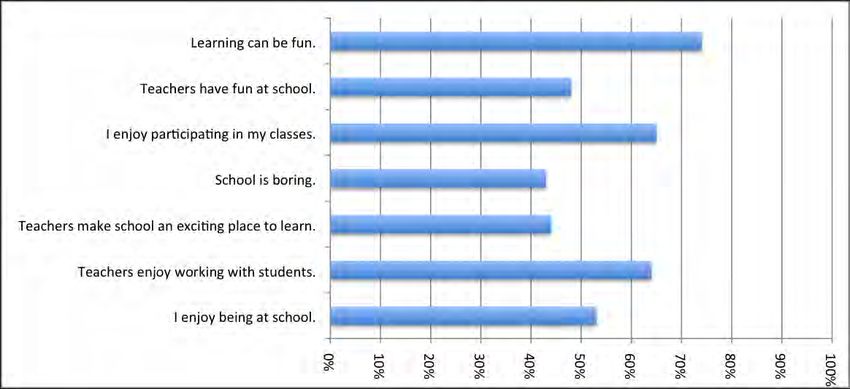
My Voice National Student Report 2014

Odds Analyses: U.S. Students (Grades 6-12)
2013-14 My Voice Student Survey Data (controlling for race, gender, grade, and school)

       School Variables Affecting Student Academic Motivation

     Self-Worth                  5x

     Engagement 16x

     Purpose                     18x

     Teacher
                                 8x
     Support
     Peer
     Support                     4x

Once an odds ratio was determined, we wanted to understand the relative impact of working to
improve students’ experiences of the predictor variables. Given that we know from the odds
analyses that students who experience Self-Worth, Engagement, etc. are more likely to be
academically motivated than those who do not have such experiences, we were able to assess the
relative impact of "converting" those students who currently do not have experiences of Self-
Worth, Engagement, etc. Thus, the “Impact Index” represents the combined strength of two data
points: the “odds” that a variable will impact academic motivation and the percentage of students
who do not agree with the statements that make up each variable.


The “Impact Index” represents the combined strength of two data points: the “odds” that a
variable will impact academic motivation, and the percentage of students who do not agree with
the statements that make up each variable.

qisa.org                                    7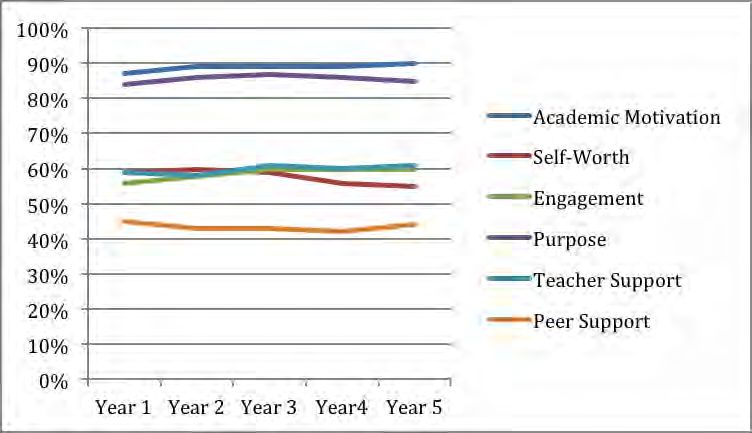
My Voice National Student Report 2014

For example, the high Impact Index of 6.4 indicates that Engagement is an important area on
which to concentrate, because (controlling for race, grade, gender and school) when students feel
engaged they are 16 times more likely to be academically motivated, and 40% of students do not
feel engaged. The purpose of this analysis of the national aggregate is to help us focus energy on
variables that could most significantly improve student academic motivation.

              School Variables Affecting Student Academic Motivation
                             and Their Relative Impact


       Scale
  (Predictor
  Variable)
   Odds
  Ratio
         Percent
  Disagree
             Impact
  Index


       Academic
  Motivation
              N/A
                  10%
                             N/A


       Self
  Worth
                       5
                    45%
                             2.3


       Engagement
                          16
                   40%
                             6.4


       Purpose
                             18
                   15%
                             2.7


       Teacher
  Support
                  8
                    39%
                             3.1


       Peer
  Support
                     4
                    56%
                             2.2


When controlling for grade, race, gender, and school, the highlights of the impact analysis for
each predictor variable on academic motivation are as follows:

● Clearly, working on Engagement in our nation's schools would improve students' academic
  motivation. Engaged students are 16 times more likely to report being academically
  motivated than students who are not engaged. Finding ways to engage the 40% of students
  who are not engaged would have a significant impact on their Academic Motivation.
● Students who report feeling supported by their teachers are 8 times more likely to be
  academically motivated than students who do not believe teachers are supportive. We hear
  this all the time in focus groups: Students work harder for teachers they believe care about
  them as a person, and will actually withhold their best effort from teachers they believe do not
  care.
● While the vast majority of students (85%) say they have a sense of Purpose, targeted

  interventions for those who do not have Purpose is likely to improve their Academic
  Motivation 18-fold!
● Those with Self-Worth are 5 times more likely to be academically motivated than those who
  do not report experiencing Self-Worth. Improving Self-Worth for the more than 4 out of 10
  students (45%) who are struggling in this area would go a long way to helping them become
  academically motivated.
● Even working on the least "impactful" measures in this analysis—Peer Support—is likely to
  quadruple the academic motivation of students who do not feel other students are supportive.

qisa.org                                                        8
My Voice National Student Report 2014
PART II:
8 CONDITIONS THAT MAKE
A DIFFERENCE
In its fieldwork, the Quaglia Institute for Student Aspirations operationalizes the 3 Guiding
Principles, analyzed above, through the 8 Conditions that Make a Difference™ in schools. The
highlights of the results for each Condition, as well as trends in the Conditions across grade
levels and gender differences, are as follows:
Condition 1: Belonging
The Condition of Belonging means that a student is a valued member of a community while still
maintaining his or her uniqueness. It is manifested in relationships between two or more persons
and is characterized by a sense of connection and support. A sense of Belonging is an important
Condition for a student’s feeling of well-being, social engagement, and competence. The
Condition of Belonging is likely to enhance intrinsic motivation, for it fosters self-confidence and
investment in the community.
qisa.org 9My Voice National Student Report 2014 Condition 2: Heroes Heroes are the everyday people—teachers, friends, family—in students’ lives who inspire them to excel and to make positive changes in attitude and lifestyles. Heroes are the people students can connect with, who have a positive influence on them, and who listen to and value their ideas. Heroes build trust in others and belief in oneself. Educators are, by definition, Heroes to their students who look up to teachers and school leaders as people to learn from and communicate with about many things. Building relationships with students through support, guidance, and encouragement enables them to become more confident in their academic, personal, and social growth. Condition 3: Sense of Accomplishment The Condition of Sense of Accomplishment recognizes effort, perseverance, and citizenship as signs of a student’s success. Educators have traditionally used a narrow view of accomplishment as it refers to academic achievement or innate ability. Sense of Accomplishment, however, is viewed in terms of personal growth and effort, not just through measurable outcomes and countable successes. Schools can celebrate their students’ accomplishments in visible ways. Taking time to recognize and support students’ efforts can help motivate them to persevere through difficult tasks, creating an appreciation for hard work and dedication. qisa.org 10
My Voice National Student Report 2014

Condition 4: Fun & Excitement

The Condition of Fun & Excitement is characterized by students being inspired. They are
actively engaged and emotionally involved in their schoolwork. Students who exhibit Fun &
Excitement are usually self-confident, curious, and prepared; they are willing to meet the
challenges of the day. To foster Fun & Excitement in schools, students need to be offered new
opportunities, as well as meaningful challenges, that are connected with their individual
interests. The first three Conditions—Belonging, Heroes, and Sense of Accomplishment— help
establish a learning environment in which students can feel safe to have fun together in learning.


Condition 5: Curiosity & Creativity


The Condition of Curiosity & Creativity is characterized by inquisitiveness, eagerness, a strong
desire to learn new or interesting things, and intellectual engagement in learning. Curiosity
triggers students to ask “Why?” while creativity gives them the initiative to ask “Why not?” The
intensity of Curiosity & Creativity tends to diminish over time due to the habituating effects of
the environment. To sustain student motivation, schools can devote extra attention to creating
learning environments that promote questioning and creative exploration.


qisa.org                                    11
My Voice National Student Report 2014

Condition 6: Spirit of Adventure
The Condition of Spirit of Adventure is characterized by a student’s ability to take on positive,
healthy challenges at school and home, with family and friends. Students experience a Spirit of
Adventure when they tackle something new without the fear of failure or success. When schools
promote healthy decision making and healthy risk taking, students can become more confident
and resilient. Students with the Spirit of Adventure see life as full of opportunities worth
exploring for their own sake.


Condition 7: Leadership & Responsibility
The Condition of Leadership & Responsibility means students are able to express their ideas and
are willing to accept the consequences of their actions. It cultivates accountability for the
classroom environment and school community. Fostering leadership empowers students to make
just and appropriate decisions and to take pride in their actions. Schools which promote this
Condition teach and expect their students to be good decision makers. They provide legitimate
decision-making opportunities, seek student input, and expect students to be accountable for
their actions and words. Students are trusted to make the right decisions and are recognized for
doing so.


qisa.org                                    12
My Voice National Student Report 2014

Condition 8: Confidence to Take Action
Confidence to Take Action is the extent to which students believe in themselves. It encourages
them to dream about their future while being motivated to set goals in the present. This
Condition is at the heart of what educators ultimately strive for: instilling in their students a
confidence in and expectation of success. Confidence to Take Action is characterized by a
positive and healthy outlook on life and by looking inward rather than outward for approval.
Schools can help build their students’ Confidence to Take Action by having high expectations of
students, providing support, and encouraging independent thinking. By enhancing the quality of
academic and personal growth, schools empower students to become active and involved
members of their learning community.


qisa.org                                    13
My Voice National Student Report 2014

Year Over Year Considerations

Our exploration of differences in levels of the 8 Conditions across grade levels found that
nearly one half of the statements on the My Voice Survey show practically significant
trends that reveal worsening of various aspects of each of the Conditions from the
beginning of middle school through, typically, the middle of high school.

Of the 63 statements on the My Voice Survey, 30 show practically significant trends across the
6th through 12th grade levels. Of these significant trends, only one suggests improvement in a
particular aspect of the school environment: perceptions that bullying is a problem in school
decrease from 54% agreement in sixth grade to 36% in 12th grade. To be sure, even the improved
12th grade level is unacceptably high. We interpret this trend to suggest that efforts to curtail
bullying remain vital at all grade levels, though of particular importance in the middle school
years.

Of the remaining 29 statements that show significant differences in levels of agreement by grade,
all but one are in the downward direction through the high school years; unfortunately, the one
practically significant change in upward movement is reflective of increasing disengagement: in
sixth grade, 30% of students report school to be boring, but by 10th grade, the percentage rises to
49%.
Many of the statements exhibiting negative trends are consistent with this theme of decreasing
engagement in school across the middle school and into the high school years. This highlights
the critical importance of Engagement as discussed in the analyses above. A particular area
worth focusing on is the fact that school is increasingly perceived as less relevant the longer a
student is in school; related to that theme, we also see that as students move up grade levels, they
ironically feel less confident that school is preparing them well for their futures. One would
hope this trend could be reversed so that the longer students are in school the more they see its
relevance in their everyday lives and perceive that it is preparing them for life after high school.
One other unfortunate theme emerges: from the beginning of middle school to the end of high
school students feel like they have less of a voice at school. In 6th grade, 63% of students believe
they have a voice in decision-making at school, but by 12th grade, that number declines sharply
to only 36%.
Despite somewhat lackluster news about students’ engagement in school, an encouraging trend,
observed in last year’s report and again this year, is that students’ perceptions of their
relationships with teachers – specifically, how well teachers make an effort to get to know them
and whether or not teachers enjoy working with students – seems to be improving from 9th and
10th grades to 11th and 12th. Though these upticks are not practically significant, they still
represent positive movement as students prepare to leave high school. For example, in 6th grade,
74% of students feel that their teachers make an effort to get to know them. By 10th grade, that
number decreases sharply to only 47%, but the percentage ticks up slightly in 12th grade to 53%.
Similarly, in 6th grade 75% of students feel that teachers enjoy working with them; in 10th grade

qisa.org                                     14
My Voice National Student Report 2014

that number drops to 57%, but by 12th grade, 64% of students agree that teachers enjoy working
with them.

In fact, of the 29 statements with which levels of agreement declined steadily from middle
through high school, an uptick of at least 3 percentage points was observed from 10th grade to
12th grade on 9 of those statements. Overall, the My Voice survey results from the 2013-2014
academic year show that early middle school students have higher rates of agreement with
survey statements than their high school counterparts, with 10th graders consistently reporting the
lowest levels of agreement overall.

Differences in levels of the 8 Conditions by gender found that differences
across the 8 Conditions were minimal and thus of little practical import.

Only five of the 63 My Voice Survey statements show practically significant differences
between males and females, and those differences are very slight, based on interpretation of the
results of practical significance testing. Given these minimal differences, we suggest that gender
should not be viewed as a particularly meaningful factor in how educators foster the 8
Conditions.

Conclusion
The 2014 My Voice National Student Report (Grades 6-12) reveals some findings for each of the
8 Conditions that Make a Difference to be encouraged by—and others that should signal calls to
action for positive change. While schools should take time to celebrate and learn from their
accomplishments, they must simultaneously commit to needed improvements. By listening to,
respecting, and responding to the voices of students, educators can create learning environments
that will allow students to reach their fullest potential.

The 8 Conditions that support student aspirations, engagement, and growth—Belonging, Heroes,
Sense of Accomplishment, Fun & Excitement, Curiosity & Creativity, Spirit of Adventure,
Leadership & Responsibility, and Confidence to Take Action—need to be in place if schools are
to foster students’ ability to set and reach their goals. Yet, as the lack of change in the past five
years attests and this year's survey findings corroborate, these Conditions continue to be
inadequately integrated into our nation’s schools. Unfortunately, these results suggest that not
enough has been done by schools to focus as much attention on fostering a positive learning
environment as a way of improving academic outcomes, as it has on assessing those outcomes.
Those working in schools know well that there are non-academic means to academic ends. Yet,
as a nation, we have focused our attention only on academic results and have paid far too little
attention to the personal, social, and environmental factors that our students tell us make a
significant contribution to their academic motivation.

Moreover, many of the most important indicators of the Conditions show downward trends from
early middle school into high school. Based on our findings in this report, as well as previous

qisa.org                                     15
My Voice National Student Report 2014

reports, along with our extensive work in schools across the country, we believe there is
evidence of an increasing reality that features of the inherited education model (such as grade-
specific instruction, academic tracking, teaching in the silos of the academic disciplines,
unidirectional knowledge transfer from teacher to student, time as a constant, etc.) may not
adequately suit or serve the current generation of learners. We believe students’ disaffection with
school may be less about particular schools, classes, or teachers, and more about the structural
underpinnings of an increasingly outdated educational system. At least this much is certain: If
schools are to be places in which teaching and learning thrive and all students are meaningfully
engaged, the realities of students’ experiences in school must change. Listening to students’
voices can and should help us to this end.

qisa.org                                    16
My Voice National Student Report 2014

           Appendix A: Table of Results for All My Voice Statements:

Belonging

                                                                                                 Gender
                                                         Grade

                Survey
  Statements
                                  Total


                                                                                            M
               F
             6
           7
          8
           9
       10
       11
      12

School
  is
  a
  welcoming
  and
  friendly

                                                                         67%
            69%
   66%
   77%
   69%
   64%
   65%
   62%
   63%
   68%

place.


I
  feel
  accepted
  for
  who
  I
  am
  at
  school.
        72%
            76%
   68%
   79%
   73%
   69%
   69%
   68%
   70%
   73%


Teachers
  make
  an
  effort
  to
  get
  to

                                                                         57%
            59%
   55%
   74%
   63%
   56%
   51%
   47%
   48%
   53%

know
  me.


I
  have
  difficulty
  fitting
  in
  at
  school.
              22%
            21%
   23%
   27%
   25%
   22%
   20%
   19%
   18%
   17%


Teachers
  care
  about
  my
  problems
  and

                                                                         51%
            50%
   51%
   68%
   57%
   50%
   43%
   41%
   42%
   44%

feelings.


  am
  proud
  of
  my
  school.
                                 60%
            60%
   61%
   75%
   66%
   57%
   59%
   53%
   52%
   54%


I
  am
  a
  valued
  member
  of
  my
  school

                                                                         46%
            47%
   45%
   57%
   50%
   45%
   40%
   39%
   40%
   44%

community.

I
  think
  bullying
  is
  a
  problem
  at
  my

                                                                         46%
            44%
   49%
   54%
   55%
   51%
   42%
   41%
   37%
   36%

school.


Heroes

                                                                                          Gender
                                                               Grade

               Survey
  Statements
                                 Total


                                                                                         M
          F
             6
               7
           8
           9
         10
       11
       12


Students
  respect
  teachers.
                                    43%
             46%
   41%
   58%
                         45%
         40%
         39%
        37%
      39%
      42%


My
  parents
  care
  about
  my
  education.
                  96%
             95%
   96%
   97%
                         97%
         96%
         96%
        94%
      94%
      93%


I
  have
  a
  teacher
  who
  is
  a
  positive
  role

                                                                      75%
             72%
   78%
   82%
                         75%
         72%
         70%
        73%
      75%
      80%

model
  for
  me.

Teachers
  care
  about
  me
  as
  an

                                                                      55%
             55%
   55%
   67%
                         59%
         54%
         48%
        48%
      50%
      55%

individual.

Teachers
  care
  if
  I
  am
  absent
  from

                                                                      52%
             52%
   52%
   63%
                         56%
         50%
         48%
        45%
      47%
      50%

school.

If
  I
  have
  a
  problem,
  I
  have
  a
  teacher

                                                                      56%
             55%
   58%
   66%
                         57%
         54%
         49%
        50%
      54%
      60%

with
  whom
  I
  can
  talk.


  Teachers
  respect
  students.
                                64%
             64%
   64%
   78%
                         69%
         63%
         60%
        55%
      56%
      57%


  Students
  respect
  each
  other.
                           35%
             38%
   31%
   44%
                         35%
         31%
         33%
        31%
      32%
      35%


qisa.org                                                                                   17
My Voice National Student Report 2014
Sense
of
Accomplishment
Gender
Grade
Survey
Statements
Total
M
F
6
7
8
9
10
11
12
I
am
encouraged
to
practice
good
77%
76%
79%
87%
83%
78%
74%
71%
70%
71%
citizenship
at
school.
Teachers
recognize
students
who
are
73%
73%
72%
82%
76%
72%
68%
67%
67%
70%
kind
and
helpful.
I
have
never
been
recognized
for
27%
27%
26%
28%
27%
26%
27%
26%
26%
25%
something
positive
at
school.
I
give
up
when
schoolwork
is
18%
18%
18%
14%
16%
17%
20%
21%
23%
20%
difficult.
Teachers
recognize
me
when
I
try
my
60%
60%
59%
71%
64%
59%
55%
53%
54%
56%
best.
Teachers
let
my
parents
know
what
I
52%
53%
51%
74%
62%
55%
45%
39%
37%
36%
do
well.
I
put
forth
my
best
effort
at
school.
78%
74%
82%
88%
83%
79%
75%
71%
69%
70%
Getting
good
grades
is
important
to
91%
88%
94%
96%
93%
92%
90%
88%
87%
86%
me.
Fun
&
Excitement
Gender
Grade
Survey
Statements
Total
M
F
6
7
8
9
10
11
12
I
enjoy
being
at
school.
53%
52%
55%
66%
57%
51%
52%
47%
47%
49%
Teachers
enjoy
working
with
64%
64%
64%
78%
68%
62%
59%
56%
58%
61%
students.
Teachers
make
school
an
exciting
44%
45%
43%
64%
50%
42%
36%
33%
34%
38%
place
to
learn.
School
is
boring.
43%
46%
40%
30%
38%
45%
46%
50%
51%
49%
I
enjoy
participating
in
my
classes.
65%
65%
65%
77%
70%
64%
60%
58%
60%
62%
Teachers
have
fun
at
school.
48%
49%
46%
60%
52%
46%
44%
40%
41%
44%
Learning
can
be
fun.
74%
72%
76%
79%
73%
72%
70%
72%
74%
77%
qisa.org 18My Voice National Student Report 2014
Curiosity
&
Creativity
Gender
Grade
Survey
Statements
Total
M
F
6
7
8
9
10
11
12
I
feel
comfortable
asking
questions
in
63%
66%
59%
67%
62%
61%
59%
60%
62%
67%
class.
My
teachers
present
lessons
in
76%
76%
76%
85%
81%
76%
73%
70%
70%
71%
different
ways.
At
school
I
am
encouraged
to
be
67%
65%
69%
80%
73%
67%
63%
59%
58%
60%
creative.
I
enjoy
working
on
projects
with
69%
71%
68%
79%
74%
73%
66%
63%
61%
61%
other
students.
My
classes
help
me
understand
what
is
44%
46%
43%
59%
52%
46%
40%
34%
34%
35%
happening
in
my
everyday
life.
School
inspires
me
to
learn.
64%
61%
66%
78%
69%
64%
60%
56%
56%
57%
I
enjoy
learning
new
things.
81%
80%
82%
85%
81%
79%
79%
80%
82%
85%
I
learn
new
things
that
are
72%
71%
73%
82%
76%
72%
69%
65%
67%
67%
interesting
to
me
at
school.
What
I
learn
in
school
will
benefit
my
77%
76%
78%
88%
84%
81%
75%
69%
67%
67%
future.
Spirit
of
Adventure
Gender
Grade
Survey
Statements
Total
M
F
6
7
8
9
10
11
12
I
like
challenging
assignments.
41%
40%
42%
49%
42%
38%
37%
36%
39%
46%
I
push
myself
to
do
better
84%
82%
87%
89%
88%
85%
83%
81%
80%
81%
academically.
Students
are
supportive
of
each
42%
43%
41%
52%
43%
39%
40%
37%
40%
43%
other.
I
am
afraid
to
try
something
if
I
think
33%
29%
37%
37%
36%
35%
34%
31%
31%
27%
I
may
fail.
Teachers
help
me
learn
from
my
66%
67%
65%
81%
74%
67%
61%
56%
56%
57%
mistakes.
I
want
to
do
my
best
at
school.
88%
85%
92%
94%
91%
90%
87%
85%
85%
84%
I
am
excited
to
tell
my
friends
when
I
get
61%
55%
66%
73%
66%
62%
55%
54%
53%
52%
good
grades.
qisa.org 19My Voice National Student Report 2014
Leadership
&
Responsibility
Gender
Grade
Survey
Statements
Total
M
F
6
7
8
9
10
11
12
Students
have
a
voice
in
decision
47%
47%
46%
63%
54%
46%
45%
38%
36%
36%
making
at
school.
I
see
myself
as
a
leader.
66%
66%
66%
70%
67%
66%
62%
62%
67%
70%
Other
students
see
me
as
a
leader.
37%
38%
36%
38%
36%
36%
33%
35%
38%
43%
Teachers
encourage
students
to
71%
71%
72%
79%
75%
73%
69%
66%
66%
66%
make
decisions.
Teachers
are
willing
to
learn
from
52%
53%
52%
67%
59%
52%
48%
44%
43%
45%
students.
I
am
a
good
decision
maker.
67%
68%
66%
69%
66%
65%
65%
67%
69%
71%
I
know
the
goals
my
school
is
50%
50%
50%
64%
57%
51%
45%
41%
39%
42%
working
on
this
year.
Confidence
to
Take
Action
Gender
Grade
Survey
Statements
Total
M
F
6
7
8
9
10
11
12
I
believe
I
can
be
successful.
93%
93%
93%
94%
94%
93%
92%
92%
93%
93%
I
believe
I
can
make
a
difference
in
71%
70%
72%
75%
72%
71%
68%
68%
71%
75%
this
world.
Teachers
believe
in
me
and
expect
76%
75%
76%
84%
78%
76%
72%
70%
71%
73%
me
to
be
successful.
Going
to
college
is
important
for
my
87%
84%
91%
91%
89%
89%
86%
84%
84%
84%
future.
I
work
hard
to
reach
my
goals.
85%
83%
88%
91%
88%
86%
83%
81%
81%
83%
I
am
excited
about
my
future.
85%
83%
87%
89%
86%
85%
83%
83%
83%
85%
I
think
it
is
important
to
set
high
85%
83%
87%
89%
86%
85%
83%
83%
83%
85%
goals.
I
know
the
kind
of
person
I
want
to
81%
80%
83%
84%
81%
81%
79%
80%
80%
83%
become.
School
is
preparing
me
well
for
my
69%
68%
71%
84%
77%
73%
67%
60%
56%
56%
future.
qisa.org 20My Voice National Student Report 2014
Appendix B: Table of Results of Year Over Year Comparison
of Students in Agreement with Scale Variables
Scale
Variable
Total
in
Year
1
Year
2
Year
3
Year4
Year
5
Agreement
Academic
Motivation
89%
87%
89%
89%
89%
90%
Self-‐Worth
58%
59%
60%
59%
56%
55%
Engagement
60%
56%
58%
60%
60%
60%
Purpose
86%
84%
86%
87%
86%
85%
Teacher
Support
60%
59%
58%
61%
60%
61%
Peer
Support
43%
45%
43%
43%
42%
44%
qisa.org 21You can also read