ISSUE 37/March 2020 - National Agricultural Marketing Council
←
→
Page content transcription
If your browser does not render page correctly, please read the page content below
ISSUE 37/March 2020

                      1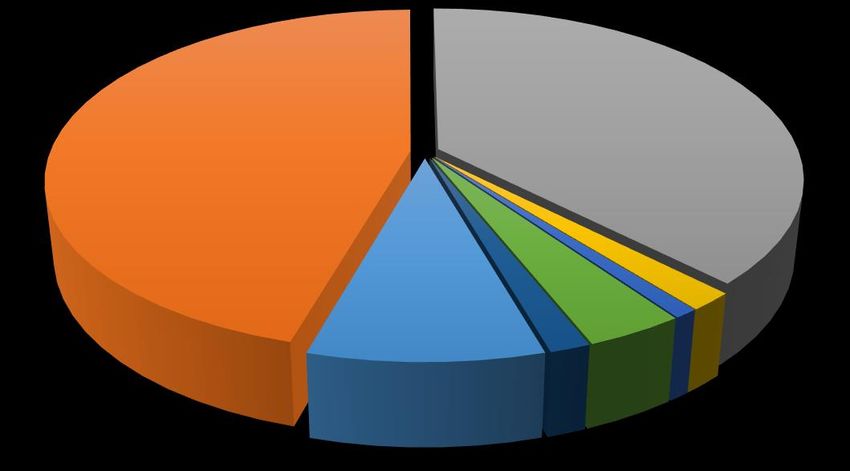
SOUTH AFRICAN FRUIT TRADE FLOW
                               Issue No. 37: March 2020

  Compiled by Lucius Phaleng, Onele Tshitiza, Zosuliwe Kala, Moses Lubinga
                           and Sifiso Ntombela

Table of Contents
1.   Background ..................................................................................3
2.     Overview of table grapes for the 2019/20 season ......................3
  2.1 Preview of global table grape production for the 2014/15 -
  2019/20 seasons.................................................................................3
  2.1.1 Global trade in table grapes for the 2014/15 - 2019/20
  seasons ..............................................................................................4
  2.2 Preview of South Africa’s table grape production season,
  2019/20 ................................................................................................6
3. Overview of stone fruits for the 2019/20 season ............................8
  3.1. Overview of stone fruit products passed for export for the
  2018/19-2019/20 seasons ...................................................................8
  3.2. South Africa’s trade in stone fruit ..............................................9
4. Fruit industry perspectives ............................................................ 16
  4.1. Table grape exports to China amidst the COVID-19 outbreak
  and the associated barriers to trade ............................................... 16
REFERENCES ..................................................................................... 20
USEFUL LINKS.................................................................................... 20

                                                                                                              2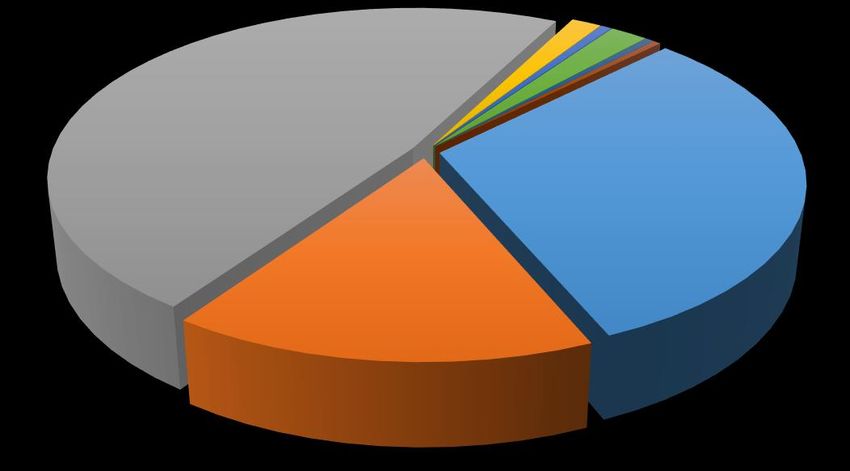
1. Background
South Africa’s diverse weather and climatic conditions enable the country to cultivate
and produce a variety of fruits. The country is known globally as a producer and
exporter of citrus, deciduous and subtropical fruits. This issue of the Fruit Trade
Flow Report looks at table grapes and stone fruit (plums, nectarines, peaches
and apricots). The main focus is on an analysis of the current season’s performance
of these fruits, for both the export and domestic markets, in comparison with the
previous seasons. This report further assesses the global production of these fruits,
giving a perspective on South Africa’s production and export rankings (as a share of
global production and exports).

2. Overview of table grapes for the 2019/20 season
This section focuses on the global preview of table grapes, including South Africa’s
production season.
2.1 Preview of global table grape production for the 2014/15 - 2019/20 seasons
Figure 1 depicts the leading producers of grapes in the world for the 2014/15 to
2019/20 seasons. It can be noted that China is the largest producer of grapes for all
the years under consideration in this report. In the 2019/20 season, China is expected
to produce 10.8 million tons of grapes – about a 9 % growth from last season – which
may be due to some of its producing regions having had a bumper crop. However, for
now, the actual effect of the coronavirus outbreak in China on grape production could
not be ascertained; therefore, the projected 9 % growth might or might not change. It
is also important to note that China consumes about 99 % of what it produces
domestically and also imports some grapes from the rest of the world. India is the
second-largest producer of grapes, producing 3 million tons in 2019/20, followed by
Turkey (1.95 million tons), Uzbekistan (1.63 million tons) and the European Union (EU)
(1.38 million tons). The EU has experienced unfavourable weather and lower demand
for grapes in countries such as Italy. The global production of grapes is expected to
increase because of larger production by China and Peru.

                                                                                         3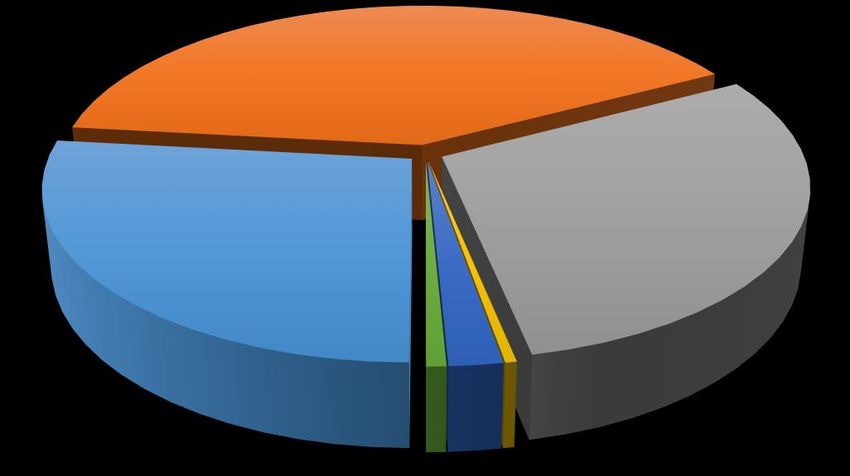
12000

                         10000
   Volume in 1000 Tons

                          8000

                          6000

                          4000

                          2000

                             0

                                 2014/15   2015/16   2016/17   2017/18   2018/19   2019/20*

Figure 1: Leading producers of grapes in the world, 2014/15-2019/20*

Source: USDA (2020)

2.1.1 Global trade in table grapes for the 2014/15 - 2019/20 seasons
Global exports of table grapes in the 2019/20 season are expected to increase
because of an increase in production in Peru and India. Figure 2 illustrates the world’s
leading exporters of grapes for the 2014/15 to 2019/20 seasons. The graph shows
Chile as the leading exporter in all the seasons, estimated to export 640 000 tons in
2019/20. Peru follows Chile in exports of grapes with an expected 400 000 tons in
2019/20, followed by the United States (US) (345 000 tons), China (320 000 tons) and
South Africa (285 000 tons). Exports from Chile are expected to decrease due to the
dry weather. At the same time, exports from India are also likely to be lower because
of heavy rains and diseases (Freshplaza, 2020).

                                                                                              4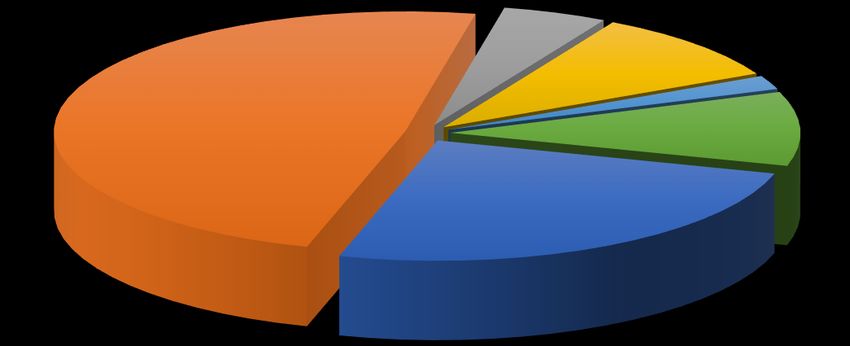
800

                         700
   Volume in 1000 Tons

                         600

                         500

                         400

                         300

                         200

                         100

                           0

                               2014/15   2015/16   2016/17   2017/18   2018/19   2019/20*

Figure 2: Leading exporters of grapes in the world, 2014/15-2019/20*
Source: USDA (2020)

The leading importers of grapes in the world are shown in Figure 3. The EU is the
largest importer of grapes, predicted to import 690 000 tons in 2019/20, followed by
the US (645 000 tons), Russia (280 000 tons), China (250 000 tons) and Hong Kong
(240 000 tons). Important to note is that imports to China may have decreased
because of the increase in production in that country.

                         800

                         700
   Volume in 1000 Tons

                         600

                         500

                         400

                         300

                         200

                         100

                           0

                               2014/15   2015/16   2016/17   2017/18   2018/19   2019/20*

Figure 3: World’s leading importers of grapes, 2014/15-2019/20*
Source: USDA (2020)

                                                                                            5
2.2 Preview of South Africa’s table grape production season, 2019/20
The crop estimates for grapes for the 2019/20 season are shown in Table 1. The
estimates show that this season’s harvest is going to be between 59.6 and 64.7 million
cartons, which is an average of 1 million cartons more than the 2018/19 season. The
increase in production is due to water availability in most of the production regions.
However, the recent estimate was lowered from the second crop estimate because of
the Hex River area, which had its crops affected by rains, decreasing the estimate by
2 million cartons (1 carton= 4.5 kg) (SATI, 2020).
Table 1: Crop estimates of grapes for the 2019/20 season in South Africa (in million 4.5 kg
cartons)
2nd
3rd ESTIMATE 1st
ESTIMATE (18 ESTIMATE
(31 January December (18 October
REGION 2020) 2019) 2019) ACTUAL PACKED VOLUMES
LOW HIGH LOW HIGH LOW HIGH 2018/2019 2017/2018 2016/2017
Northern
Provinces 5,8 6,0 5,65 6,30 7,15 7,80 7,121 6,829 5,538
Orange River 19,5 19,9 18,50 19,90 18,50 19,90 19,207 19,016 20,533
Olifants River 2,5 2,7 2,10 2,50 2,10 2,50 2,367 2,802 3,968
Berg River 14,0 15,8 13,50 15,30 13,50 15,30 13,789 13,053 15,426
Hex River 17,8 20,3 19,80 22,30 19,80 22,30 18,649 20,365 22,111
TOTAL 59,6 64,7 59,55 66,30 61,05 67,80 61,133 62,065 67,575
Source: SATI (2020)
South Africa's table grape industry is export oriented and exported R9.23 billion worth
of fresh and dried grapes in 2019. Figure 4 shows the countries to which South Africa
has exported thus far in week 12 of the 2019/20 season. South Africa exported a total
of 60 827 796 cartons (1 carton = 4.5 kg) in week 12, which is 7 % more than in the
same week of the 2018/19 season, and this may correspond to the production
estimates of the season. The largest exports were directed to the EU (49 %), followed
by the United Kingdom (UK) (25 %), South East Asia (9 %), the Middle East (5 %) and
Russia (2 %). At the same time, the remainder went to other regions. It is important to
note that the exports to Asia were lower by 35 %, compared to the total in the same
week of 2018/19. There were more exports to North America, Russia and Africa,
compared to last season.
6Middle East
5%
South East Asia
9%
Russia
European Union 2%
49% Others
10%
United Kingdom
25%
Figure 4: Importing regions for South Africa’s grapes (week 12 of 2019/20)
Source: Agrihub (2020)
The prices and volumes of grapes sold at the National Fresh Produce Markets
(NFPMs) between 2018 and 2020 are represented in Figure 5. Quantities sold at the
markets were the highest in February and March of 2019, with 4 393.5 tons (R11
185.32) and 4 376.2 tons (R11 897.60) supplied respectively. The quantity of grapes
supplied in January 2020 was higher than in January of other years, with 3 453.3 tons
already being supplied in the current season. The price of grapes in January 2020 was
R14 425.07 per ton, which was higher than the prices in both 2018 and 2019.
75000 35000
4500
30000
4000
3500 25000
Volume in Tons
Price in R/Ton
3000
20000
2500
15000
2000
1500 10000
1000
5000
500
0 0
JAN FEB MAR APR MAY JUN JUL AUG SEP OCT NOV DEC
2018 TONS 2019 TONS 2020 TONS
2018 R/TON 2019 R/TON 2020 R/TON
Figure 5: Price and quantity of grapes sold at the NFPMs (2018-2020)
Source: DAFF (2020)
3. Overview of stone fruits for the 2019/20 season
The following section provides an overview of the local market for stone fruit (plums,
nectarines, peaches and apricots), as well as export markets and the volumes sold
through the NFPMs.
3.1. Overview of stone fruit products passed for export for the 2018/19-2019/20
seasons
Table 2 highlights the various stone fruit cultivars passed for export during week 9 of
both the 2018/19 and 2019/20 seasons. The table shows the actual volumes achieved
and the estimates for the 2019/20 season. Plum cultivars passed for export in week 9
include African Delight, Angeleno and September Yummy, and the estimates for the
2019/20 season stand to increase, with the exception of Angeleno which is expected
to decrease by 44 %. Nectarine cultivars are estimated to increase by a share of 256 %
(Arctic Wolf) and 489 % (September Red), while Arctic Snow is estimated to increase
by 100 % from zero volume passed for export in 2018/19. In the case of peaches, the
Fairtime cultivar is estimated to decline by 15 % while PE04-27 and PEO 04/26 are
estimated to increase by 100 % and 115 % respectively. The highlighted apricot
cultivars are estimated to decline in the 2019/20 season because of drought in the
Little Karoo region, as well as the decline in area planted over the years (Hortgro,
2019).
8Table 2: Stone fruit cultivars passed for export (cartons)
Stone fruit cultivars passed for export (week 9)
Stone fruit Cultivars passed for 2018/2019 2019/2020 Eqv % Diff vs
export Eqv 2019/20
Plums African Delight 1 034 497 1 231 211 19 %
(1 carton = 5.25 Angeleno/Suplumsix 717 657 404 614 -44 %
kg)
September Yummy 31 288 92 448 195 %
Nectarines Arctic Wolf 51 652 184 027 256 %
(1 carton = 2.5 September Red 1 738 10 233 489 %
kg)
Arctic Snow 0 6 596 100 %
Peaches Fairtime 72 964 62 143 -15 %
(1 carton = 2.5 PE04-27 0 11 118 100 %
kg)
PEO 04/26 4 920 10 561 115 %
Apricots Faralia 9 904 6 764 -32 %
(1 carton = 4.75 Farely 4 251 1 858 -56 %
kg)
PAZ 2 712 713 -74 %
Source: Hortgro (2020)
3.2. South Africa’s trade in stone fruit
South Africa’s 2020 plum export season has started with uncertainty due to the new
COVID-19 outbreak. Most of South Africa’s plum exports are destined for the
European market, which is heavily affected by the virus. However, there are serious
concerns as to how the COVID-19 outbreak will affect international trade. Figure 6
highlights the total volume of South Africa’s plums (measured in 5.25 kg cartons)
passed for export and the corresponding markets in week 10 of 2020. Europe remains
South Africa’s main market for plums exported during the 2020 season. During week
10 of 2020, South Africa’s plum exports destined for Europe constituted a 50 % share
by volume – the equivalent of a 5 % growth rate as compared to last season. The UK
was the second-largest export market, accounting for 21 % of the share, followed by
the Middle East (19 %), Far East & Asia (5 %), Russian Federation (4 %), USA &
Canada, Africa and the Indian Ocean Islands (1 % each). South Africa has
experienced an enormous decline of a 28 % share in the Indian Ocean Islands
compared to the previous season. In contrast, the USA & Canada showed the highest
growth rate of 22 % of imports from South Africa in the current season.
94000000 60
Volume (5.25 kg cartons)
3500000
50
Percentage share (%)
3000000
40
2500000
2000000 30
1500000
20
1000000
10
500000
0 0
Export volumes Share %
Figure 6: South Africa’s markets for plums passed for export (5.25 kg-equivalent cartons)
Source: Hortgro (2020)
South Africa’s fresh produce markets are the only system of fresh produce commission
markets in the world. Figure 7 shows the volume of plums sold through the NFPMs,
as well as their market price trends, from January to December (2018 & 2019) and
January 2020. The total volume of plums sold through NFPMs between January and
December was 16 994 tons (2018) at an average price of R7 643 per ton, and 12 659
tons (2019), at an average price of R9 744 per ton. In the current season thus far,
about 34 tons were sold in January 2020 at a market price of R9 744 per ton. The
highest sales in the fresh produce markets were achieved in February of 2018 and
March of 2018.
105000 40000
4500 35000
4000
30000
3500
Volume in Tons
Price R/Tons
25000
3000
2500 20000
2000 15000
1500
10000
1000
5000
500
0 0
JAN FEB MAR APR MAY JUN JUL AUG SEP OCT NOV DEC
2018 TONS 2019 TONS 2020 TONS
2018 R/TON 2019 R/TON 2020 R/TON
Figure 7: Price and quantity of plums sold through the NFPMs (2018-2020)
Source: DAFF (2020)
During summer, nectarines are very popular among all market segments. Three (3)
nectarine cultivars were passed for export, namely Arctic Wolf, September Red and
Arctic Snow. Figure 8 highlights the main market destinations for nectarines exported
from South Africa in week 11 of the 2019/20 season. The UK was the principal importer
of nectarines from South Africa, with a share of 48 %, followed by Europe (31 %), the
Middle East (16 %), Indian Ocean Islands (IOI) and Far East & Asia (2 % each), and
Africa (1 %).
11Far East & Asia Africa IOI USA &
2% 1% 2% Canada
0%
Russian
UK Federation
48% 0%
Europe
31%
Middle East
16%
Figure 8: Main export destinations for South Africa’s nectarines
Source: Hortgro (2020)
Figure 9 highlights the sales and average price trends of nectarines from January
2018 to January 2020. The highest sales of nectarines occur towards the beginning
and the end of each year. A total of 9 966.45 tons (9 122.43 tons) were sold at an
average price of R15,436.67 per ton (R 17 413.86 per ton) during the 2018 (2019)
seasons. In 2020 (January), a total of 1 587.42 tons were sold at an average price of
R17 583.98 per ton. In 2018, the highest sales (by volume, 2 018.90 tons) were
recorded in March at an average price of R13 985.36 per ton, while during 2019 the
highest sales (1 978.20 tons) were reached in December.
122500.00 45000.00
40000.00
2000.00 35000.00
1587.42
Volume in Tons
30000.00
Price in R/Ton
1500.00
25000.00
20000.00
1000.00 17583.98
15000.00
500.00 10000.00
5000.00
0.00 0.00
JAN FEB MAR APR MAY JUN JUL AUG SEP OCT NOV DEC
2018 TONS 2019 TONS 2020 TONS
2018 R/TON 2019 R/TON 2020 R/TON
Figure 9: Price and quantity of nectarines sold through the NFPMs (2018-2020)
Source: DAFF (2020)
The largest proportion of peaches produced in the country are used for processing
(peach juice) and drying. Only smaller quantities of fresh peaches are exported to the
international markets. Figure 10 illustrates the main market destinations for fresh
peaches exported by South Africa in week 11 of 2019/20. The Middle East absorbed
about 45 % of peaches from South Africa, followed by the UK (38 %), Europe (9 %),
Indian Ocean Islands (IOI) (4 %) and Far East & Asia (2 %). Both the Russian
Federation and Africa constituted about 1 % of South Africa's total peach exports.
13UK
38%
Middle East
45%
IOI
Europe 4%
9%
Far East & Asia
Africa 2%
1%
Russian
Federation
1%
Figure 10: Main export destinations for South Africa’s peaches
Source: Hortgro (2020)
Figure 11 illustrates the trends for peaches sold through the NFPMs in terms of
quantity and average price for 2018, 2019 and 2020 (January). In 2018, South Africa
sold 14 346.03 tons at an average sales price of R11 889.59 per ton, and the highest
sales (by volume) were recorded in January. In 2019, about 11 708.63 tons were sold
in the local markets at an average sales price of R13 861.03 while 2020 (January)
sales by volume and price amounted to 3 431.15 tons at R11 378.02 per ton. It is worth
noting that the 2020 January sales were higher than the 2019 sales during the same
month.
144000.00 40000.00
3500.00 35000.00
3000.00 30000.00
Volume in Tons
Price in R/Ton
2500.00 25000.00
2000.00 20000.00
1500.00 15000.00
1000.00 10000.00
500.00 5000.00
0.00 0.00
JAN FEB MAR APR MAY JUN JUL AUG SEP OCT NOV DEC
2018 TONS 2019 TONS 2020 TONS
2018 R/TON 2019 R/TON 2020 R/TON
Figure 11: Price and quantity of peaches sold through the NFPMs (2018-2020)
Source: DAFF (2020)
Figure 12 indicates the main market destinations for apricots that South Africa
supplied to the global markets in week 11 of 2019/20. The Middle East ranked as the
principal importer of South Africa’s apricots with a share of 40 %, followed by Europe
(27 %), the UK (30 %), Africa (2 %) and the Indian Ocean Islands (IOI) (1%).
Middle East
40%
UK
Europe 30%
27%
IOI Africa Far East & Asia
1% 2% 0%
Figure 12: Main export destinations for South Africa’s apricots
Source: Hortgro (2020)
15Figure 13 indicates the volume of apricots sold through the NFPMs and the
corresponding price trends for 2018, 2019 and 2020 (January). During 2018,
approximately 975.26 tons were sold at an average price of R13 904.17 per ton, with
the highest sales being attained in December 2018 at a volume of 432.31 tons. In
general, there were higher sales of apricots in 2019 as compared to 2018. In 2019,
about 792.26 tons were sold at an average price of R17 545.48 per ton. The 2020
local market sales only capture the month of January, which achieved a sales volume
of 46.77 tons at a sales price of R11 049.82 per ton.
500.00 100000.00
450.00 90000.00
400.00 80000.00
350.00 70000.00
Volume in Tons
Price in R/Ton
300.00 60000.00
250.00 50000.00
200.00 40000.00
150.00 30000.00
100.00 20000.00
50.00 10000.00
0.00 0.00
JAN FEB MAR APR MAY JUN JUL AUG SEP OCT NOV DEC
2018 TONS 2019 TONS 2020 TONS
2018 R/TON 2019 R/TON 2020 R/TON
Figure 13: Price and quantity of apricots sold through the NFPMs (2018-2020)
Source: DAFF (2020)
4. Fruit industry perspectives
The following section focuses on current issues affecting the fruit industry, and also
provides an analysis of how the industry is performing in terms of addressing
developmental issues and where it could improve. In this issue, the focus is on the
table grape industry’s trade with China.
4.1. Table grape exports to China amidst the COVID-19 outbreak and the
associated barriers to trade
Towards the end of last year (November 2019), the South African Table Grape
Industry (SATI) outlined its interest in prioritising China as the top strategic export
market, given that China has a large population, fast-growing economy and good
reputation in consuming fruits. In addition, the two countries’ harvesting seasons occur
during different calendar months, implying that South Africa's supply of table grapes
to China only complements what China produces. Furthermore, prioritising China as
16a market of strategic importance comes at an opportune time during which there is
growing interest in increasing bilateral trade flow, particularly under the leadership of
President Cyril Ramaphosa of South Africa and President Xi Jinping of China. SATI
has taken bold steps to ensure the export of table grapes that meet Chinese market
requirements – e.g. the growing of seedless varieties. In addition, the industry is
enthusiastic in embarking on a promotional campaign during which products are
envisaged to be marked with a South African Table Grapes logo.
However, during mid-December of 2019, there was an outbreak of the ongoing
coronavirus pandemic which started in China (Wuhan Province). As of 1 April 2020,
the pandemic had been responsible for more than 858 363 infections and 42 630
deaths globally, with China accounting for 9 % of infections and 8 % of deaths. In
South Africa, 1 353 people were reported to be struggling for their lives, 31 had
recovered and three had died (See link for updates in real-time
https://infographics.channelnewsasia.com/covid-19/map.html). Furthermore, the
coronavirus has directly disrupted trade as well as the global transport sector, and
thereby the global economy. This section aims to provide insight into how South
Africa's table grape trade has been affected, given that the outbreak is occurring at a
time when exports are tending towards the peak. This article also presents some of
the non-tariff barriers (NTBs) imposed on South Africa's table grapes by China, based
on the country’s official regulations.
According to TradeMap, South Africa is the third-largest supplier of fresh table grapes
to China, after Peru and the USA. Generally, Peru and the USA start harvesting much
earlier (around August and September) than South Africa. Data from the South African
Revenue Service (SARS) reveals that in January of 2020, South Africa exported about
2 287 tons of fresh grapes to China, worth close to R68.2 million. In comparison to the
same period in 2019, this represents a 227 % increase in the value of table grapes
exported to China. Similarly, an increase (83 %) in table grape exports was observed
during December of 2019, compared to what was exported in December of 2018.
Figure 14 illustrates table grape exports.
1780000000
70000000
60000000
Value (Rands)
50000000
40000000
30000000
20000000
10000000
0
201812
201701
201702
201703
201711
201712
201801
201802
201803
201804
201901
201902
201903
201904
201912
202001
2017 2018 2019 2020
Year, month
Figure 14: Table grape exports to China, 2017-2020
Source: Author’s compilation based on SARS data
Generally, there is an increasing trend for table grapes destined for China. Despite the
outbreak of the coronavirus in December last year, the latest data suggests that the
epidemic has not yet negatively impacted on South Africa’s exports to China, possibly
due to the high population in China coupled with their traditionally high consumption
rate of fruits, as well as the fact that China’s harvesting is out of season.
With regard to the non-tariff measures (NTMs), this section delves more into those
measures affecting South Africa’s table grapes based on the existing bilateral trade
arrangements with China. South Africa and China have a bilateral trade arrangement
mandated by Cooperation Agreements on “Animal Quarantine and Animal Health” and
“Plant Quarantine Notice”. Details are enshrined in the circular of the Ministry of
Foreign Trade and Economic Cooperation, the National Entry-Exit Inspection and the
Quarantine Bureau on the Implementation of the Cooperation Agreements. These
agreements have been in force since the early 2000s.
In this context, South Africa’s table grapes are subject to two categories of NTMs,
namely Sanitary and Phytosanitary (SPS) and Export-Related measures. For the SPS
and Export-Related measures, China imposes eight requirements that must be
fulfilled. Four of the requirements are linked to compliance with conformity
assessments, i.e. table grapes exported to China must be accompanied by a
certificate to ensure that the product adheres to food safety and environmental
requirements. In addition, other requirements are to ensure that South Africa's table
grapes adhere to the strict quarantine requirements stipulated by China.
18The other four requirements in this category are to ensure that table grapes of South
African origin meet the labelling, marking and packaging requirements while
emphasising the production and post-production processes. In particular, according to
the agreement, a later category of the four requirements stipulates “avoid the use of
straws, leaves and other plant materials that might be infected by pests and diseases
for packaging and bedding materials. Transport, packaging and bedding materials
shall go through appropriate quarantine and disinfection treatment.” Quality Control
(QC) measures imposed by China fall under the Export-related measures. QC
measures relate to non-automatic licensing, quotas and prohibitions, among other
quantity control measures. Specifically, the bilateral agreement compels South African
companies intending to export genetically modified agricultural products produced by
using agricultural genetically modified organisms or containing ingredients of
agricultural genetically modified organisms, to make an application to the competent
agricultural administrative department of China, coupled with several strict conditions
that must be met before approval of the application is made. Interestingly, there is only
one QC measure that South Africa must meet as compared to China's other trading
partners.
Conclusively, the trajectory of South Africa’s table grape exports to China is very
promising despite the ongoing coronavirus pandemic. It might still be too early to
assess the full impact the pandemic might have on the industry. Yet, a comparison
with the previous year's exports for the period since the start of the pandemic reveals
that South Africa's table grape exports destined for China are doing well. Given that
South Africa has also registered confirmed cases of the pandemic, it is critical for SATI
and the South African government, in general, to curb the further spread of the
pandemic, especially before the start of the winter season, given that the virus
proliferates more in cold conditions. Also, South Africa's table grapes are subjected to
fewer NTMs, i.e. SPS and Export-Related measures, as compared to China's other
trading partners, thanks to the existing bilateral trade arrangements through which
South Africa receives some preferential treatment.
19REFERENCES
Agrihub. 2020. Grapes weekly exports (destinations). Available online at
https://www.agrihub.co.za/reports/
DAFF (Department of Agriculture, Forestry & Fisheries). 2020. Local market fruit sales
data. Pretoria: Directorate of Agricultural Statistics.
Freshplaza. 2020. Overview global table grape market. Available online at
https://www.freshplaza.com/article/9180638/overview-global-table-grape-market/
Hortgro. 2019. Slight upturn in prospects for South African 2019/2020 stone fruit
exports. Available online at https://www.hortgro.co.za/wp-
content/uploads/docs/2019/10/south-africa-stone-fruit-forecast-2019_2020.pdf
Hortgro. 2020. Stone fruit export data. Paarl: Information and Market Intelligence
Division.
SARS (South African Revenue Service). 2020. Trade statistics data. South Africa.
Available online at https://tools.sars.gov.za/tradestatsportal/Download.aspx?&c=1.
SATI (South African Table Grape Industry). 2020. South African Table Grape Industry
– Third Crop Estimate for 2019/2020 season. Available online at
https://www.satgi.co.za/download/sati-press-release-3rd-crop-estimate-2019-
2020-season-31-january-2020-pdf/
USDA (United States Department of Agriculture) Foreign Agricultural Service. 2020.
Production, supply and distribution. Washington, DC: USDA. Available online at
https://apps.fas.usda.gov/psdonline/app/index.html#/app/downloads.
USEFUL LINKS
Bureau for Food and Agricultural Policy (BFAP) www.bfap.co.za
Citrus Growers’ Association (CGA) www.cga.co.za
Department of Agriculture, Forestry and Fisheries (DAFF) www.daff.gov.za
Food and Agriculture Organisation (FAO) www.fao.org/docrep/
Fresh Produce Exporters’ Forum (FPEF) www.fpef.co.za
Hortgro Services www.hortgro.co.za
National Agricultural Marketing Council (NAMC) www.namc.co.za
Perishable Products Export Control Board (PPECB) www.ppecb.com
Quantec Easy Data www.quantec.co.za
South African Subtropical Growers’ Association (Subtrop) www.subtrop.co.za
South African Table Grape Industry (SATI) www.satgi.co.za
20© 2020. Published by the National Agricultural Marketing Council (NAMC).
DISCLAIMER
The information contained in this document results from research funded wholly or in
part by the NAMC acting in good faith. Opinions, attitudes and points of view
expressed herein do not necessarily reflect the official position or policies of the
NAMC. The NAMC makes no claims, promises or guarantees about the accuracy,
completeness or adequacy of the contents of this document, and expressly disclaims
liability for errors and omissions regarding the content thereof. No warranty of any
kind, implied, expressed or statutory, including but not limited to the warranties of no
infringement of third-party rights, title, merchantability, fitness for a particular purpose
or freedom from computer virus, is given with respect to the contents of this document
in hard-copy, electronic format or electronic links thereto. References made to any
specific product, process or service by trade name, trademark, manufacturer or
another commercial commodity or entity are for information purposes only and do not
imply approval, endorsement or favouring by the NAMC.
For Correspondence:
Dr. Sifiso Ntombela
(+27) 12 341 1115
Sifiso@namc.co.za
Private Bag X935
Pretoria, 0001
21You can also read